

Power Your Software Testing with AI Agents and Cloud
The Native AI-Agentic Cloud Platform to Supercharge Quality Engineering. Test Intelligently and Ship Faster.


- TestMu AI (Formerly LambdaTest)
- /
- Learning Hub
- /
- Playwright Reporting: Reporters, HTML Reports, and show-report
Playwright Reporting: Reporters, HTML Reports, and show-report
How Playwright reporting works: every built-in reporter, where playwright-report/index.html lives, and what npx playwright show-report actually does.

Last Updated on:
A Playwright run either passes or it does not. The report is where you find out why, and Playwright ships eight of them for the different people reading a test automation pipeline.
Which one you reach for depends on who is reading. A developer debugging locally wants screenshots and a trace, a continuous integration pipeline wants a machine-readable file it can gate a merge on, and stakeholders want a trend line across builds. Depending on your automation testing framework and language, third-party tools such as Allure and Extent Reports cover what the built-in reporters do not.
TL;DR
npx playwright show-report serves the last HTML report on a local web server (port 9323 by default) and opens it in your browser; it reads from the playwright-report folder, and you can point it elsewhere with npx playwright show-report my-report. Playwright ships eight reporters, list, line, dot, html, json, junit, blob, and GitHub, configurable via the CLI or playwright.config.js.
- Best for visual debugging: HTML Reporter - This built-in tool generates an independent folder containing a web page report with pass/fail results, error logs, step-by-step logs, screenshots, and video recordings.
- Best for clean CI logs: Dot Reporter - This reporter represents passed tests as dots and failed tests as 'F', minimizing console output to avoid cluttering continuous integration logs.
- Best for large test suites: Line Reporter - This concise reporter displays execution progress on a single line, showing only the last completed test and outputting error messages inline if failures occur.
- Best for step-by-step console tracking: List Reporter - This built-in reporter prints a detailed line for each individual test directly to the terminal, making it easy to monitor local test runs.
- Best for advanced trend analysis: Allure - This third-party reporting tool integrates with Playwright to provide richer dashboards, historical trend tracking, and deeper continuous integration features for large teams.
- Best for XML integration: JUnit Reporter - This is a built-in Playwright reporter that generates structured, actionable test reports after every execution.
- Best for structured data: JSON Reporter - This is a built-in Playwright reporter designed to capture and output structured test run results.
- Best for GitHub integration: GitHub Actions annotations - This is a built-in Playwright reporter used to capture and share structured test run results.
- The HTML reporter cannot merge sharded runs on its own. Use the blob reporter on each shard, then merge the blobs into one HTML report.
How to Open the Playwright HTML Report
Run npx playwright show-report. Playwright writes the HTML report to the playwright-report folder by default, and this command serves it on a local web server at port 9323, opening your browser at the last run's results.
npx playwright show-reportThe command serves the report rather than just pointing at the file, which is why it is the documented way to open it instead of navigating to playwright-report/index.html by hand. If port 9323 is busy, Playwright picks any available port.
Point it at a different folder by passing the name, which matters when you have changed the output directory or downloaded a report from CI:
npx playwright show-report my-reportTo change where the report is written in the first place, set outputFolder on the HTML reporter in your config, or use the PLAYWRIGHT_HTML_OUTPUT_DIR environment variable.
// playwright.config.js
module.exports = {
  reporter: [['html', { outputFolder: 'my-report' }]],
};
The command also accepts a .zip archive and extracts it to a temporary directory before serving, which is the fastest way to inspect a report pulled down from a CI artifact. Every detail here is documented in the Playwright test reporters documentation.
Why Test Automation Reports?
Test Automation Reports play a critical role in any test automation framework. It is important to generate the test automation report when running a test suite where you have group test cases and want to analyze the outcome.
As a result, a more thorough analysis of your findings can contribute to the test automation framework being more solid and stable, along with keeping the test treads. These test reports are helpful in several ways from the beginning of the development cycle by spotting the bugs early, enabling you with faster shipping and accelerated dev feedback time.
Metrics can differ depending on the type of test being run when you are doing cross browser testing. Hence reporting becomes an essential part. A good automation test report will show some of the below-mentioned information:
- Test Suite Name
- Environment Name (OS/browser)
- Build Name
- Overall Test Results (Passed, Failed, and Skipped test scripts)
- Total Number of Test Cases
- Test Case Details (Status, Steps, Test Assertions Status, Line of Error, Screenshot and Video)
- Duration of Test Suite Execution
- Duration of each Test Case Execution
- Historical trend of each Test Case
Now we will take a deeper look into Playwright reporting. However, if you are getting started with the Playwright framework and want to know more about it, let’s have a quick look at it.
What is Playwright?
Playwright is a popular open-source Node.js library that allows developers to automate and test web applications across multiple browsers. It is created by Microsoft and supports Chrome, Firefox, Safari, and Edge. With Playwright, you can automate browser actions like clicking buttons, filling out forms, and navigating between pages.
It is designed to be fast, reliable, and easy to use. It supports multiple programming languages like JavaScript, TypeScript, Python, and Java, making it accessible to a wide range of developers.
One of the key features of Playwright is its ability to work with multiple browsers. This means you can test your web application across different browsers without having to write separate tests for each. Playwright also provides built-in support for headless mode, which allows you to run tests without a visible browser window, making it ideal for running tests in a CI/CD pipeline.
If you're new to Playwright, there are plenty of resources available to help you get started, including documentation, tutorials, and sample code. With its intuitive API and cross-browser support, Playwright is quickly becoming a popular choice for web application testing.
Getting started with Playwright
Installing Playwright is a straightforward process, and it can be done using npm (Node Package Manager). The first step is to ensure that Node.js and npm are installed on your computer. Here are the steps to follow to install Playwright:
Step 1: First, you need to have Node.js installed on your machine. You can download it directly from the Node.js website and install it on your machine if you are not already using it
Once installed, check the version:
node -v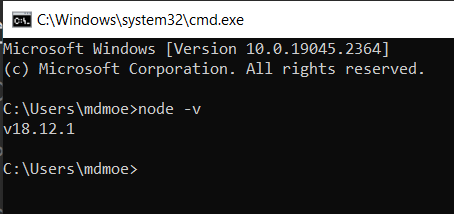
Step 2: Download and Visual Studio CodeInstall (this will help you write formatted code, but you can pick any text editor of your choice).
Step 3: Open Visual Studio Code
Step 4: Open your integrated Terminal and run the following command
mkdir playwright-reporters-demo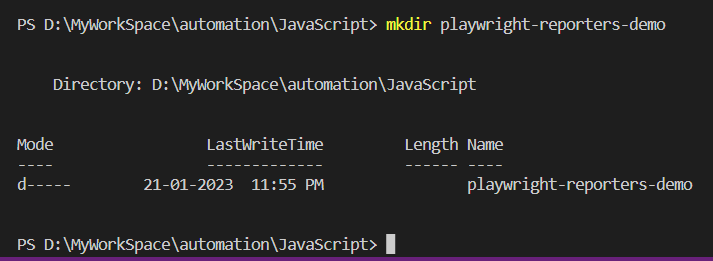
Step 5: Open the directory.
cd playwright-reporters-demo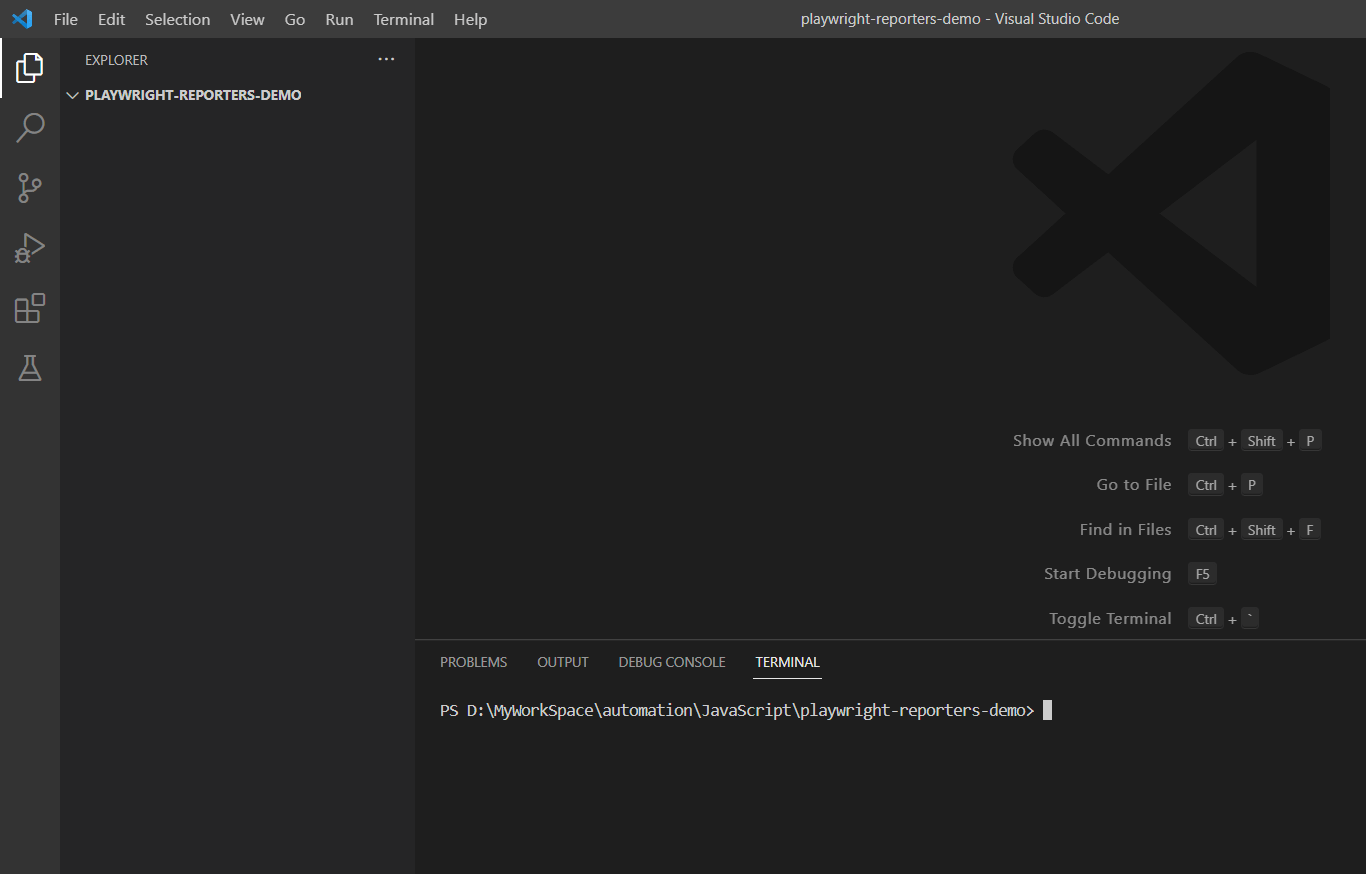
Step 6: Create a new package.json file with default values.
npm init -yYour package.json file should be like this:
{
  "name": "playwright-reporters-demo",
  "version": "1.0.0",
  "description": "",
  "main": "index.js",
  "scripts": {
    "test": "echo "Error: no test specified" && exit 1"
  },
  "keywords": [],
  "author": "",
  "license": "ISC"
}
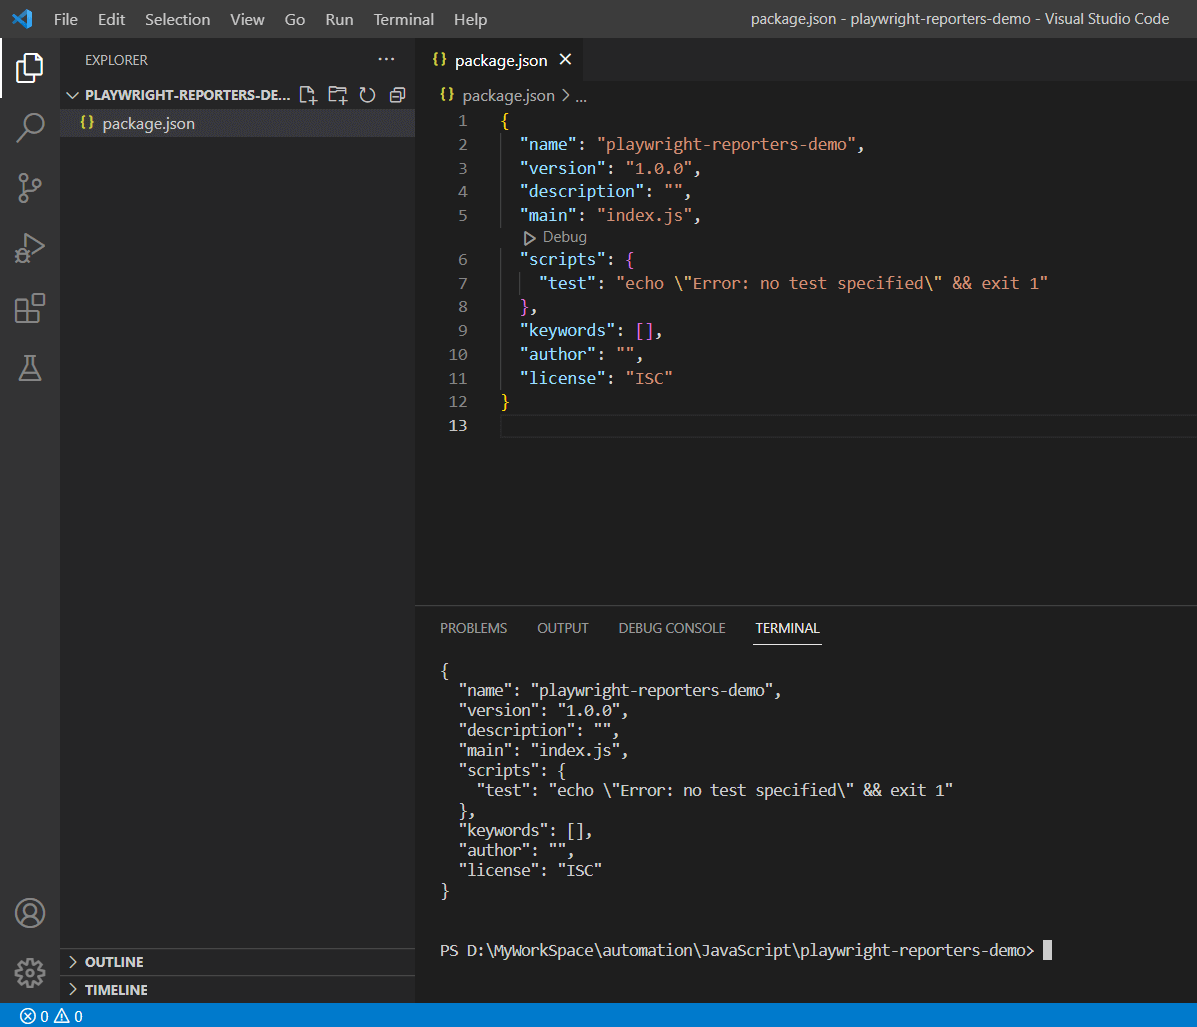
Step 7: Install the Playwright.
So you can install Playwright using npm or yarn, and another way is by VS Code Extension.
In this Playwright reporting tutorial, we will install the Playwright using the npm command.
On your terminal, type:
npm init playwright@latestAs soon as you enter the above comment, you will be prompted in the terminal few options to choose from:
- Type y to proceed with the installation.
- It will ask if you want to install TypeScript or JavaScript. Here you choose JavaScript.
- It will ask if you want to install TypeScript or JavaScript. Here you choose JavaScript.
- It will ask if you want to add end-to-end tests with the folder name as tests. If you want to change it, you can do so or hit enter to select the default.
- It will then ask if you want to add GitHub Actions Workflow. Here you will select N and skip this.
- It will finally ask if you want to install Playwright browsers, and if the default option is true, you will hit the Enter key.
- You are done, it will do its job and complete the installation with the setting you selected.
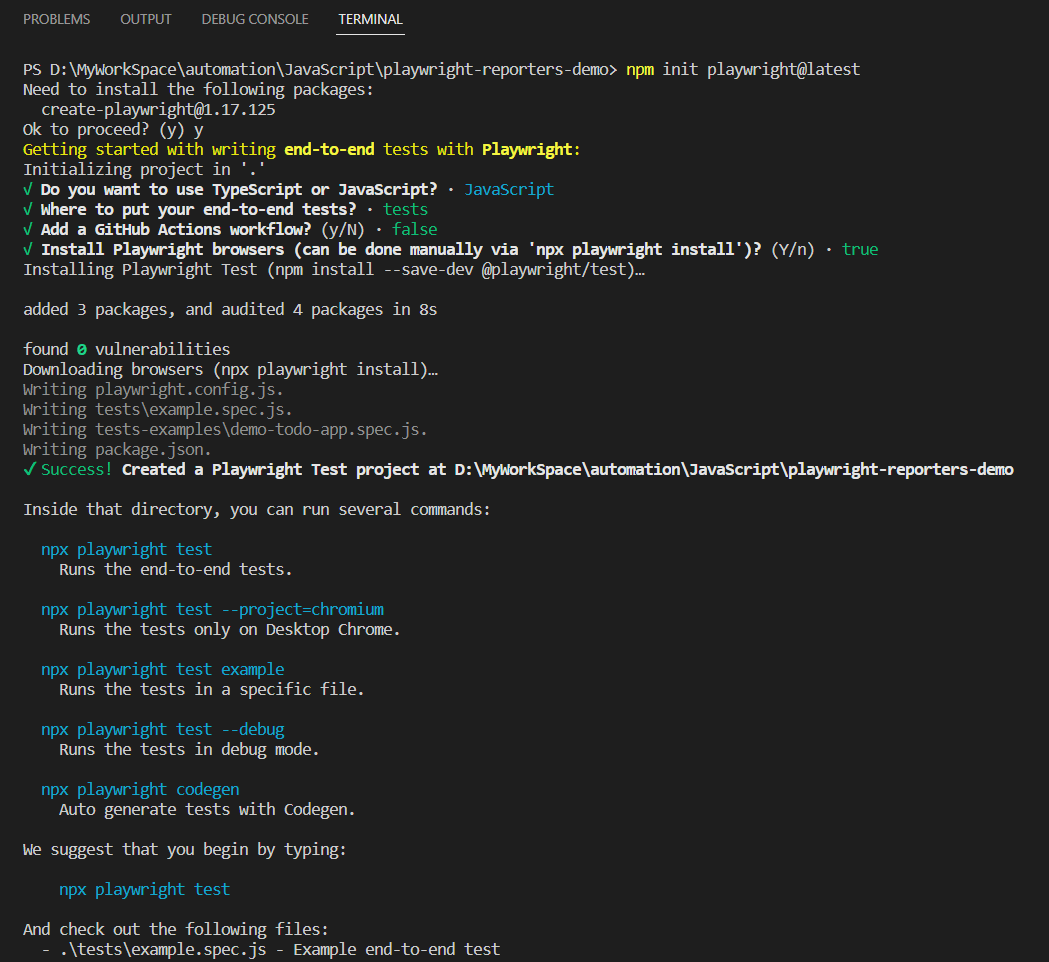

Once the installation is complete, node_modules will be created with all the dependencies installed in it.
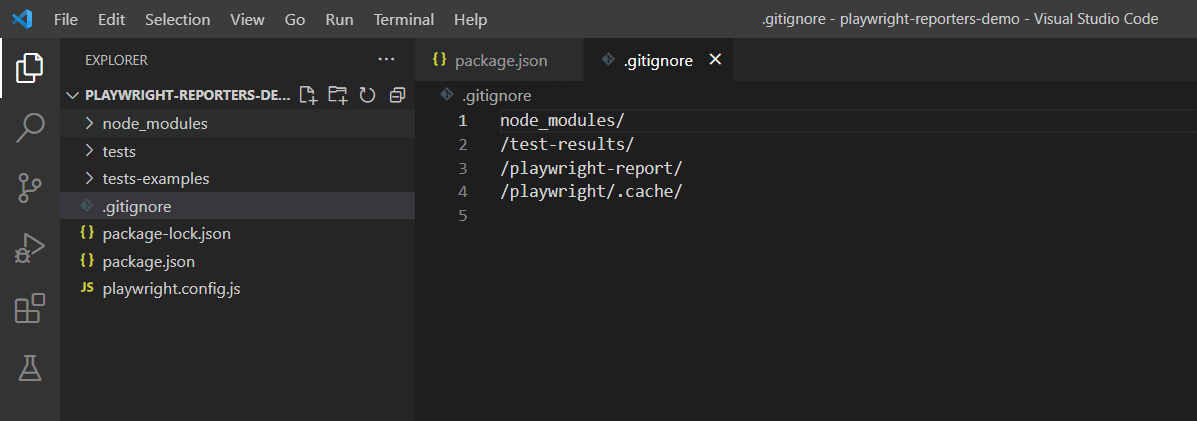
Step 9: By default .gitignore file will be created so that unwanted files are not committed to the code repository
node_modules/
/test-results/
/playwright-report/
/playwright/.cache/
Running test
Since we have installed Playwright with default options, it created an example spec file named example.spec.js in the tests folder. Let’s run the test:
npx playwright test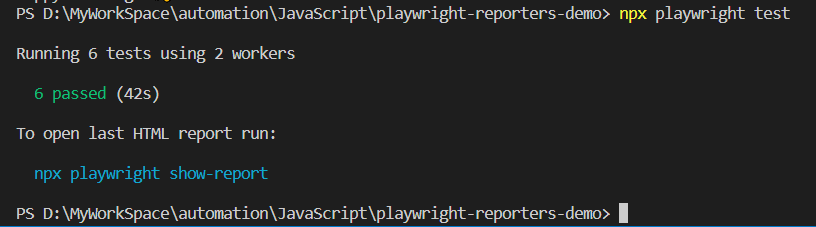
If you look into example.spec.js only 2 tests are present, but still, the console shows 6 passed (42s). It's because in the playwright.config.js configuration file, 3 browsers, Chromium, Firefox, and WebKit, are set so that each test will be executed twice on each of the browsers specified in the configuration
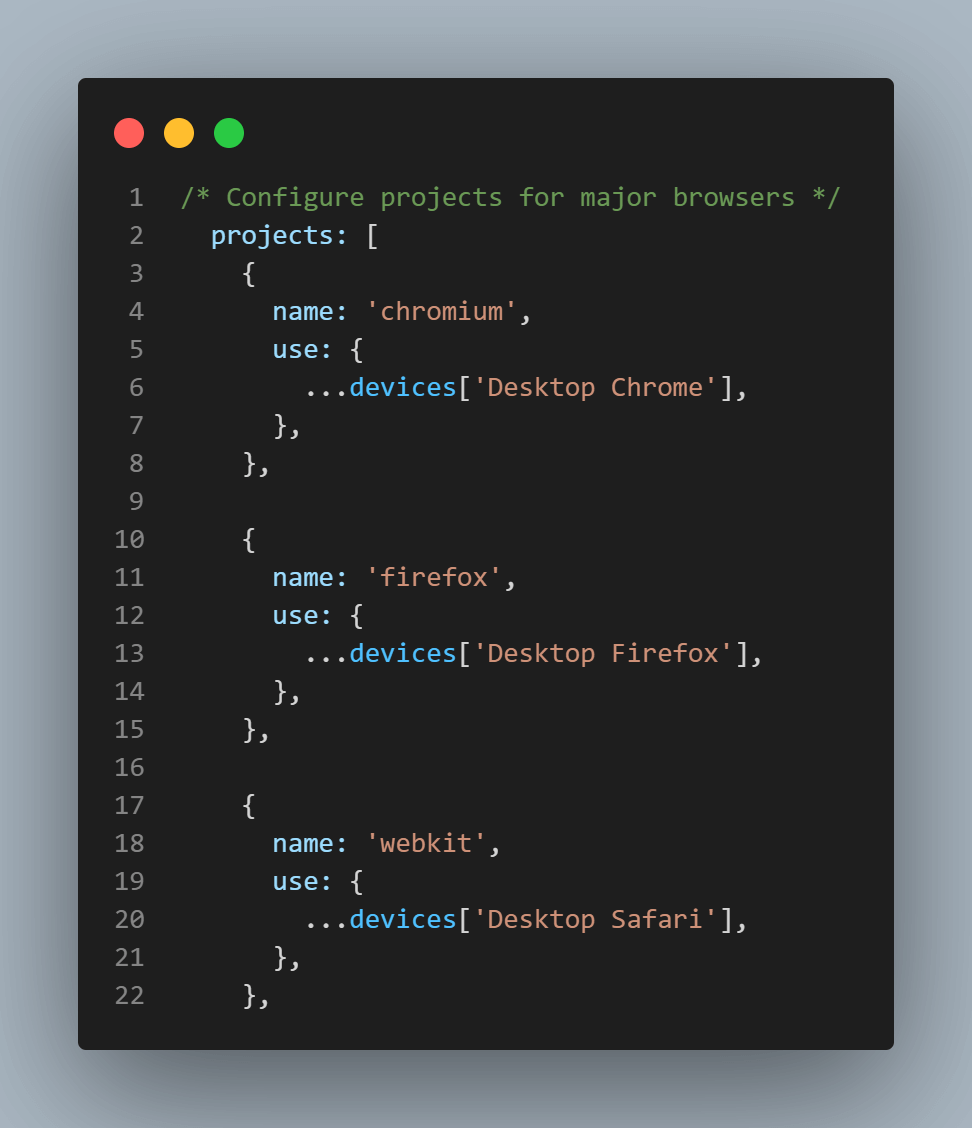
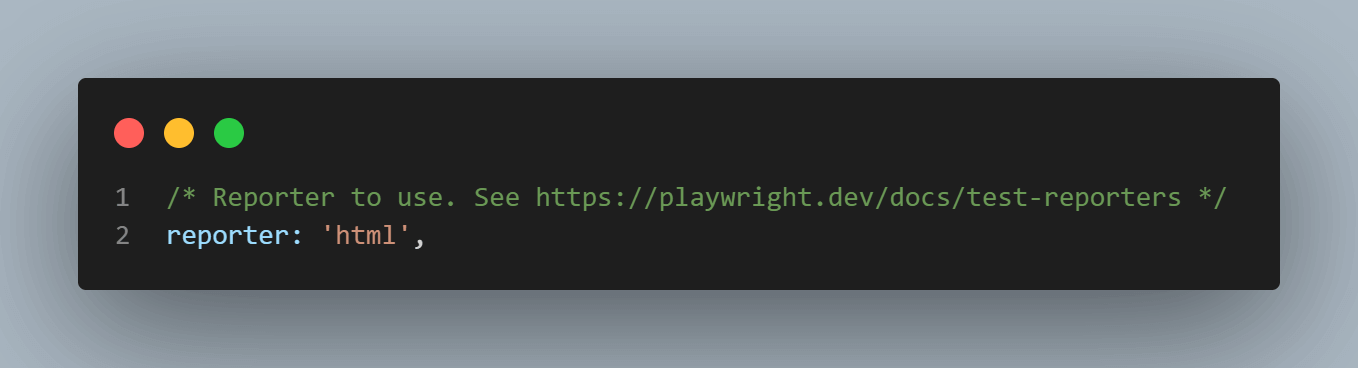
It will also generate a default HTML report because it’s the default reporter when you set up Playwright
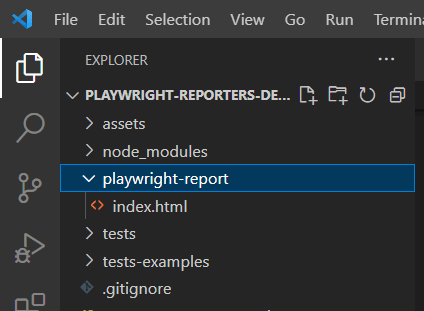
Open index.html from the playwright-report folder
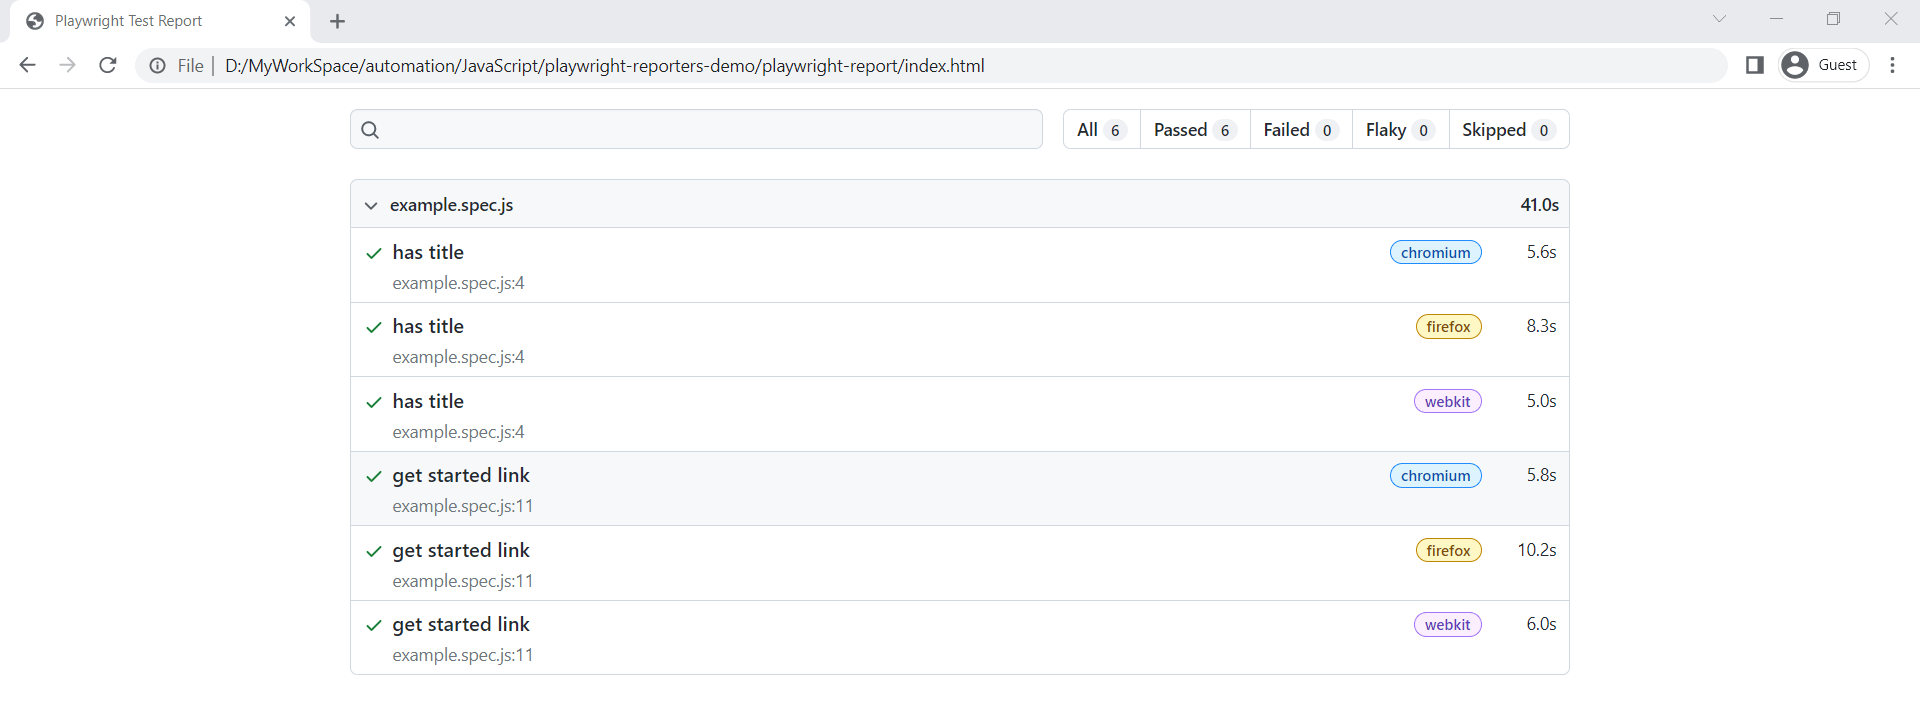
You can also use Playwright reporting by opening the report by running the following command on the terminal. It will open the same report from the default location
npx playwright show-reportRun Automated Playwright Tests Online. Try TestMu AI Now!
Playwright Reporting
Playwright is one of its kind with a built-in reporting mechanism. Playwright reporting gives you huge flexibility in generating reports in different patterns based on your need and use case.
These reports can either be generated by passing the --reporter command line option or you can also add them as a script in the package.json file.
npx playwright test --reporter=linePlaywright reporting can be used to generate reports or can be controlled programmatically in the configuration file, i.e., playwright.config.js, by specifying the reporters.
// Filename: playwright.config.js


const config = {
    reporter: 'line',
};


module.exports = config;
Multiple Reports
With Playwright reporting, you can use Multiple reports by generating multiple reports simultaneously.
Let’s take an example of a list and an HTML report in Playwright reporting. When you specify this either in the command line or in the configuration file, it will generate the list report, which will be shown in the console, and an HTML report will be generated.
// Filename: playwright.config.js


const config = {
    reporter: [
        ['list'],
        ['html']
    ],
};


module.exports = config;
Reports on CI
With this type of Playwright reporting, you can generate different kinds of reports on CI as well.
dot is one of the reports that will not clutter the log or console with too much output, and it's the default report on CI.
// Filename: playwright.config.js


const config = {
    // Concise 'dot' for CI, default 'list' when running locally
    reporter: process.env.CI ? 'dot' : 'list',
};


module.exports = config;
When the test is executed from CI, it will pick the dot reporter, but if it's run locally, it will show a list report in the console.
Reporting on CI is beyond the scope of this Playwright reporting tutorial, and we will be covering the same later in this Playwright testing series. For ready-to-use workflow files, sharding tests across parallel jobs with the blob reporter and merge-reports, and fixes for failures that only appear on the runner, see our guide to running Playwright tests in CI/CD pipelines.
Built-in Reporters
Playwright reporting gives a built-in option for reporters. You can generate it by passing the reporter in the command line or specifying it in the Playwright configuration file.
Before we get into actual test reporters, let's quickly set up the Playwright framework and run the example tests to see tests in action, and further, you will use it to create working example code.
Following are the Playwright built-in reporters:
- List Reporter
- Line Reporter
- Dot Reporter
- HTML Reporter
- JSON Reporter
- JUnit Reporter
- GitHub Actions annotations
Now, it’s time to look into the built-in reporters of Playwright reporting in detail.
List Reporter
It will print a line for each test being run, and test results will be reported in the console/terminal.
Command line
Since we already have 2 example tests in the example.spec.js file, let's run the test and see the results
npx playwright test --reporter=list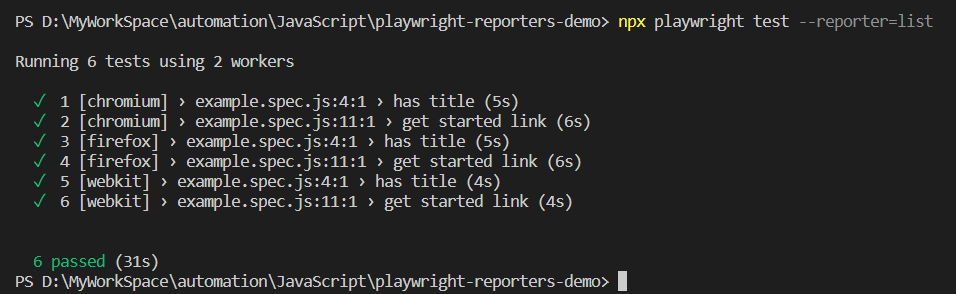
6 tests are executed, and it's listed on the console.
Playwright Config:
Instead of passing reporter in the command line, we can mention it under reporter in playwright.config.js.
// Filename: playwright.list.config.js


const config = {
    reporter: 'list',
};


module.exports = config;
Run the following command to use the configuration file created above, which has all the options discussed
npx playwright test --config=playwright.list.config.js
Now, if you add another sample test, it will fail for demonstration.
// Filename: fail.spec.js


const { test, expect } = require('@playwright/test');


test('has title', async ({ page }) => {
    await page.goto('https://playwright.dev/');
    await expect(page).toHaveTitle("Test Title to fail the test");
});
When you run the test, you will observe that the same test will fail 3 times as we have mentioned 3 browser configurations and the remaining 6 other tests will pass.
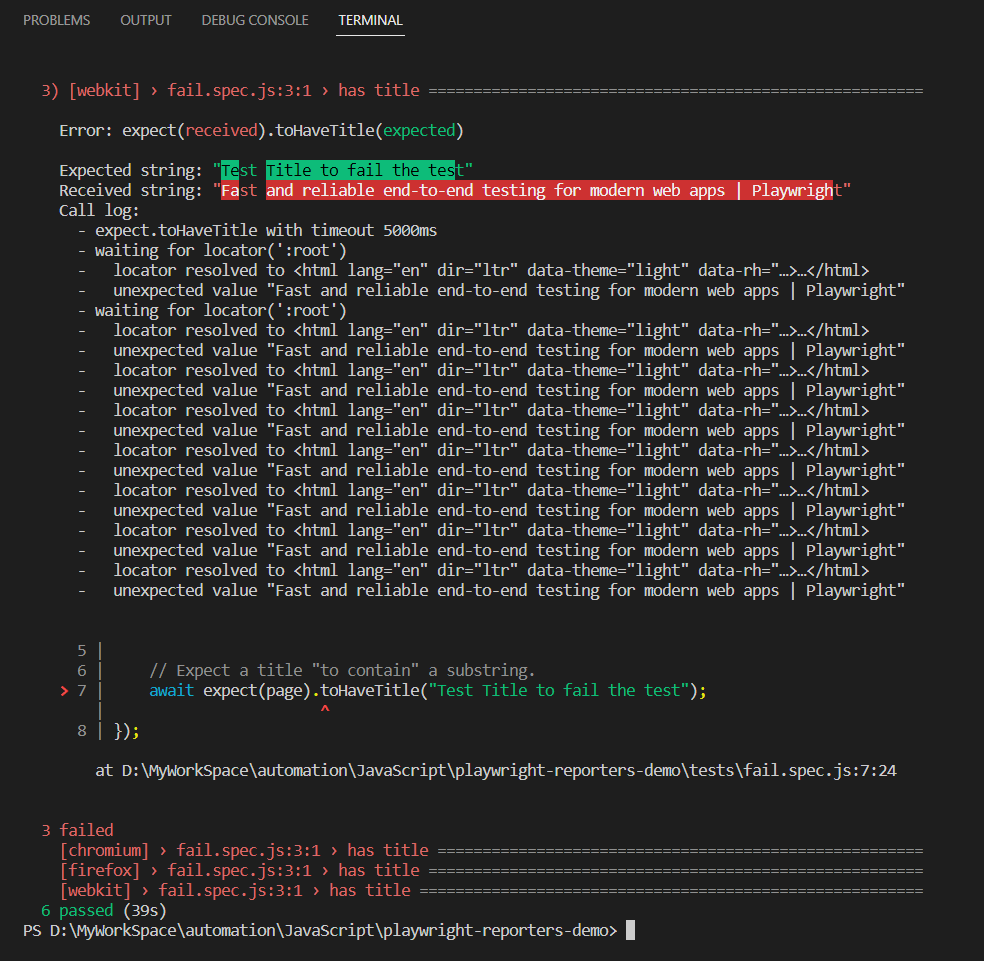
In this demonstration, we will comment on and uncomment this test to see the behaviors of reporters.
You can choose to render the step by passing the following config option:
// Filename: playwright.config.js


const config = {
    reporter: [['list', { printSteps: true }]],
};


module.exports = config;
Line Reporter
Line reporter is a concise reporting format that displays information in a single line, indicating the last completed tests, and only outputs error messages if they occur.
When you have large test suites, console logs can become cluttered if too much information is printed for each test. In this case, a Line reporter is used for Playwright reporting.
Even when there is a failure in the middle of the test run, it’s reported inline.
Command line
/npx playwright test --reporter=linePlaywright Config:
/// Filename: playwright.line.config.js


const config = {
    reporter: 'line',
};


module.exports = config;
Run the following command to use the configuration file created above, which has all the options discussed.
npx playwright test --config=playwright.line.config.js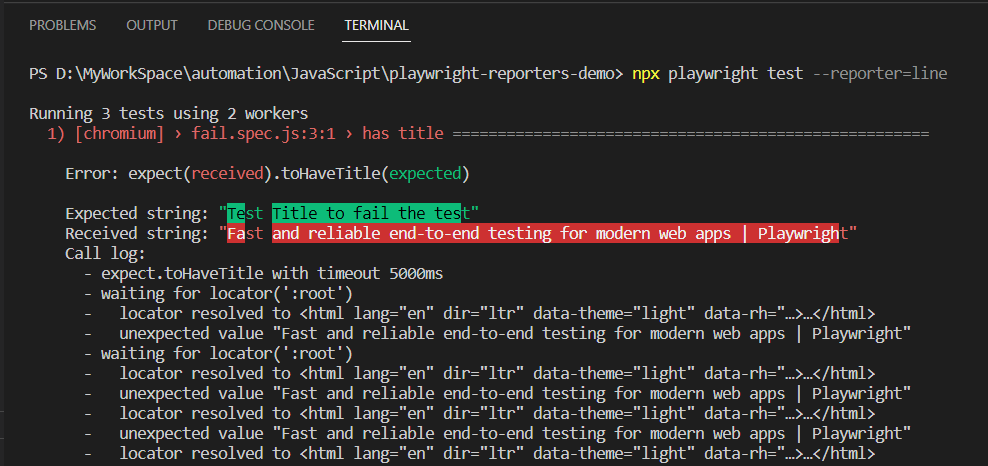
Dot Reporter
Dot reporter is the shortest form of reporting where passed tests are reported as dot and failed are shown as F. It’s the default reporter on CI and useful when you don’t want a lot of information to be reported on output.
Command line
npx playwright test --reporter=dotPlaywright Config:
// Filename: playwright.dot.config.js


const config = {
    reporter: 'dot',
};


module.exports = config;
Run the following command to use the configuration file created above, which has all the options discussed.
npx playwright test --config=playwright.dot.config.js 
Here is the example output where you can see that one test failed at the end of the test run.
HTML Reporter
After designing your automation framework as a next step, you look for a reporting tool that can be easily integrated with the test automation framework. The Playwright reporting makes life so easy and provides an HTML reporter that creates an independent folder containing the test report that can be used as a web page. It gives the overall test suite results, including individual test results.
Command line
npx playwright test --reporter=htmlPlaywright Config:
By default, the HTML reporter opens the index.html file in the default browser when execution is completed. You can change this behavior by using open property in the Playwright config. open property can have values like always, never, and on-failures (default). Here it's set to never, which means it will not open the report on its own.
Host property is used to specify the location/target IP address where you want to open the report. Here it’s specified 0.0.0.0, which will open the report on localhost.
Port property is used to specify the port on which you want to open the report. The default value is 9223.
// Filename: playwright.html.config.js


const config = {
    reporter: [['html', {
        open: 'never',
        host: '0.0.0.0',
        port: 9223,
    }]],
};


module.exports = config;
Run the following command to use the configuration file created above, which has all the options discussed.
npx playwright test --config=playwright.html.config.js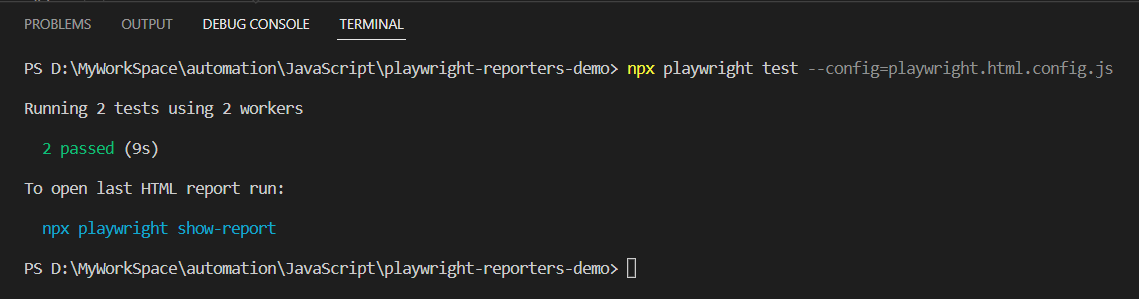
Example HTML Report
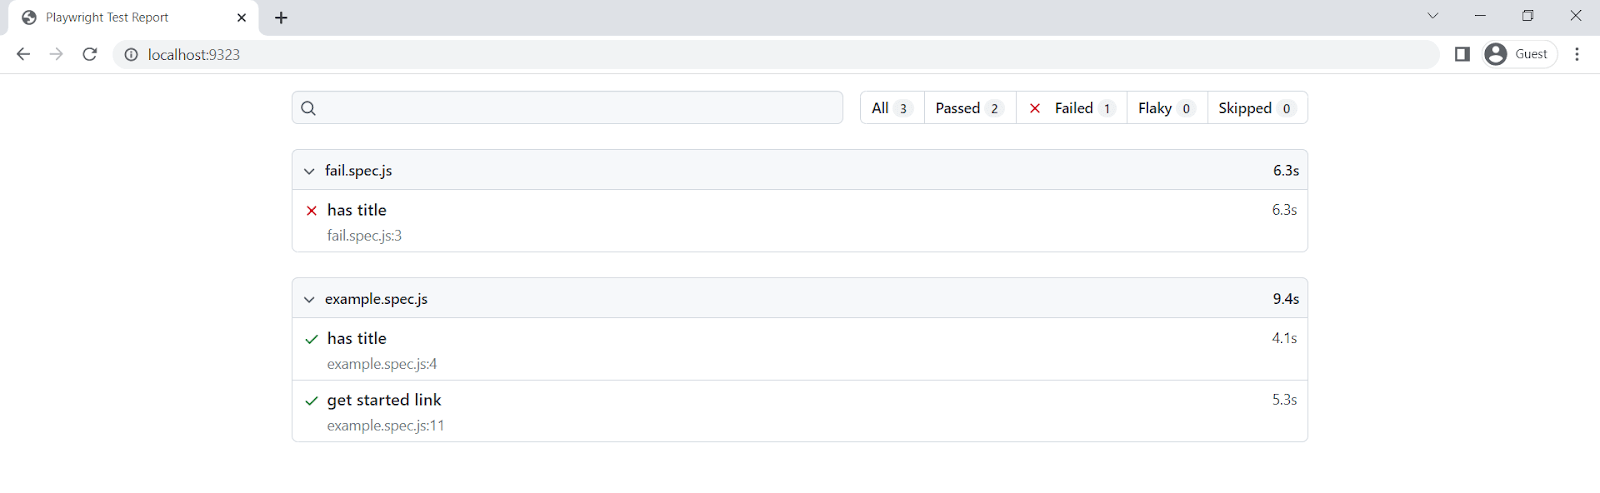
You can override the HTML output location by specifying the output folder location in the Playwright config file. Let’s say you want to store a report in the my-report directory.
// Filename: playwright.html.config.js


const config = {
    reporter: [['html', {
        outputFolder: 'my-report',
        open: 'never',
        host: '0.0.0.0',
        port: 9223,
    }]],
};


module.exports = config;
Run the following command to use the configuration file created above, which has all the options discussed.
npx playwright test --config=playwright.html.config.js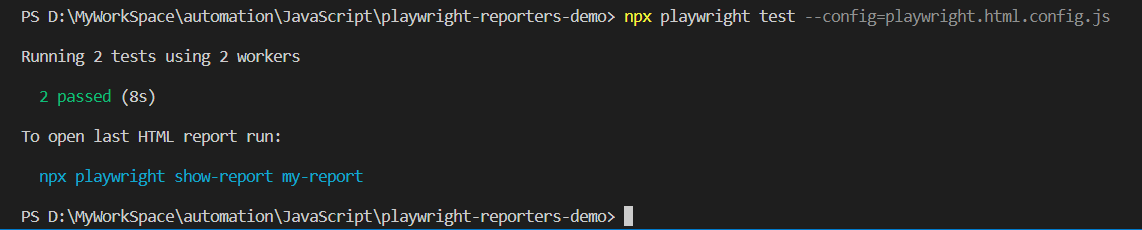
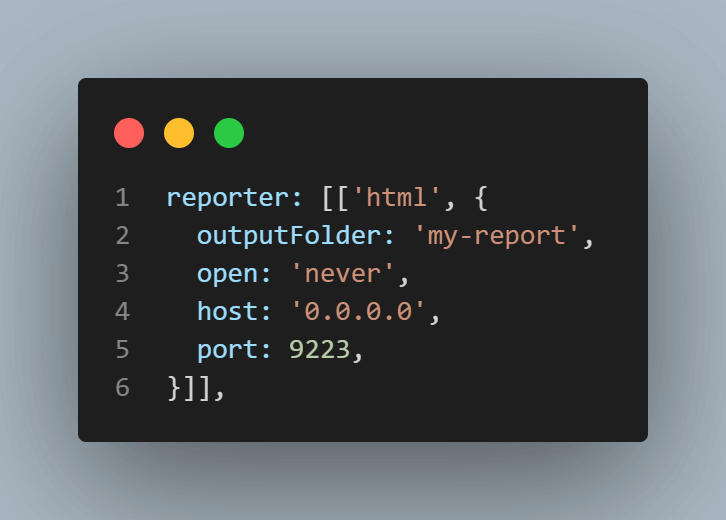
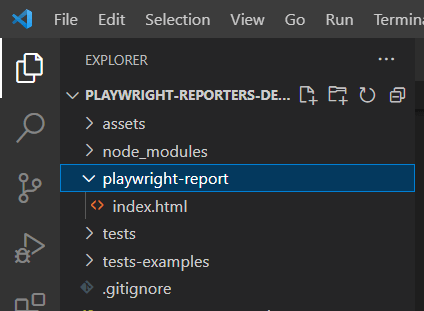
By using the simple commands, you can open the report if you have changed the default setting to never or on-failure. If you are using a custom folder, like here, we have my-report.
npx playwright show-report my-reportHTML reporter doesn’t support merging of reports generated across multiple `--shards`. When you run tests on multiple machines, you will have multiple reports to look at, but with the help of other third-party reporter solutions, you can overcome this.
JSON Reporter
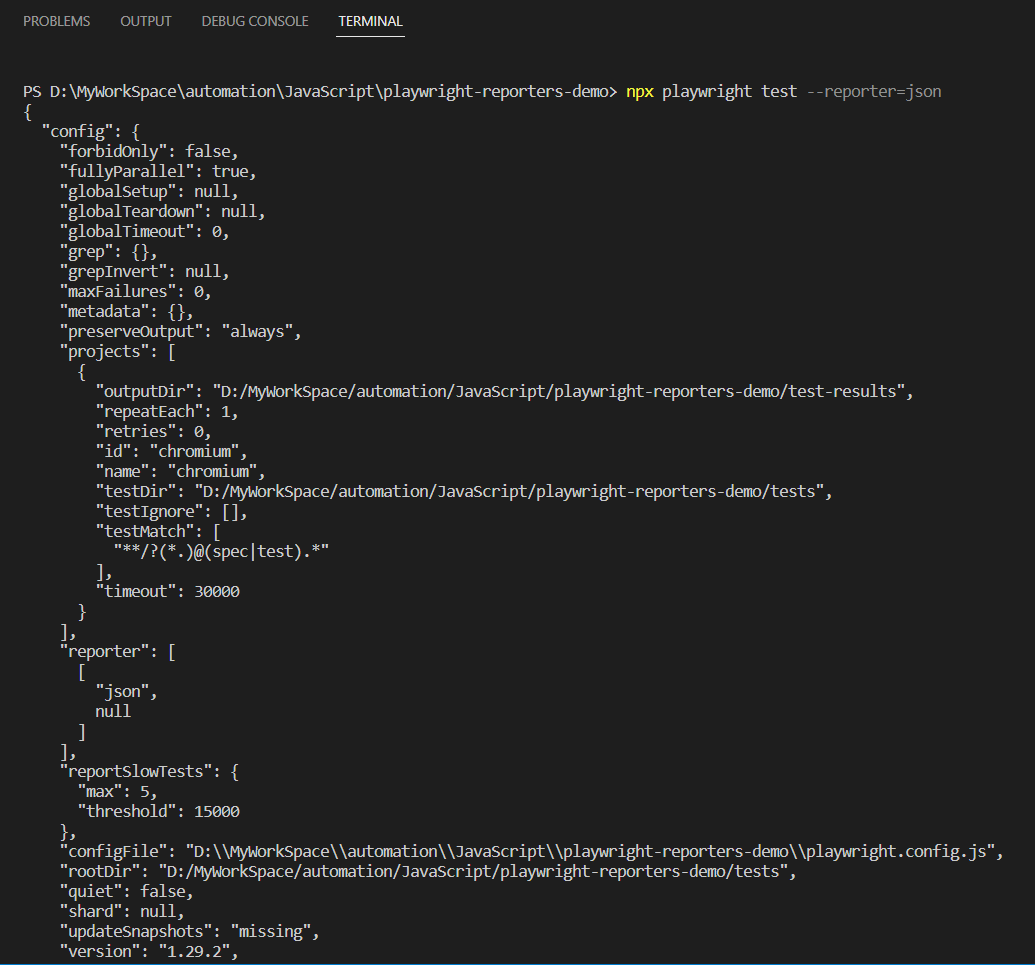
An object with all the information about the test run is stored when you use a JSON reporter for Playwright reporting.
Command line
npx playwright test --reporter=jsonWhen you run this command, it will display the JSON in the output/terminal
Playwright Config:
You can write the JSON to a file by specifying the output file.
// Filename: playwright.json.config.js


const config = {
    reporter: [['json', {
        outputFile: 'test-results.json',
    }]],
};


module.exports = config;
Run the following command to use the configuration file created above, which has all the options discussed.
npx playwright test --config=playwright.json.config.js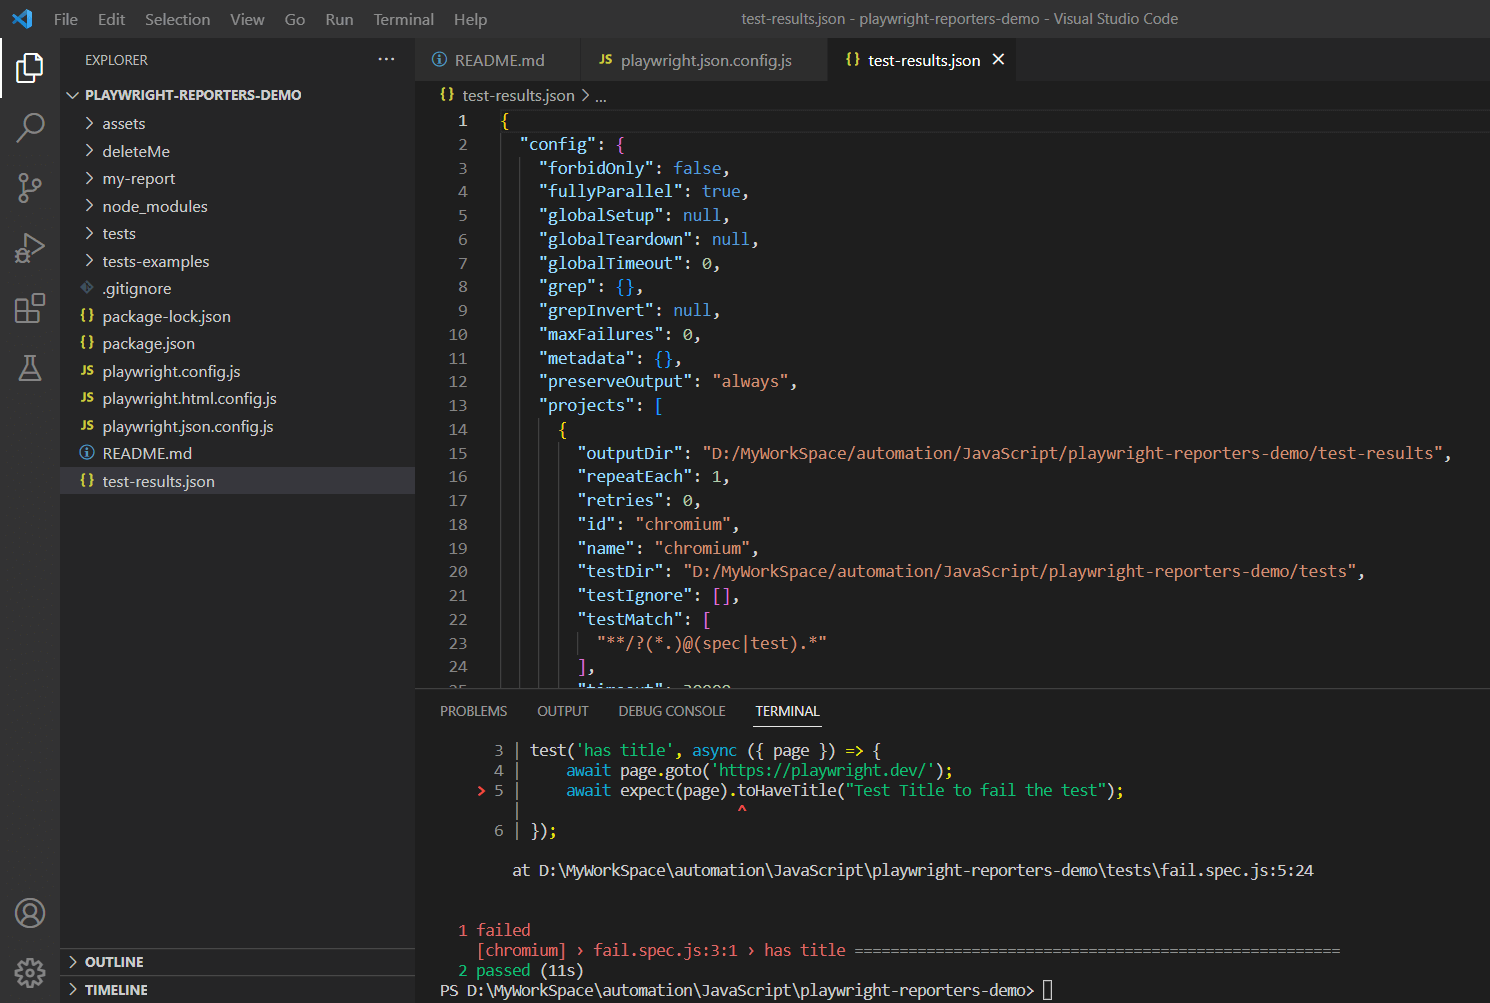
JUnit Reporter
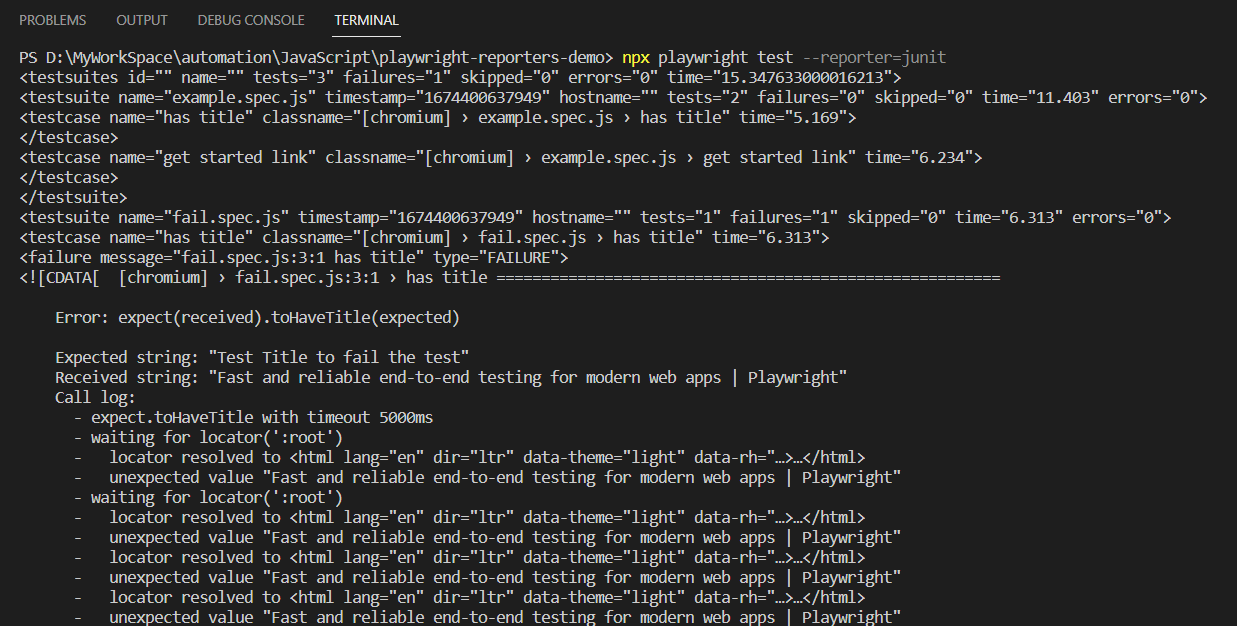
JUnit-style xml report can be created using Playwright JUnit reporter.
Command line
npx playwright test --reporter=junitWhen you run this command, it will display the JSON in the output/terminal.
Playwright Config:
You can write the XML to a file by specifying the output file.
// Filename: playwright.junit.config.js


const config = {
    reporter: [['junit', {
        outputFile: 'test-results.xml',
    }]],
};


module.exports = config;
Run the following command to use the configuration file created above, which has all the options discussed.
npx playwright test --config=playwright.junit.config.js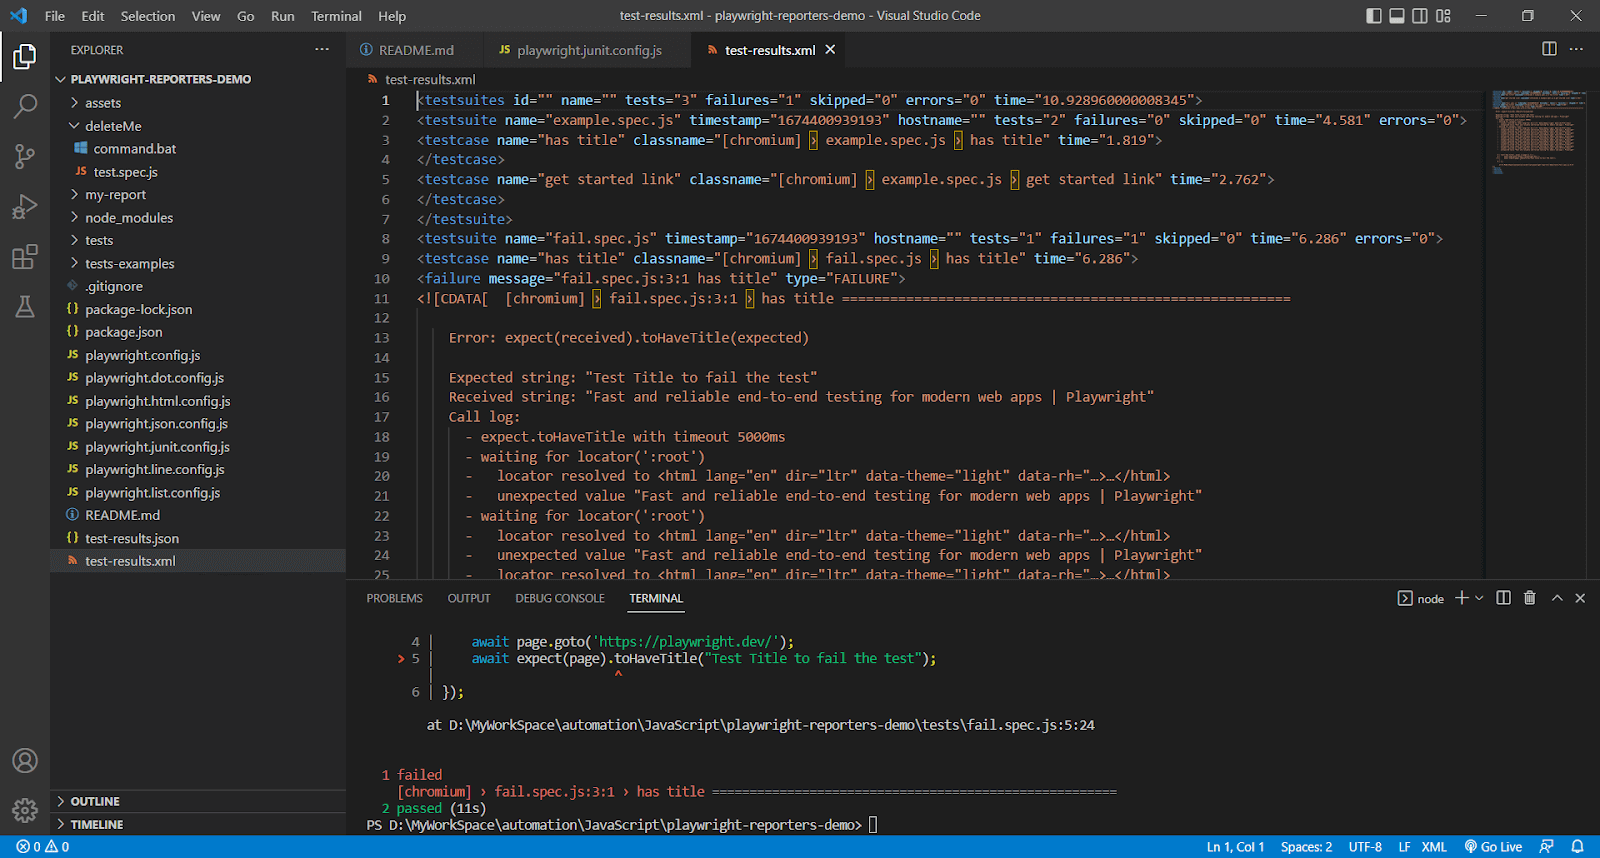
Custom Reporters
By implementing a class with some reporter methods, you can create a custom reporter for Playwright reporting.
Create a file with the name my-awesome-reporter.js.
class MyReporter {
onBegin(config, suite) {
console.log('====================================================== ');
console.log('Starting the run with ${suite.allTests().length} tests');
    console.log('======================================================');
}


    onTestBegin(test) {
        console.log('Starting test ${test.title}');
}


    onTestEnd(test, result) {
        console.log('Finished test ${test.title}: ${result.status}');
}


    onEnd(result) {
        console.log('======================================================');
    console.log('Finished the run: ${result.status}');
    console.log('======================================================');
}
}


module.exports = MyReporter;
Run the following command to use the configuration file created above, which has all the options discussed.
npx playwright test --config=playwright.custom.config.js 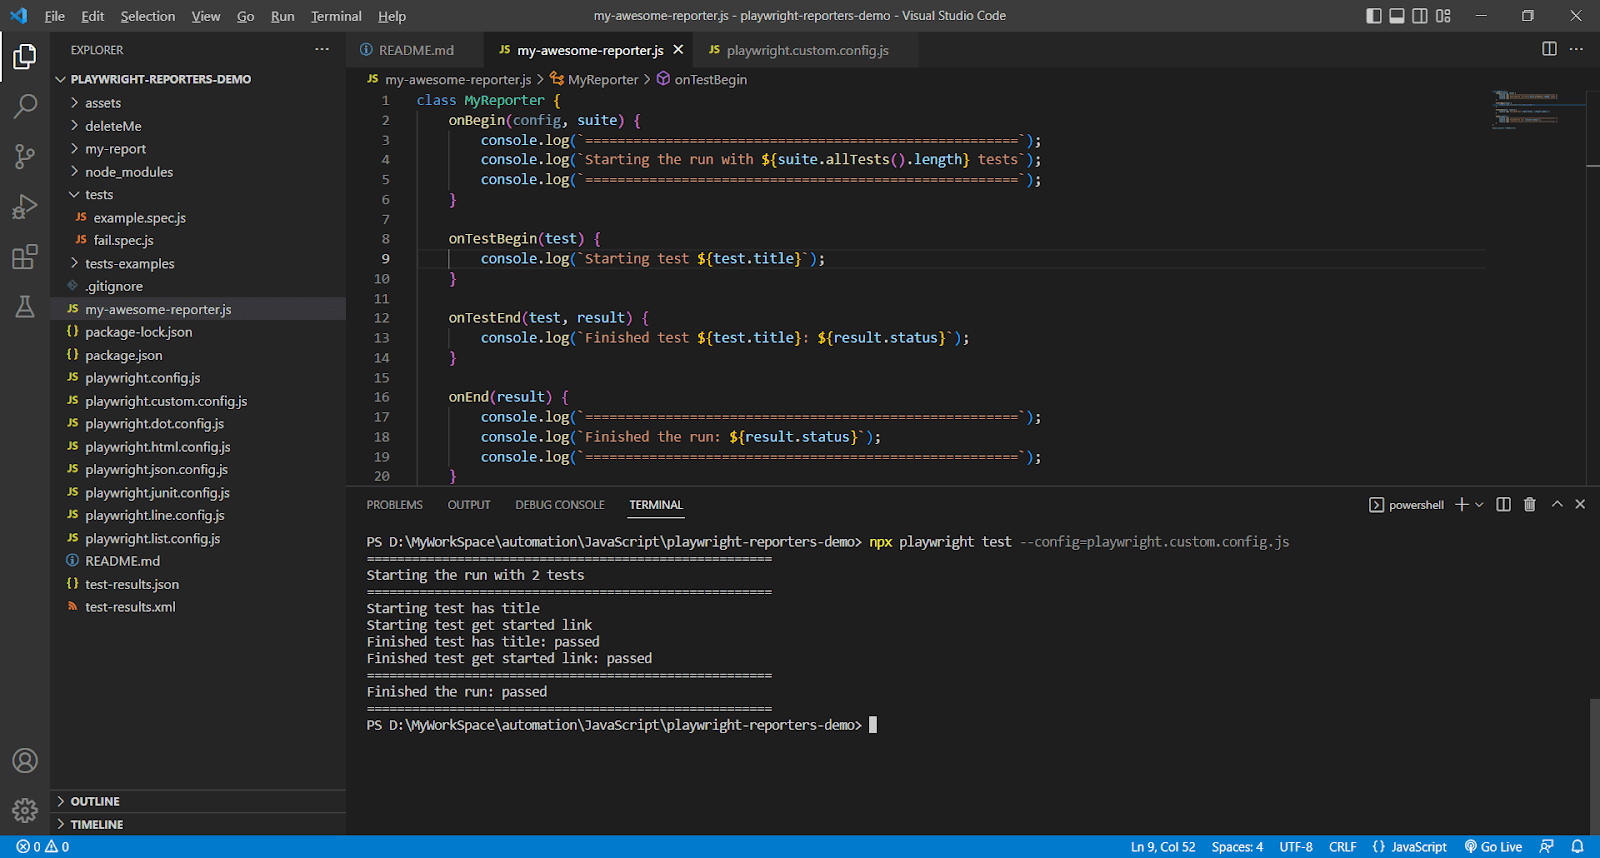
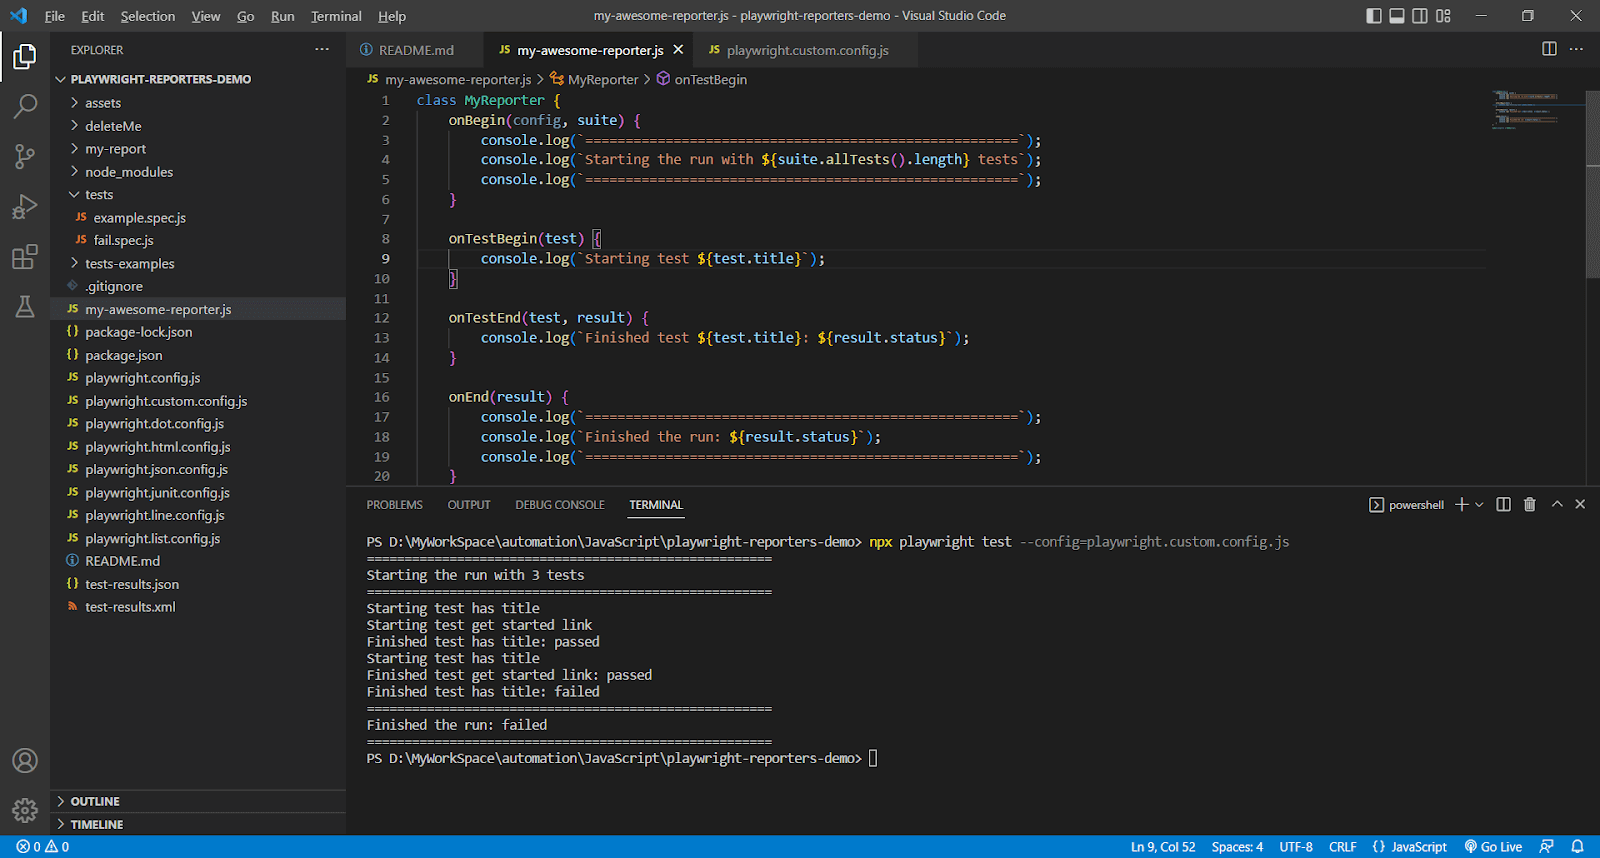
When one of the test fails:
Third-party Reporters
Playwright is a growing community, and support of 3rd-party integration and reporting tools is increasing daily. We will look into all of this Playwright reporting in detail.
Allure
It gives you great flexibility in terms of multi-language support. It provides the report in HTML with a clear graphical view and all kinds of test information. Let’s set up the Allure reporting in the framework.
Allure for Playwright
You need to install the Allure dependency in the project to generate the report.
npm install allure-playwright --save-devAllure Command Line Utility
To open the Allure report in the web browser, you need to install the allure command line utility dependency in the project.
npm install allure-commandline --save-dev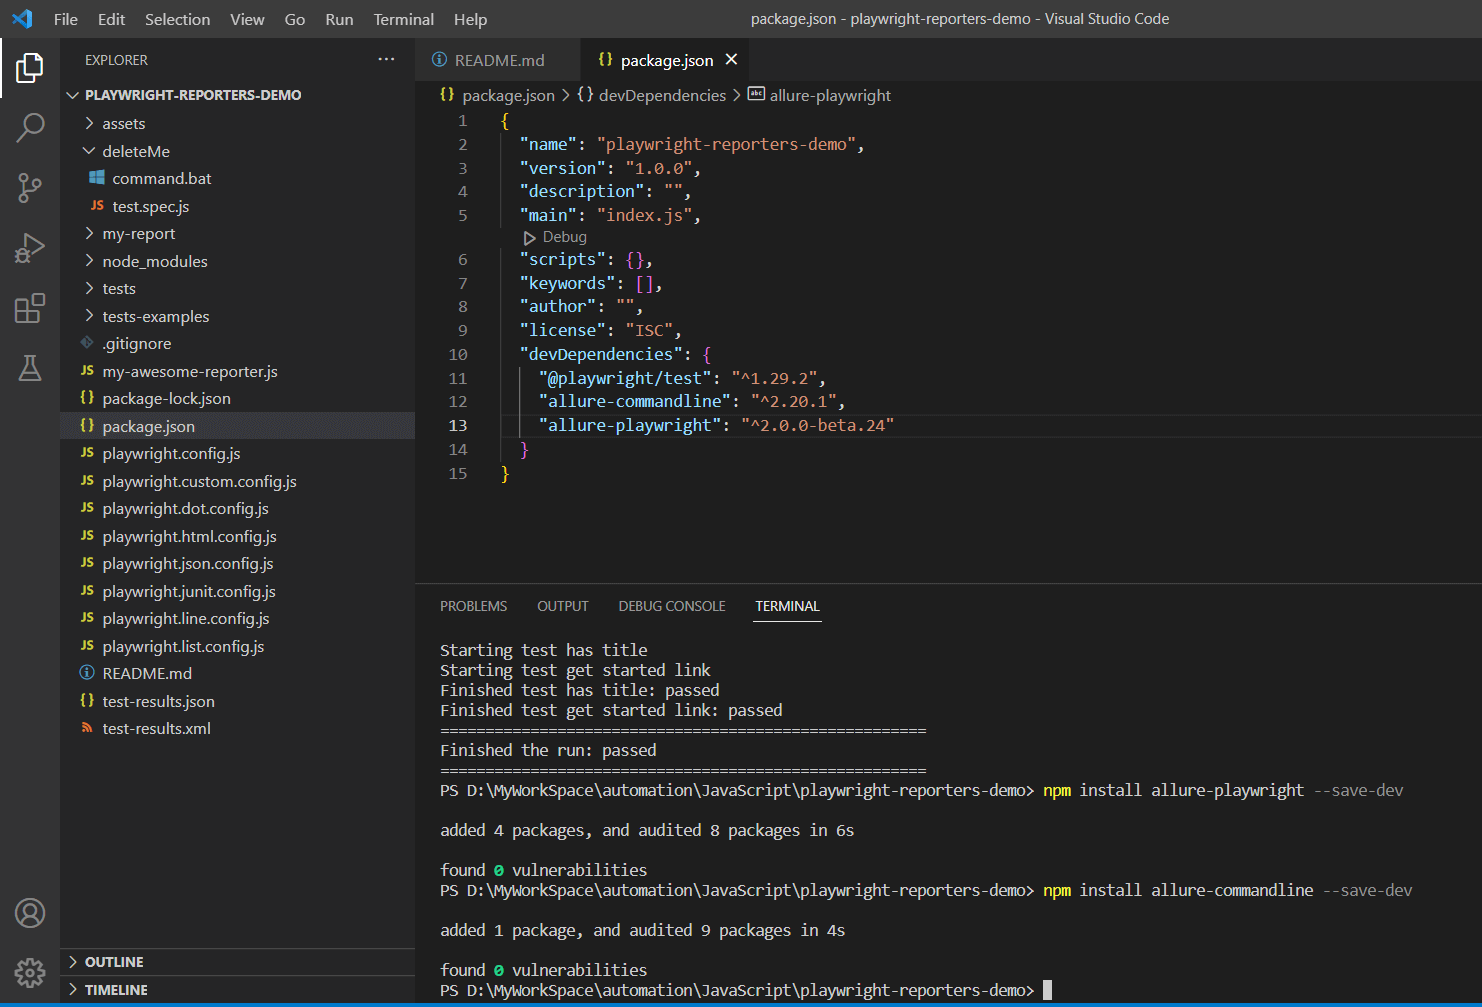
Filename: Package.json
{
"name": "playwright-reporters-demo",
"version": "1.0.0",
"description": "This is a test automation framework designed using Playwright to demonstrate different reporter",
"main": "index.js",
"scripts": {
"clean": "rimraf allure-results/ && rimraf allure-report/ && rimraf playwright-report/ && rimraf monocart-results/",
"test": "playwright test",
"allure-reporter": "npm run clean && playwright test --config=playwright.allure.config.js"
},
"keywords": [
"node",
"javascript",
"allure-report",
"rimraf",
"lambdatest",
"allure-reporting",
"playwright-tests",
"lambdatest-playwright"
],
"author": "Code with MMAK",
"license": "ISC",
"devDependencies": {
"@playwright/test": "^1.30.0",
"allure-commandline": "^2.20.1",
"allure-playwright": "^2.0.0-beta.24",
"monocart-reporter": "^1.1.4",
"playwright": "^1.30.0",
"rimraf": "^4.1.1"
}
}
Execution:
You can run the Playwright from the command line and configuration by specifying Allure reporter.
Command line:
npx playwright test --reporter=line,allure-playwrightPlaywright configuration:
// Filename: playwright.allure.config.js


const config = {
reporter: [
['line'],
['allure-playwright']],
};


module.exports = config;
Run the following command to use the configuration file created above, which has all the options discussed.
npx playwright test --config=playwright.allure.config.js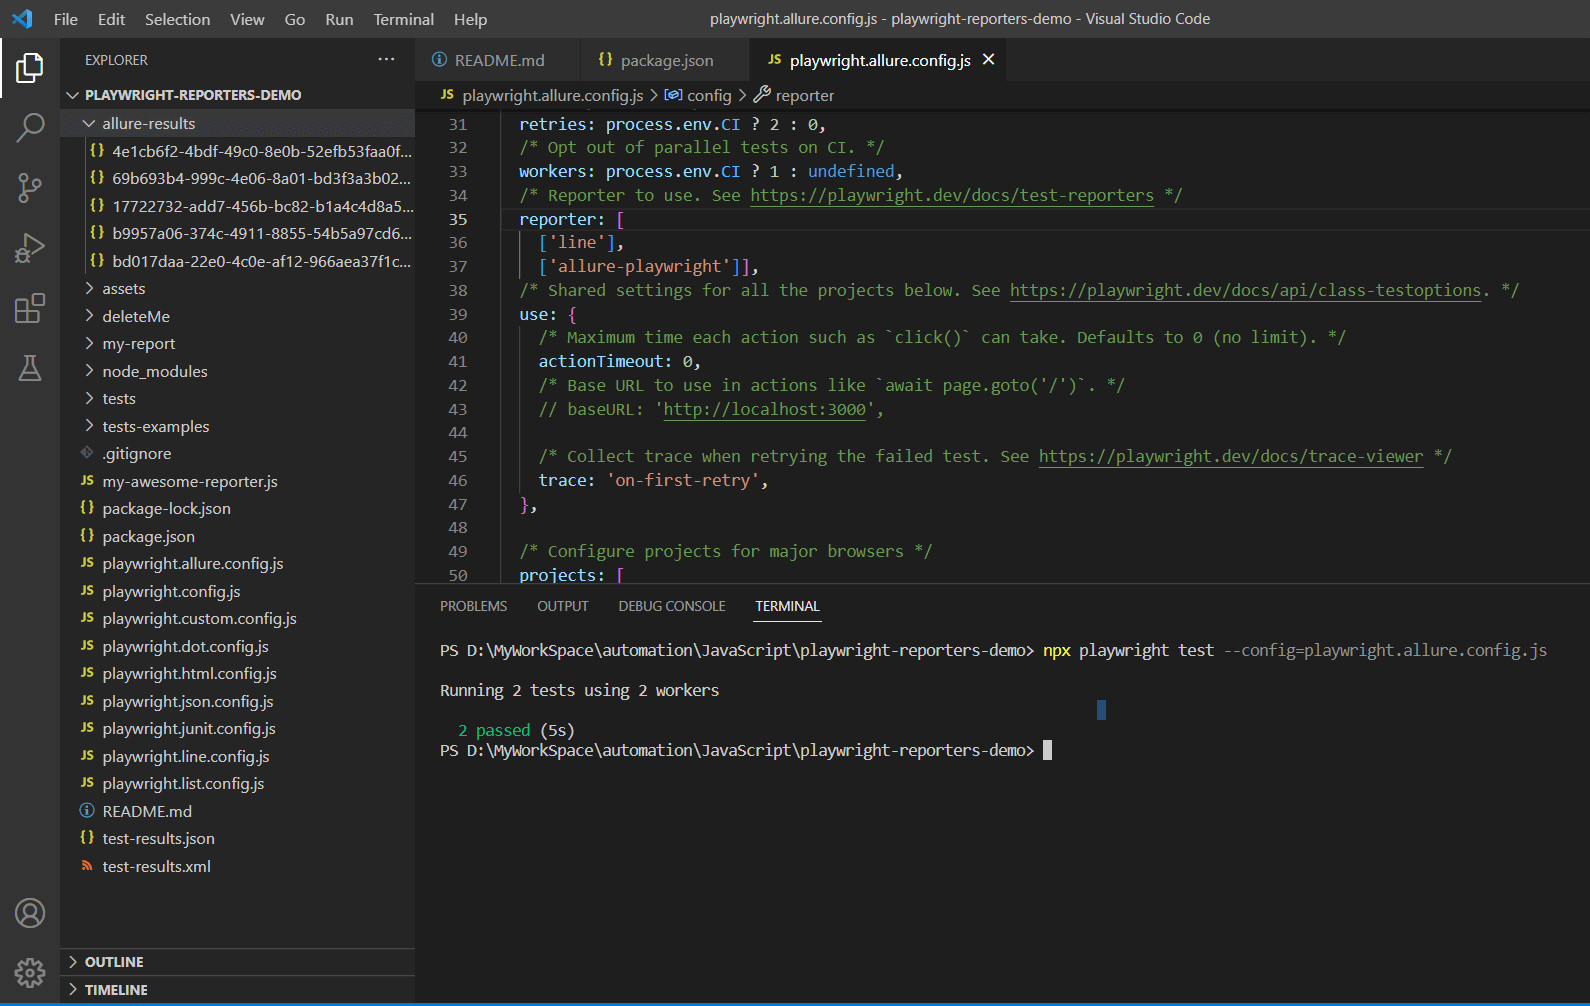
Once test execution is completed, you should see a folder with the name allure-results.
Generate Allure Report in HTML
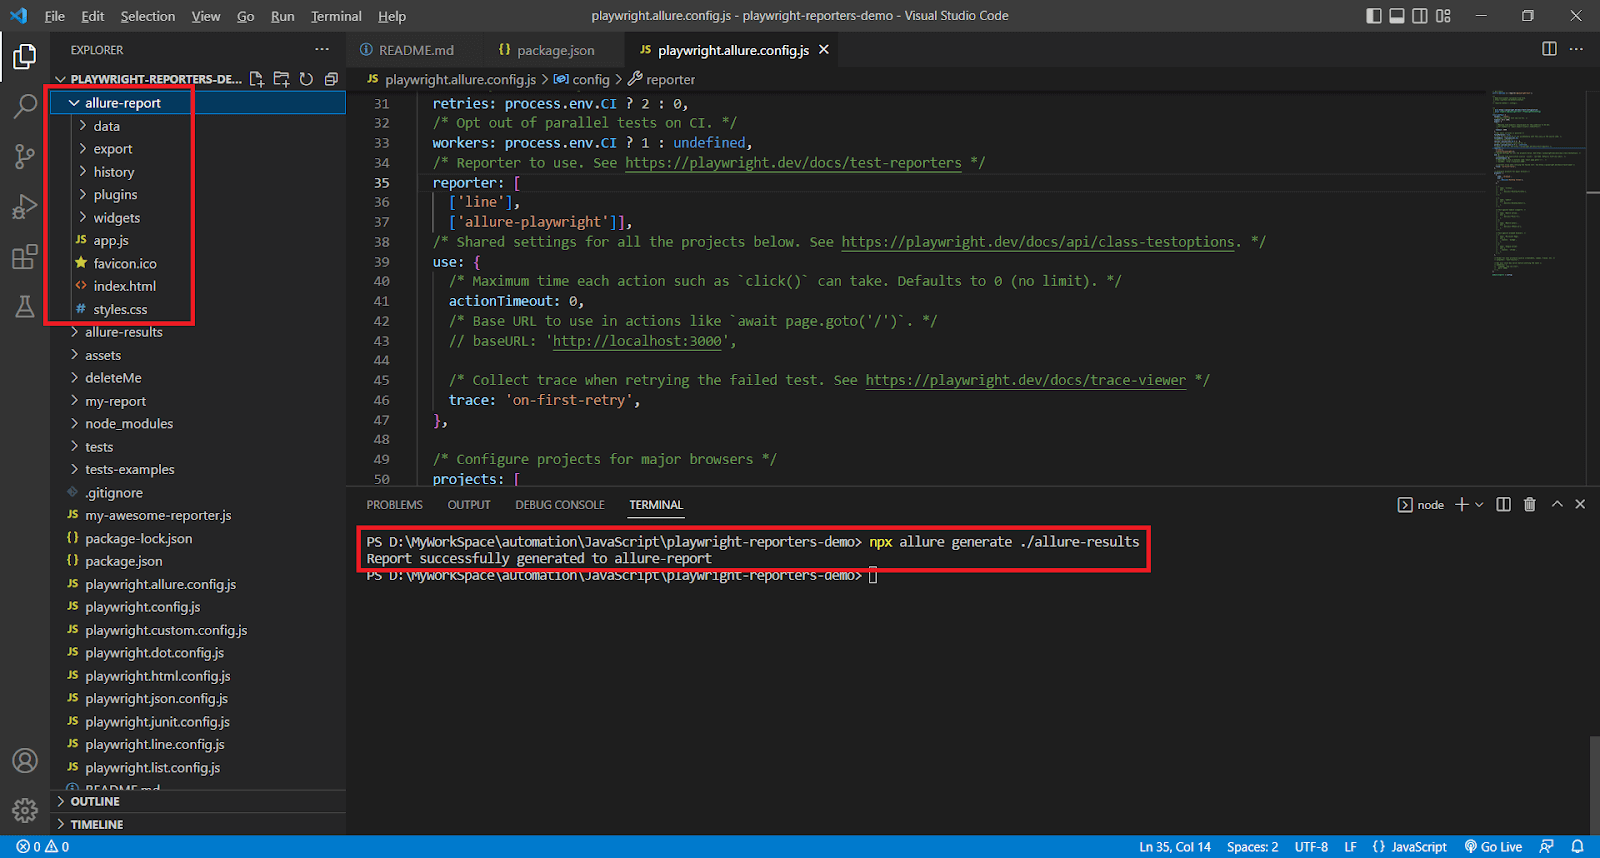
Now you need to generate the HTML report using the allure command line.
npx allure generate ./allure-results Once the command is executed, it will generate a folder with the name allure-report.
Open Allure Report Using Command line
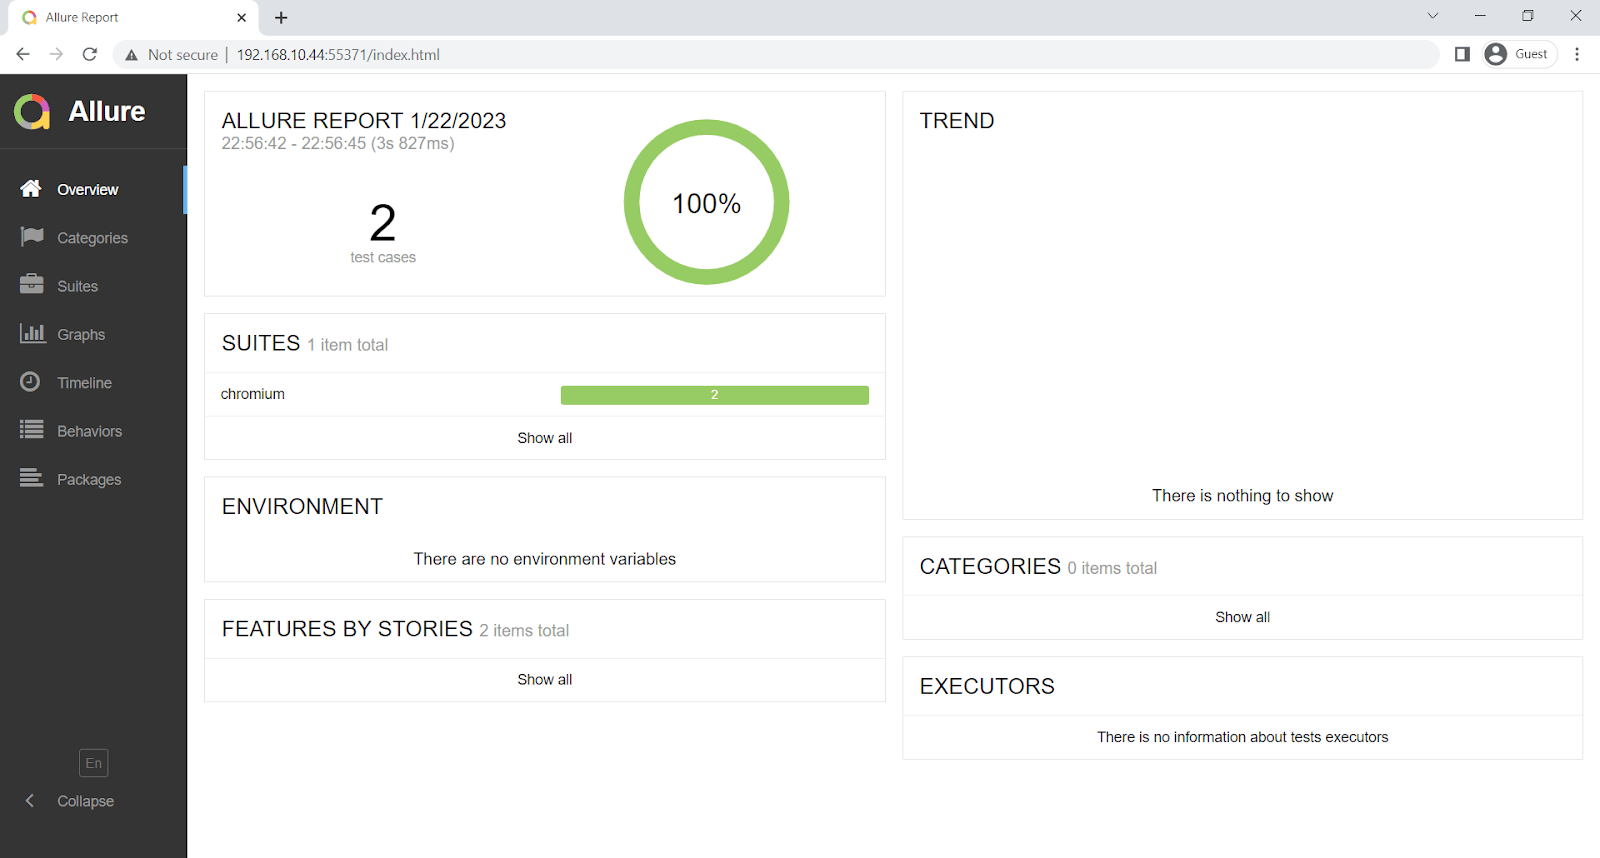
Allure provides an option to open the report from the destination folder by simple command:
npx allure open ./allure-reportThis will open your report in the default browser.

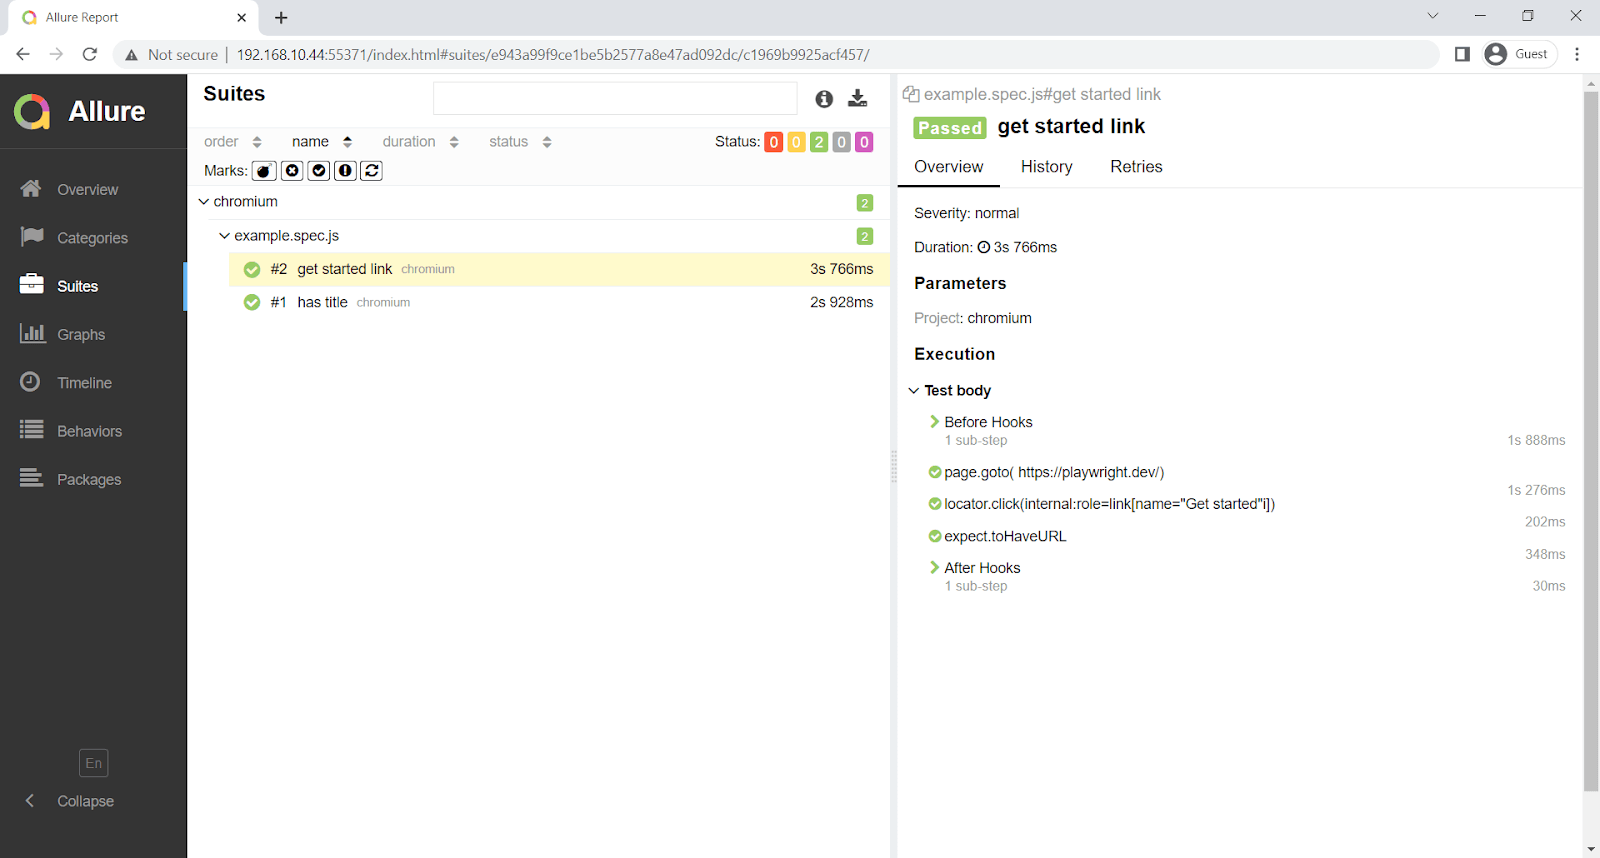
Detailed View:
Let’s use Selenium Grid to execute the test on TestMu AI.
TestMu AI is a digital experience testing platform that allows you to perform manual and automated testing of websites and mobile applications. It provides a scalable online browser farm to run Playwright test scripts across 50+ browsers and OS combinations at scale.
Furthermore, you can accelerate release cycles by multiple folds with parallel test execution.
You can also subscribe to the TestMu AI YouTube Channel and stay updated with the latest tutorial around Selenium testing, Cypress E2E testing, Appium, and more.
For this Playwright reporting tutorial, you will be importing lambdatest-setup, which you can find on the Git Repo, along with all the examples explained in this Playwright reporting tutorial.
Create a folder named tests-lambdatest and add a spec file named title.spec.js.
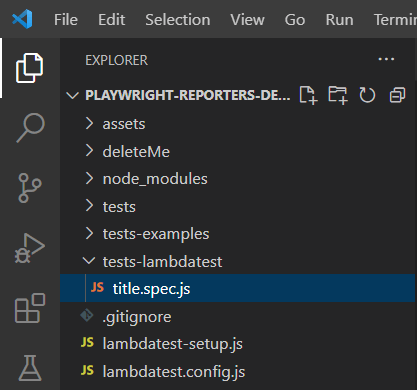
For this example test, you will be using TestMu AI eCommerce Playground to verify the title of pages by navigating to the different pages.
Implementation:
const { test } = require("../lambdatest-setup");
const { expect } = require("@playwright/test");


test('homepage has title', async ({ page }) => {
await page.goto('https://ecommerce-playground.lambdatest.io');
await expect(page).toHaveTitle(/Your Store/);
});


test('special offer has title', async ({ page }) => {
await page.goto('https://ecommerce-playground.lambdatest.io/index.php?route=product/special');
await expect(page).toHaveTitle(/Special Offers/);
});


test('register account has title', async ({ page }) => {
await page.goto('https://ecommerce-playground.lambdatest.io/index.php?route=account/register');
await expect(page).toHaveTitle(/Register Account/);
});

Code Walkthrough:
Line 1: Import test, which is called from lambdatest-setup.js file, so that execution can also be done on TestMu AI.
Line 2: Import expect, which is called from @playwright/test.
Line 4: Test is a block where you will write your test. You can have multiple tests in a spec
Line 5: Navigating to the test URL, i.e., Home page.
Line 6: Expecting the page to have a title.
Line 10: Navigating to the test URL, i.e., the Special Offers page.
Line 11: Expecting the page to have a title.
Line 15: Navigating to the test URL, i.e., Register Account page.
Line 16: Expecting the page to have a title.
Execution:
Add a test script in package.json, which can be used to run the tests on TestMu AI.
"lambdatest": "npm run clean && npx playwright test --config=./lambdatest.config.js --reporter=line,allure-playwright",Your package.json should look like this:
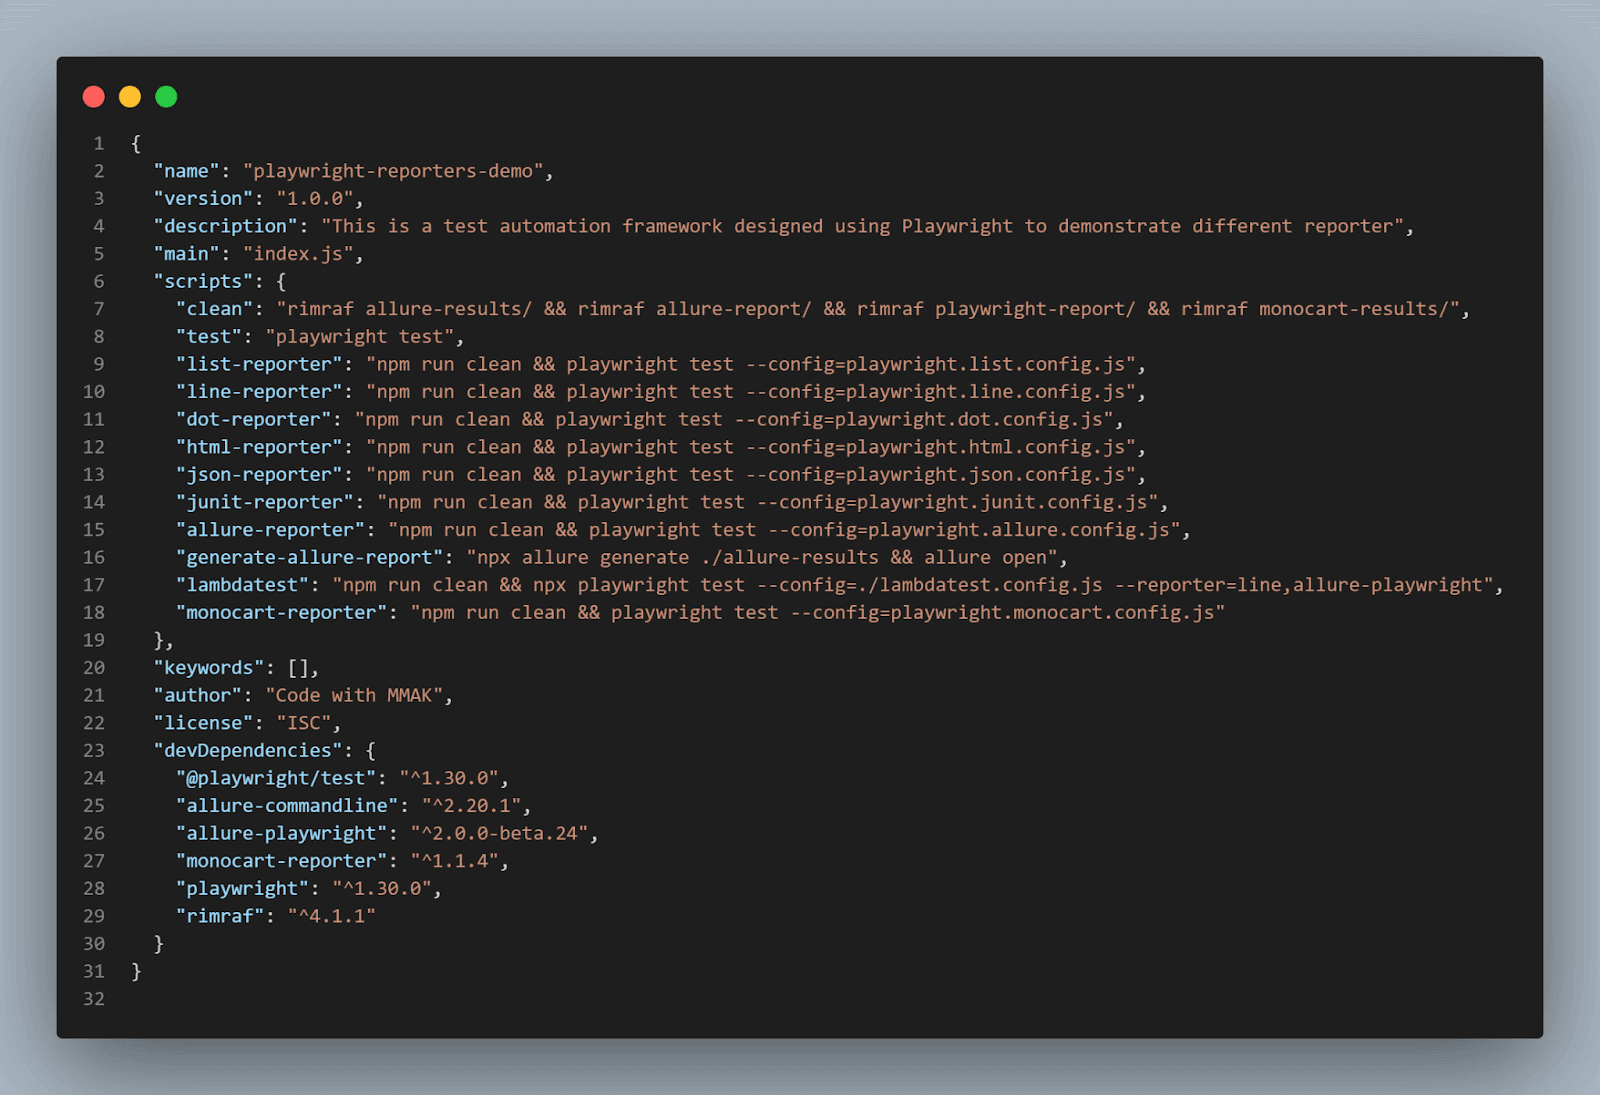
Now you can make use of the script name lambdatest and run your test through Terminal.
npm run lambdatestHere is the execution snapshot, which indicates that 12 tests passed. This is because we have specified the 4 browsers in the config file, and there are 3 tests, so in total it's 12 tests executed on Selenium Grid.
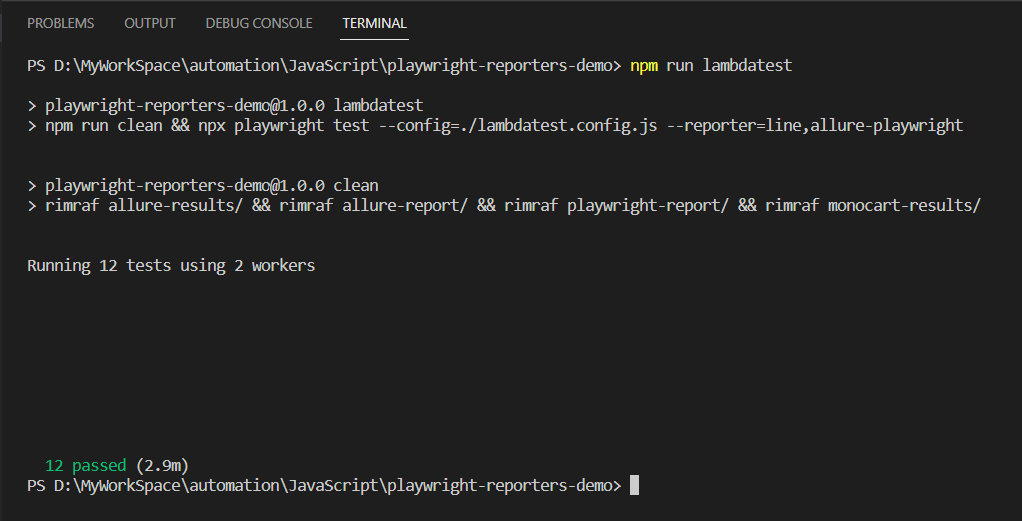
You will see that test execution starts and the status of each test will be reported in the terminal, and an allure-results folder is created.
Now generate the HTML report.
npm run generate-allure-reportIt will generate the HTML under the allure-report directory.
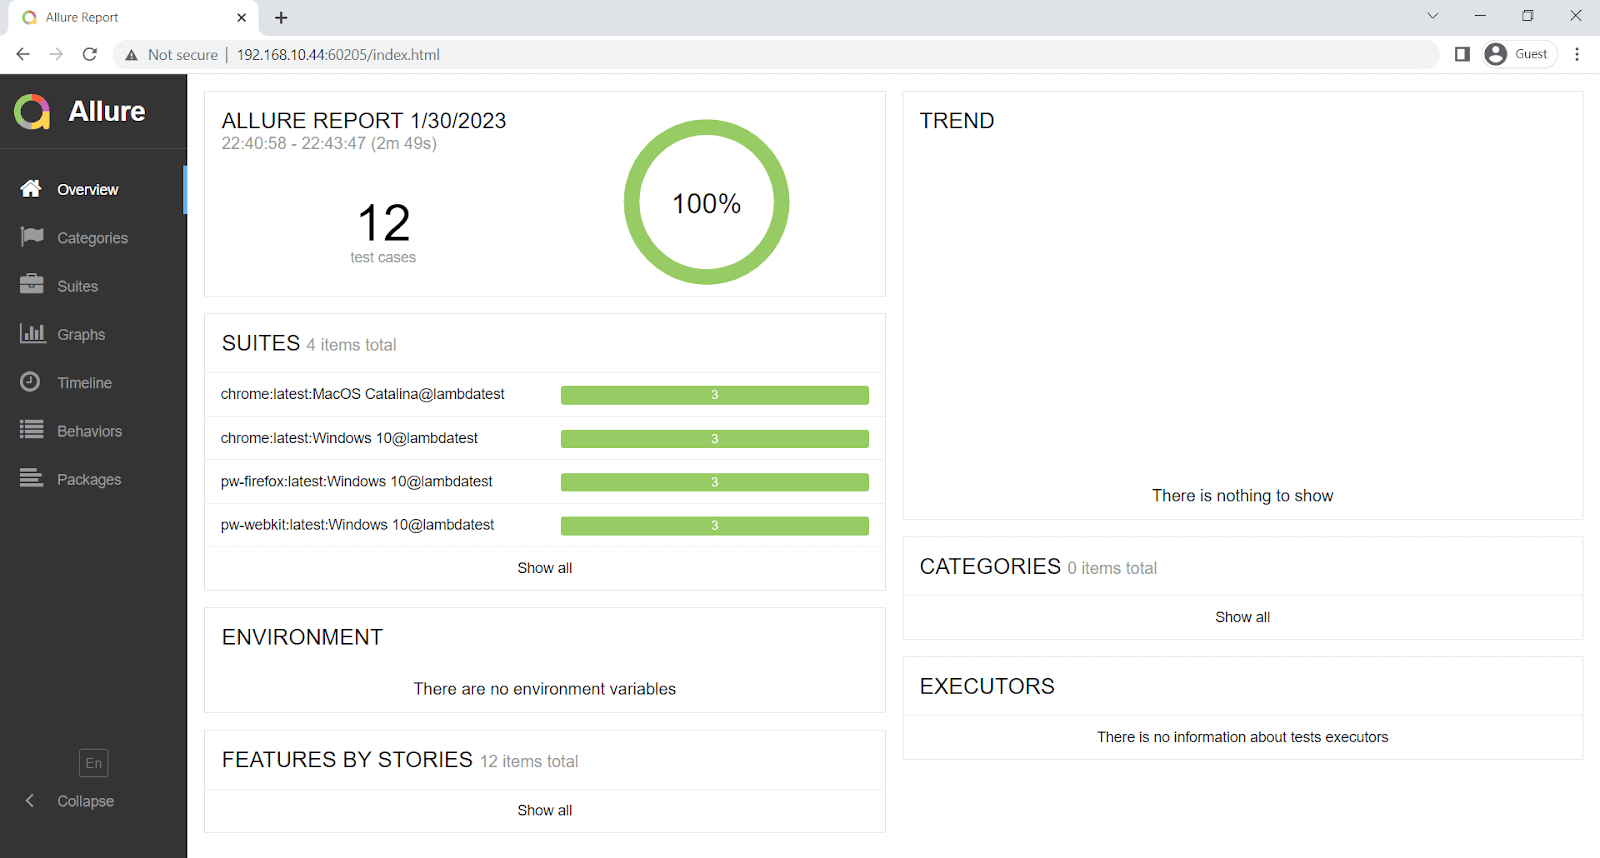
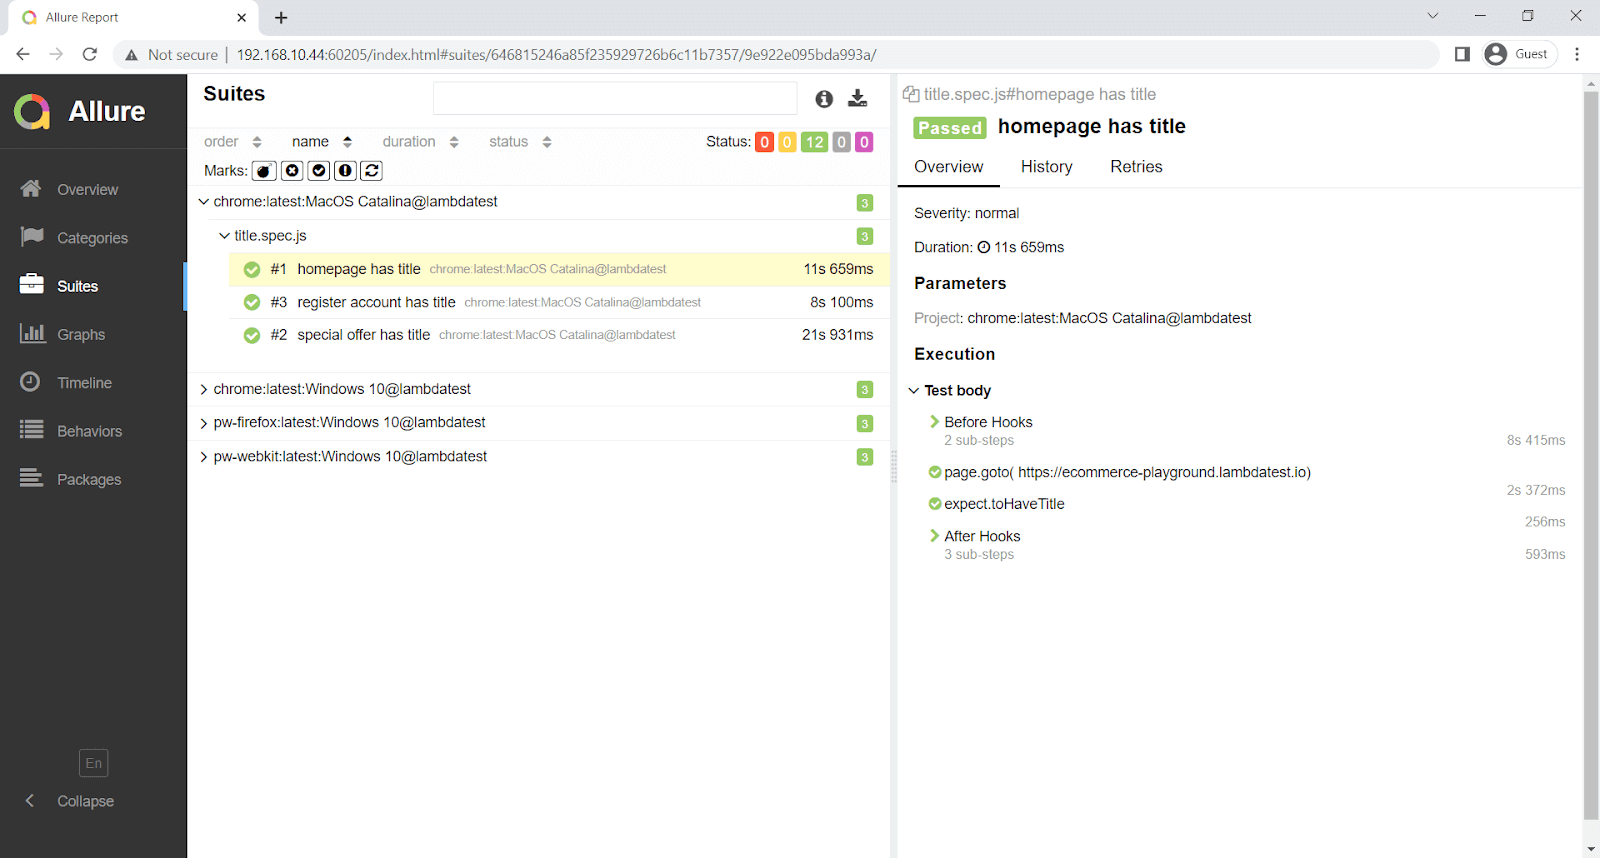
Execution:
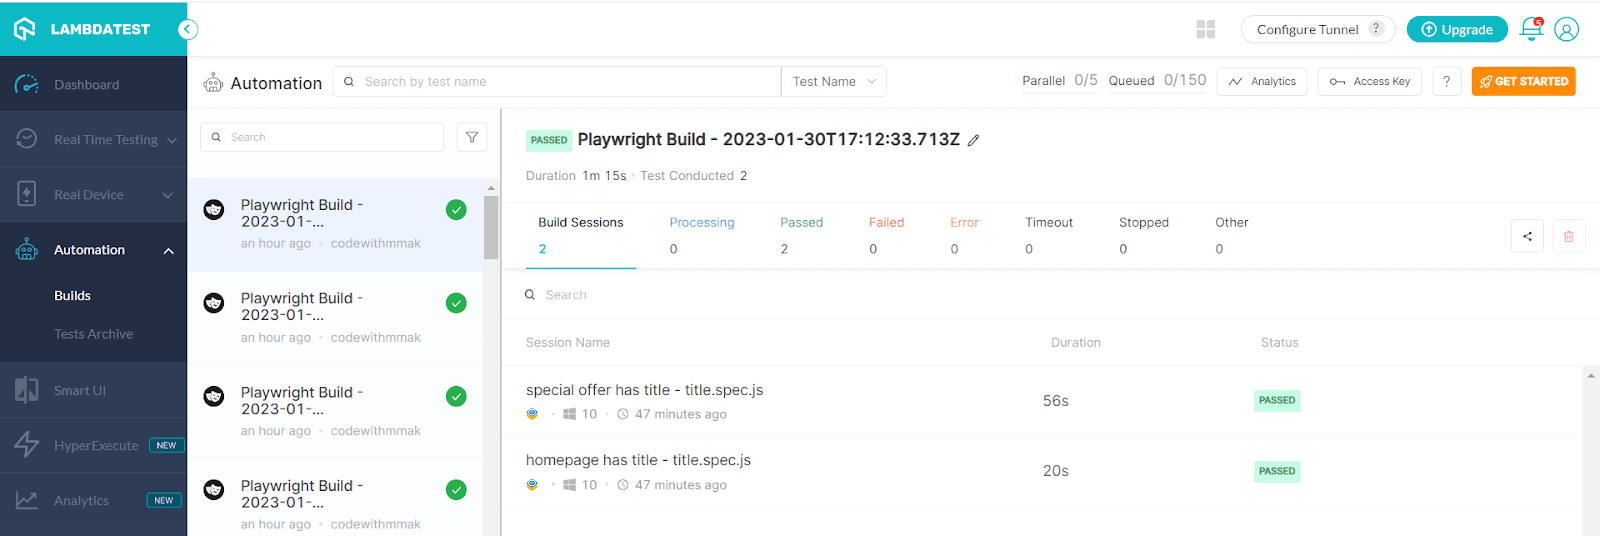
Show below is the execution on TestMu AI Cloud.
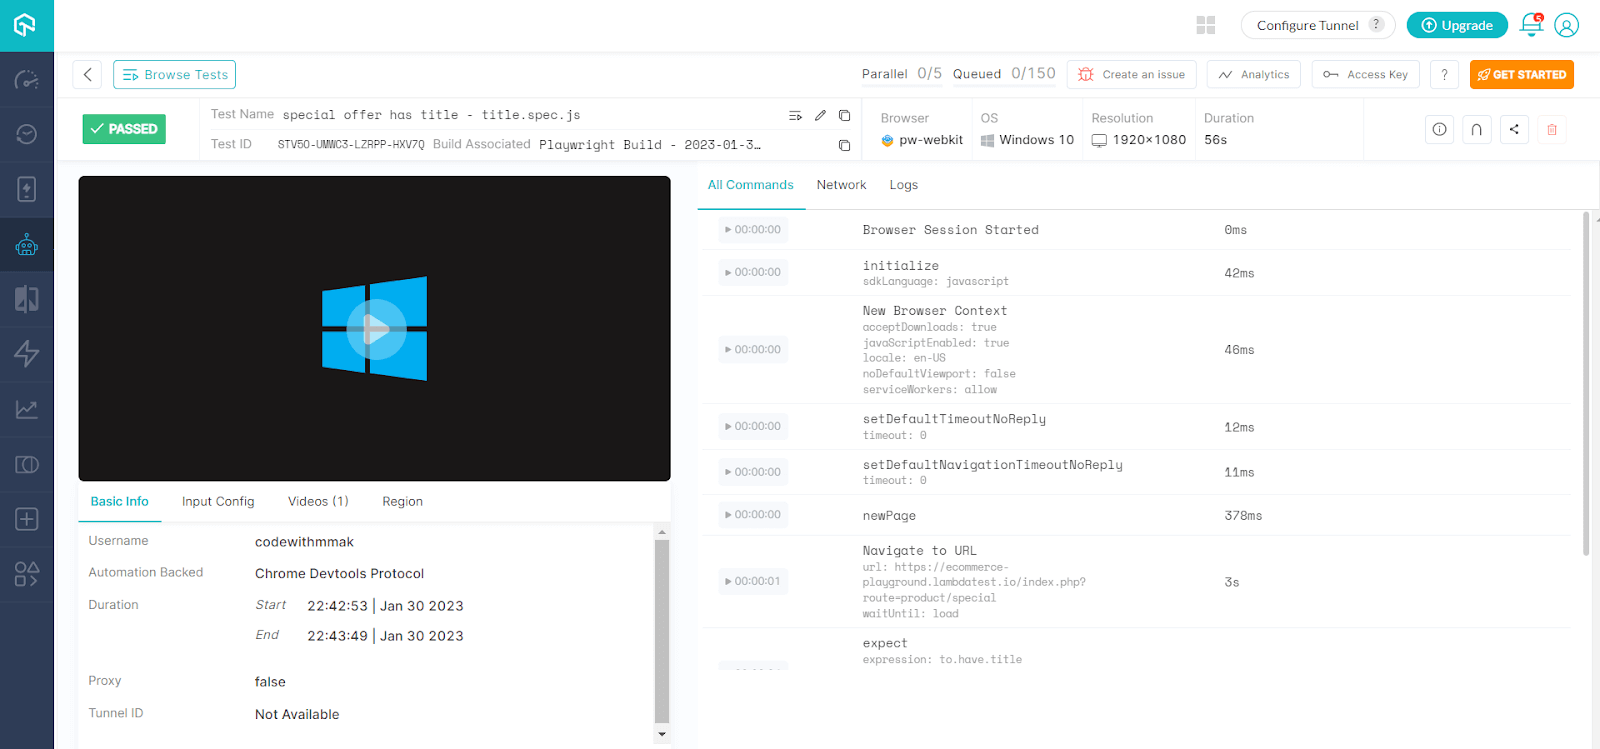
Expanded view of test result:
Monocart
It generates the HTML report and shows suites/cases/steps with tree style, markdown annotations, and custom columns.
You need to install the Monocart dependency in the project to generate the report.
npm install monocart-reporter --save-devPlaywright Config:
// Filename: playwright.monocart.config.js


const config = {
reporter: [['monocart-reporter', {
name: 'My Test Report',
outputFile: './monocart-results/report.html'
}]],
};


module.exports = config;
Run the following command to use the configuration file created above, which has all the options discussed.
npx playwright test --config=playwright.monocart.config.js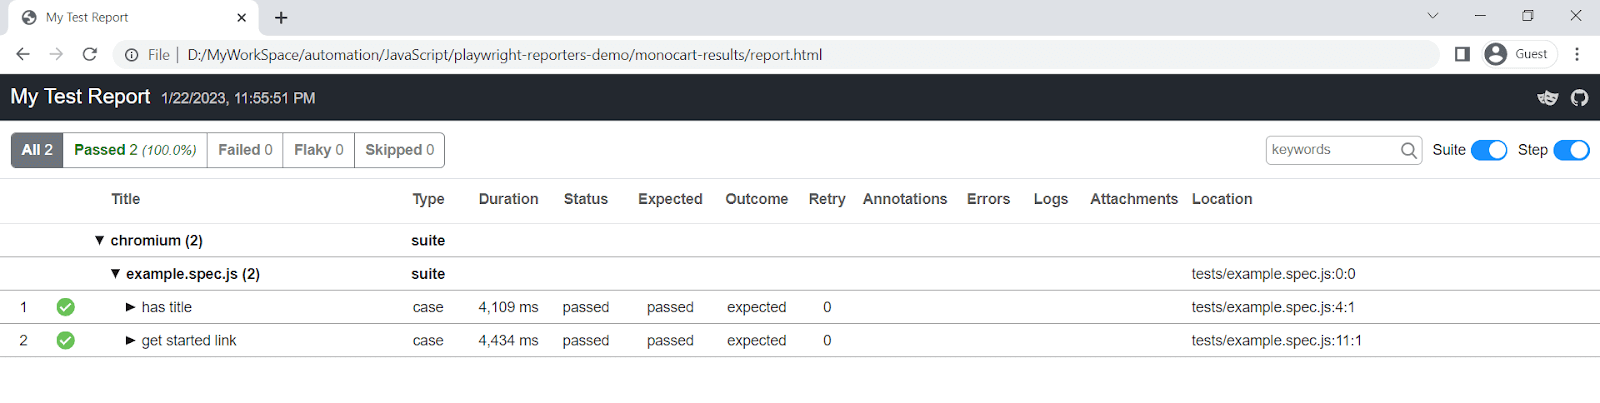
If you want to demonstrate your expertise as a Playwright automation tester, TestMu AI offers the Playwright 101 certification program for developers who wish to exhibit their Playwright automation testing skills. This certification is designed to validate the proficiency of developers in utilizing Playwright for end-to-end testing of modern web applications.

Conclusion
Pick two reporters, not one. Run a terminal reporter for the feedback you read while the suite is running, and HTML for the artifact you open when something fails. That pairing costs one line of config and covers both moments you actually look at a report.
Add Blob only when you shard, and JUnit or JSON only when a downstream system consumes the output. Reporters you never open are just slower runs.
For the reports your existing suite already produces, running it on TestMu AI attaches video, console logs, and network logs to every execution across 3,000+ browser and OS combinations. Setup is covered in the Playwright testing documentation.
One gap stays open regardless of which reporter you choose: the HTML report lives on the machine that produced it. Sharing a failure still means zipping a folder or granting CI access. Kane CLI takes a different route for the flows it drives, uploading each run to Test Manager and printing a ShareLink, a public URL that stays live for seven days, so a failing run can be dropped straight into a pull request or a Slack thread without an account.

Note: Every Kane CLI run prints a ShareLink that stays live for seven days, so a failing flow can go straight into a pull request without anyone needing an account. Read the Kane CLI docs
Author


Reviewer

Srinivasan Sekar
Reviewer
Srinivasan Sekar is Director of Engineering at TestMu AI (formerly LambdaTest), where he leads engineering and open-source initiatives behind the Selenium and Appium automation grid and owns TestMu AI's MCP Server. A committer to Appium and a contributor to Selenium, WebdriverIO, Taiko, and AppiumTestDistribution, he brings over 15 years of experience in quality engineering and open-source technologies. He is the author of the Apress book 'The MCP Standard: A Developer's Guide to Building Universal AI Tools with the Model Context Protocol,' a Certified Kubernetes and Cloud Native Associate, and an international conference speaker. Before TestMu AI he spent over eight years at Thoughtworks as a Principal Consultant and Quality Architect. Srinivasan holds a B.Tech in Information Technology from Anna University.
Playwright Reporting FAQs
Did you find this page helpful?
More Related Learning Hubs
TestMu AI forEnterprise
Get access to solutions built on Enterprise
grade security, privacy, & compliance
- Advanced access controls
- Advanced data retention rules
- Advanced Local Testing
- Premium Support options
- Early access to beta features
- Private Slack Channel
- Unlimited Manual Accessibility DevTools Tests