

Power Your Software Testing with AI Agents and Cloud
The Native AI-Agentic Cloud Platform to Supercharge Quality Engineering. Test Intelligently and Ship Faster.


- TestMu AI (Formerly LambdaTest)
- /
- Blog
- /
- How to Use Playwright Inspector to Debug and Record Tests
How to Use Playwright Inspector to Debug and Record Tests
Use Playwright Inspector to debug tests: open it with --debug, PWDEBUG=1, or page.pause(), step through actions, edit locators, and record tests with codegen.
Last Updated on:
Playwright Inspector is the debugger window that ships with Playwright. It pauses a headed browser on each action of your test so you can step forward, try locators against the live page, and read the log that explains why an action waited or failed. The same window records new tests when you run codegen.
The tests in this guide were re-run on Playwright 1.63 for this update against the TestMu AI eCommerce Playground. All 4 pass locally and on the TestMu AI cloud grid, and the one flow codegen recorded wrong is shown with the 30-second timeout log that exposed it.
Overview
To debug a test with Playwright Inspector, run npx playwright test --debug, set PWDEBUG=1, or add await page.pause() where execution should stop. The Inspector then lets you step through actions, edit locators live, and read actionability logs in Chromium, Firefox, and WebKit. To record a new test, run npx playwright codegen with a URL.
- Record and Replay: Playwright Inspector records clicks, typing, and navigation in codegen and generates a locator for each action, so a recorded flow can be replayed as a test and then refined.
- Locator Generation: Playwright Inspector suggests locators that prioritize role, text, and test id, which helps reduce manual coding effort during test creation.
- Breakpoints: Setting breakpoints allows pausing Playwright test execution at specific points to inspect element states, page content, or variables with full visibility.
- Cross-Browser Support: Playwright Inspector supports Chromium, Firefox, and WebKit, enabling developers to test and debug across multiple browsers to ensure consistent behavior.
- Actionability Logs: The Playwright Inspector call log lists every check behind an action, such as whether the element was visible, enabled, and stable, so developers can see why an action waited or failed.
- Debug Mode: Debug mode runs Playwright tests in a headed browser with the default timeout set to 0 and opens the Playwright Inspector for each test, allowing step-by-step execution and monitoring of logs.
- Stepping Over Tests: The Playwright Inspector Step over button (F10) runs one action at a time, and Resume (F8) runs to the next page.pause() or to the end of the test.
- Pausing Execution: Using the await page.pause() statement halts test execution at desired points, enabling inspection of page elements and verification of locators without running the full sequence.
- Live Locator Editing: Live locator editing allows testers to modify existing locators or experiment with new ones while paused, improving the reliability of element identification.
- Mobile Viewport Debugging: Mobile viewport debugging configures specific devices like iPhone or Android viewports in the Playwright configuration to inspect responsive layouts and debug mobile environments.
- Playwright codegen does not record mouse scroll events, but hover() and click() scroll their target into view before acting, so a product card lower on the page needs no manual mouse.wheel() call.
- Playwright Inspector needs a headed browser, so it debugs tests on your own machine. For failures in CI, record a trace for Trace Viewer, or run the suite on TestMu AI, which records video, console, and network logs for every session.
What Is Playwright Inspector?
Playwright's debugging documentation describes Playwright Inspector as a GUI tool to help you debug your Playwright tests, one that lets you step through tests, live edit locators, pick locators, and see actionability logs.
In practice it opens next to a headed browser and shows your test source with the current line highlighted, controls to resume, pause, and step over actions, a Pick locator field for testing locators against the live page, and a log of every actionability check Playwright ran. The same window appears when you record tests with codegen.
It is part of the Playwright framework itself, so there is no separate download or browser extension. The TypeScript, JavaScript, Python, Java, and .NET bindings all open the same Inspector; the examples here use the TypeScript test runner.
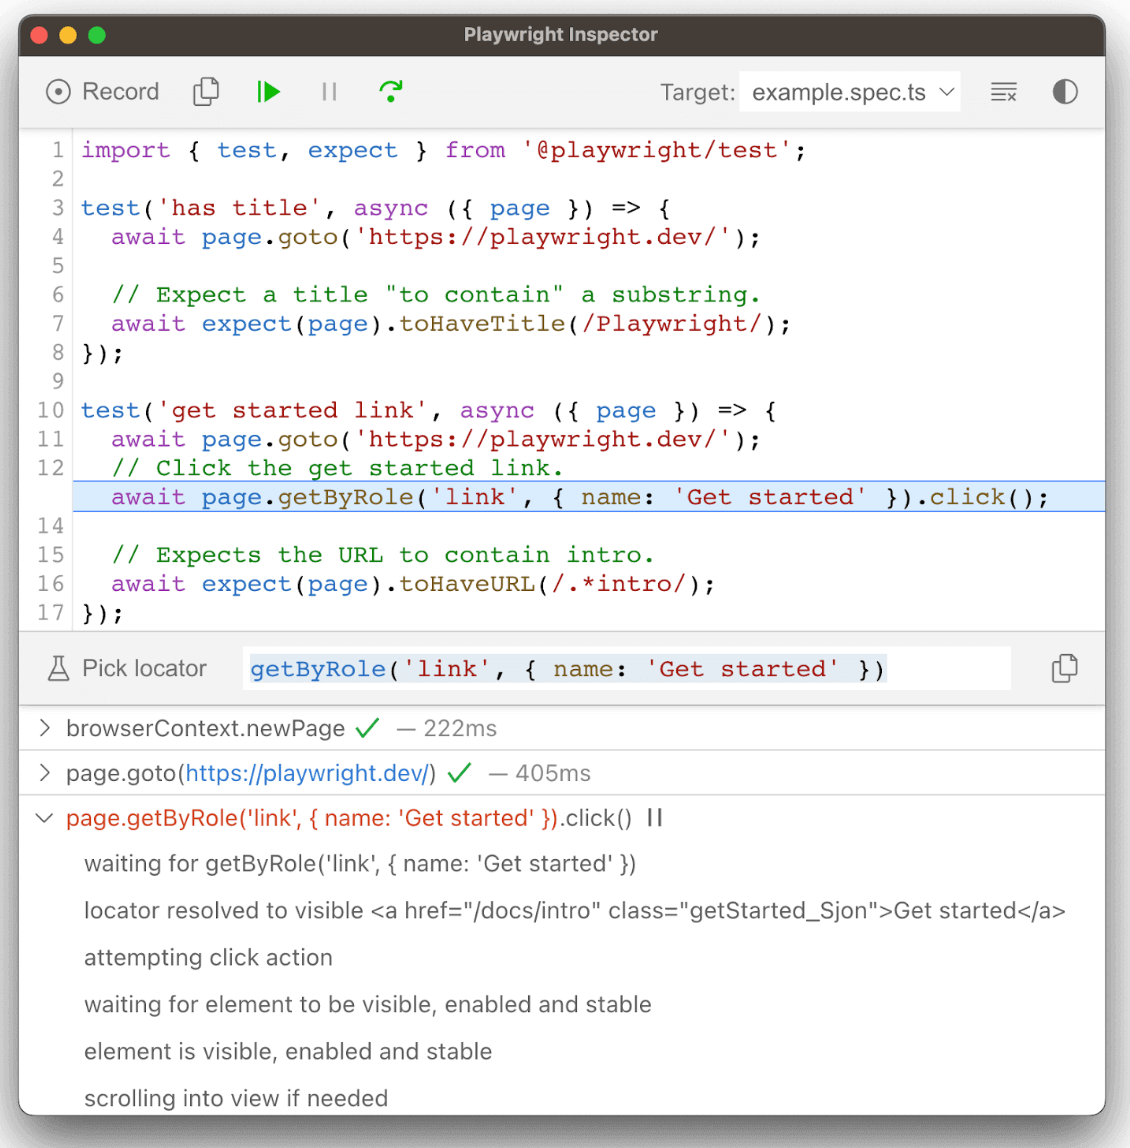
- Source pane - the test file, with the line Playwright is paused on highlighted.
- Pick locator field - the locator for the element you pick, which you can edit to see which elements it matches.
- Call log - each Playwright action with its duration and the checks behind it, such as waiting for the locator, "element is visible, enabled and stable", and "scrolling into view if needed".
How to Open Playwright Inspector
The debugging commands pause a test that already exists; codegen starts a new recording.
| Method | Command | Use it when |
|---|---|---|
| Debug all tests | npx playwright test --debug | You want to step through every test from its first action. Browsers launch headed and the default timeout is set to 0. |
| Debug one test | npx playwright test example.spec.ts:10 --debug | You only need the test defined on line 10 of that file. |
| PWDEBUG variable | PWDEBUG=1 npx playwright test | Your runner cannot take an extra flag. It also works with pytest (PWDEBUG=1 pytest -s), Maven, and dotnet test. |
| page.pause() | await page.pause(); in the test | You know where the problem is and want to stop there in a headed run. |
| Codegen | npx playwright codegen <url> | You are recording a new test and want the code to appear as you click. |
| Coding agents | npx playwright test --debug=cli | An AI agent needs to step through the test from a terminal instead of a window (Playwright 1.59 and later). |
To step through every test from its first action:
npx playwright test --debugOn Windows, the PWDEBUG=1 prefix only works in Bash. Set the variable first in Command Prompt or PowerShell:
# Command Prompt
set PWDEBUG=1
npx playwright test

# PowerShell
$env:PWDEBUG=1
npx playwright test
Because debug mode turns the default timeout off, a paused test waits as long as you need. How to handle Playwright timeouts covers the limits that apply in a normal run.
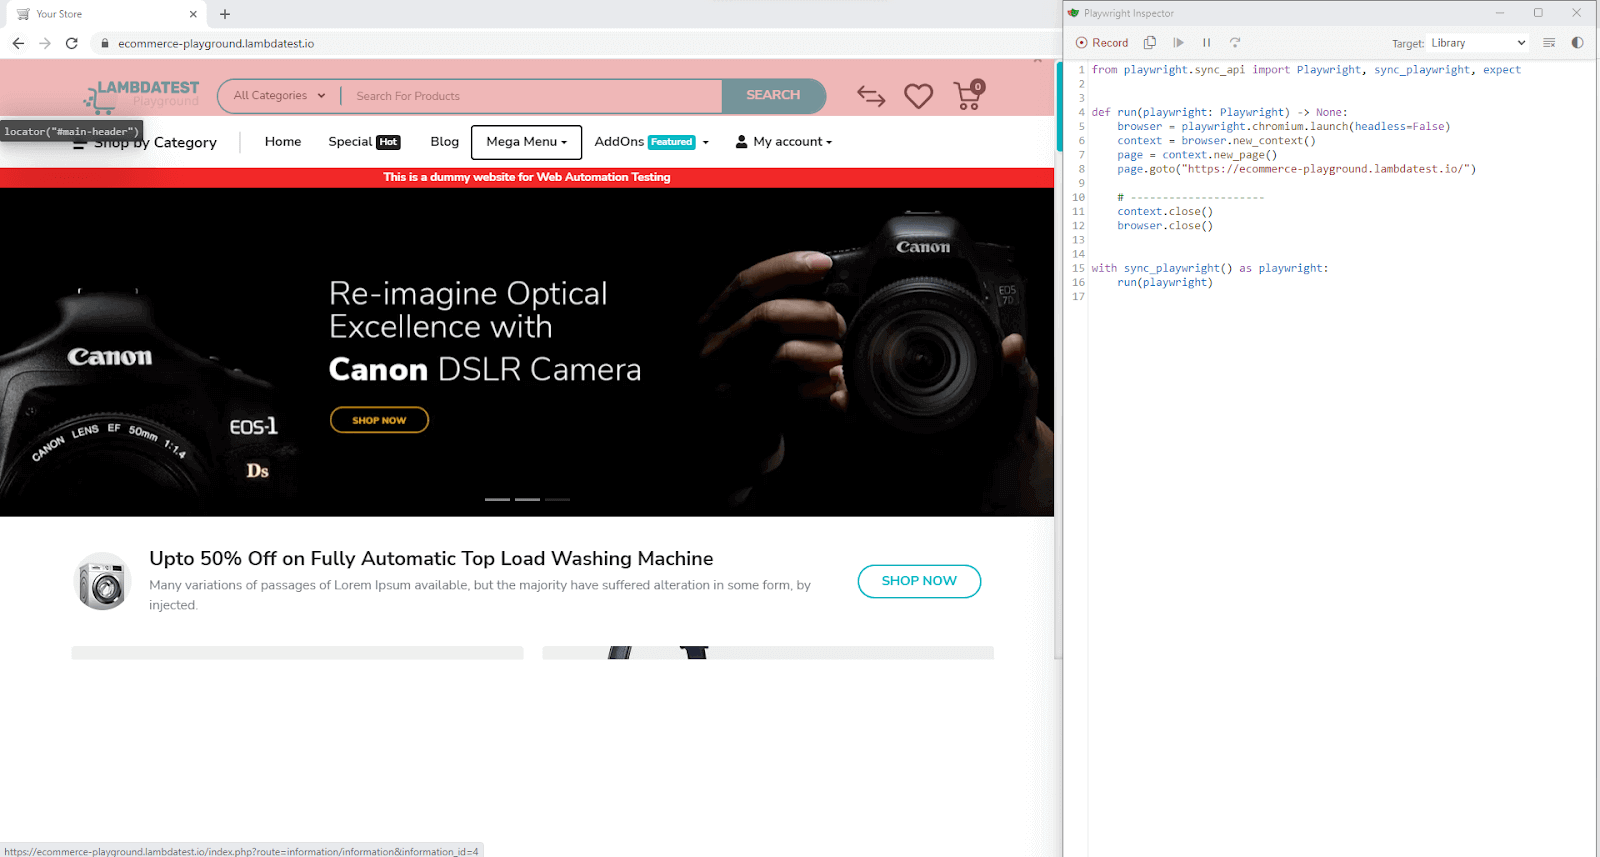
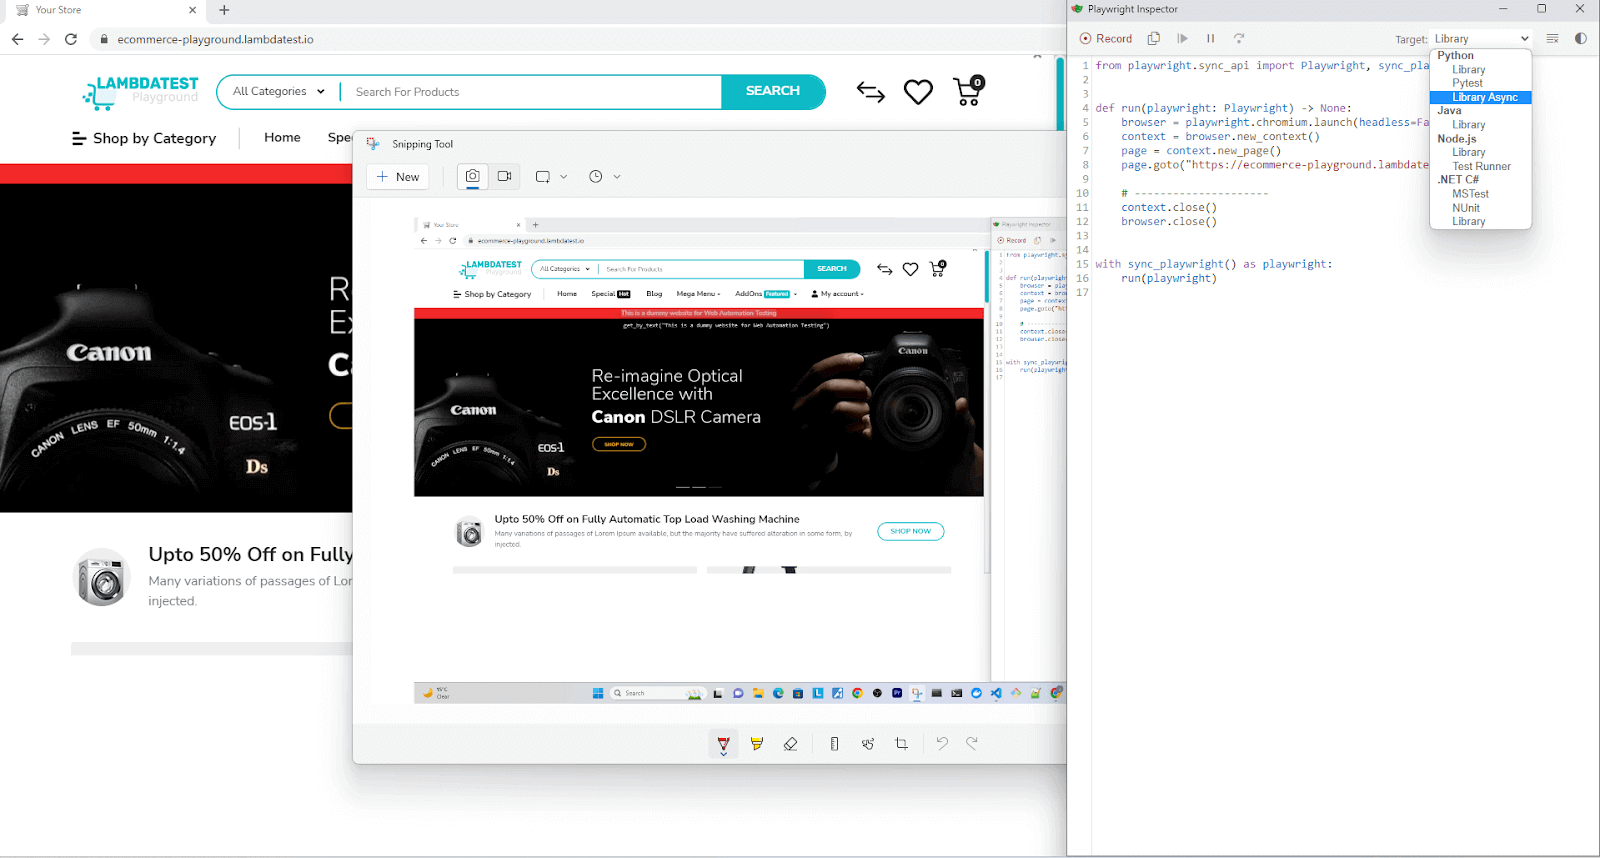
Running codegen with a URL opens the page in Chromium with the Inspector beside it, already holding the code for the first navigation. The Target dropdown decides which language and API the code is written in; the screenshot below shows the Python library target.
For codegen options such as device emulation and saved login state, see Getting Started With Playwright Recorder.
Playwright Inspector Toolbar and Features
The Inspector's source code defines the toolbar buttons below and the F8 and F10 shortcuts for Resume and Step over.
The Playwright docs describe the toolbar without listing those shortcuts, and the buttons match the Playwright 1.63 codegen session shown in the screenshot further down.
| Control | What it does |
|---|---|
| Record | Starts or stops turning your clicks and typing into code. Stop it before you pick locators, or every click becomes a step. |
| Pick locator | Hover the page to see the locator Playwright would use, then click to put it in the locator field, where you can edit and re-test it. |
| Assert visibility, text, value | Click an element to add a toBeVisible(), text, or value assertion to the recording. |
| Assert snapshot | Adds an aria snapshot assertion for the element you pick. |
| Copy | Copies the generated code. |
| Resume / Pause (F8) | Runs to the next page.pause() or the end of the test, or pauses a running test. |
| Step over (F10) | Runs the highlighted action and pauses again. |
| Target | Switches the generated code between Node.js, Python, Java, and .NET, and between the test runner and library APIs. |
| Settings: Generate assertions | Adds toBeVisible() assertions automatically while you record. |
The Playwright release notes list the Assert snapshot button under version 1.50 and automatic toBeVisible() assertions in codegen under version 1.55.
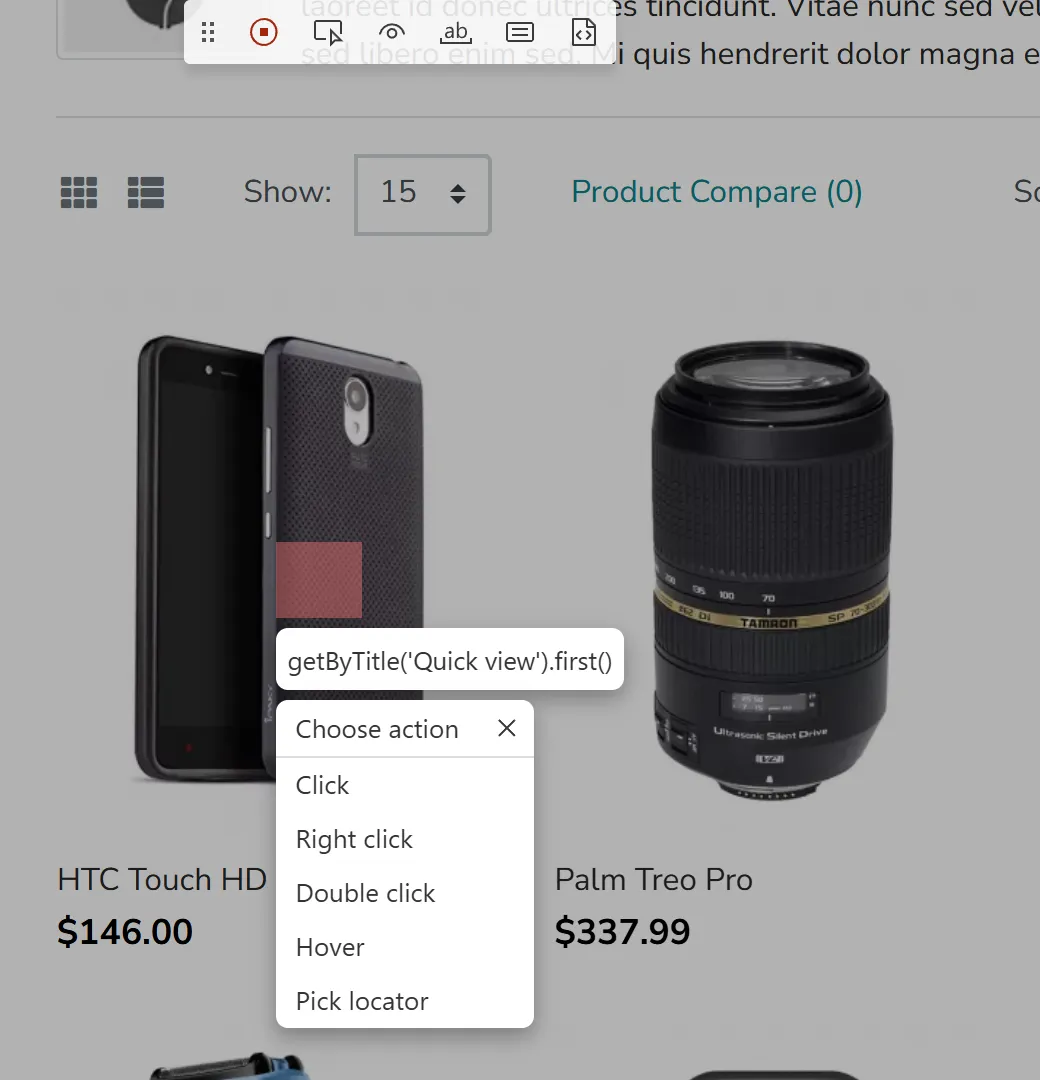
While recording, right-click any element to open a Choose action menu with Click, Right click, Double click, Hover, and Pick locator. Moving the mouse over an element records nothing, so this menu is how codegen records a hover. The screenshot below is from a Playwright 1.63 codegen session on the eCommerce Playground; the floating bar at the top holds the record and assertion buttons.
How to Generate Tests Using Playwright Inspector
The walkthrough uses the TestMu AI eCommerce Playground, a dummy store built for web automation testing.
It records tests for the account login page first, then for a product listing page where codegen needs help from you.
Set Up Playwright With TypeScript
Create a project with the official initializer. It asks for TypeScript or JavaScript, the tests folder name, and whether to add a GitHub Actions workflow, then installs the browsers:
npm init playwright@latestIf you prefer to work in the editor, Microsoft's Playwright Test for VSCode extension installs Playwright from the command palette and adds Record new and Pick locator buttons to the testing sidebar. How to install Playwright walks through both routes.
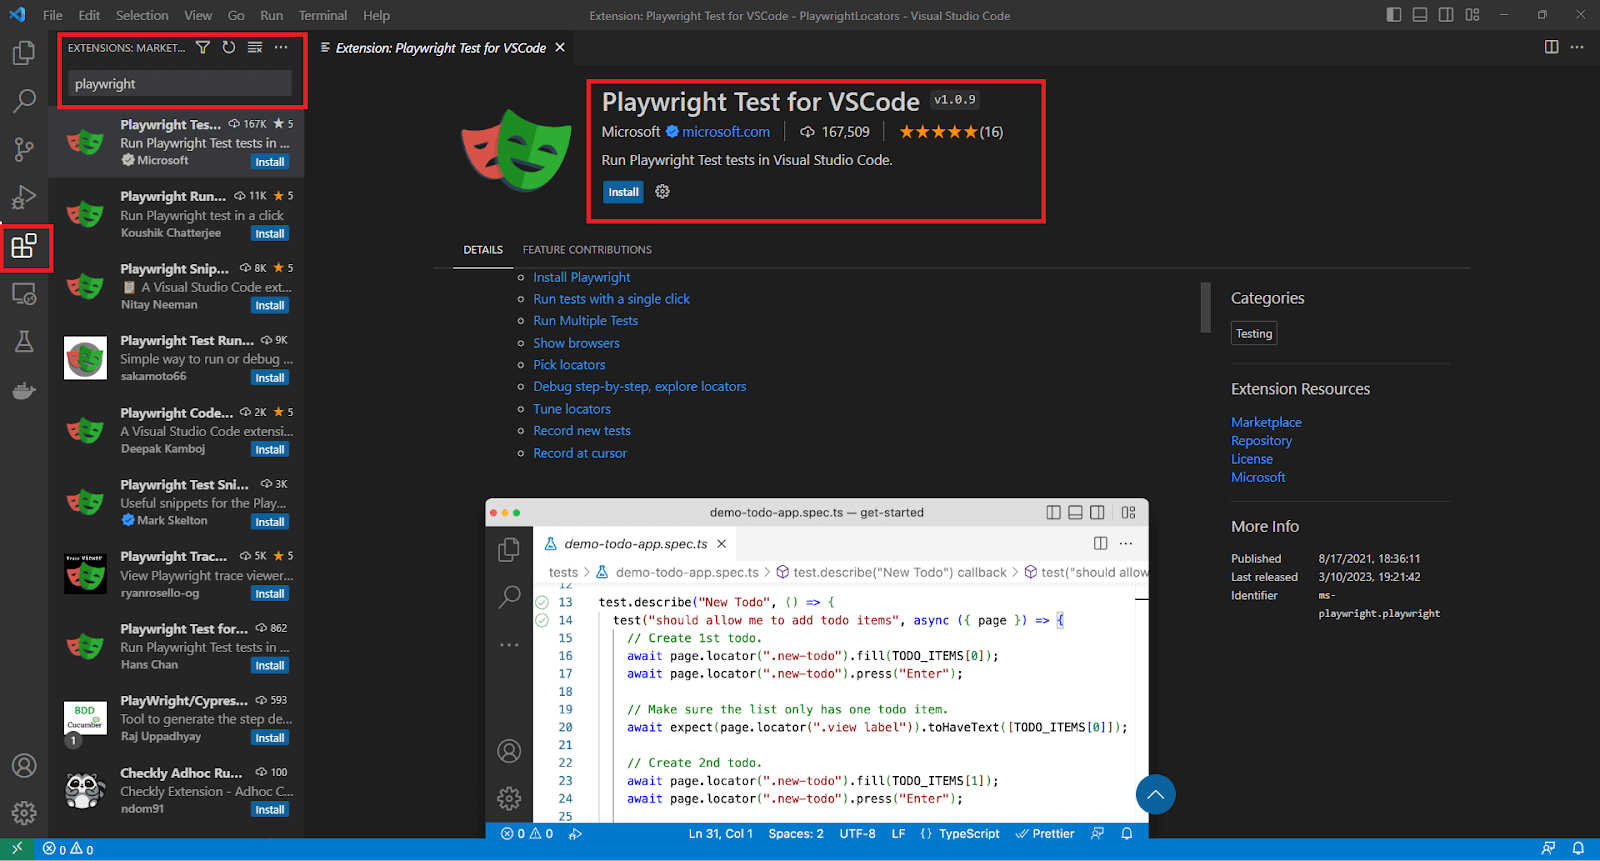
The generated playwright.config.ts tells Playwright where tests live, which reporter to use, and which browsers to run. This walkthrough keeps it to Chromium and the HTML reporter:
import { defineConfig, devices } from '@playwright/test';

export default defineConfig({
  testDir: './tests',
  reporter: 'html',
  projects: [
    { name: 'chromium', use: { ...devices['Desktop Chrome'] } },
  ],
});
Test 1: Continue Link for New Customers
- Start codegen on the login page with the command below. Quote the URL so the shell does not treat ? or & as special characters.
- Click Record to stop recording, so your next clicks on the page do not turn into steps.
- Click Pick locator, then click the Continue button under New Customer. The locator field shows getByRole('link', { name: 'Continue' }).
- Copy the locator into a test and assert it with toBeVisible().
npx playwright codegen "https://ecommerce-playground.lambdatest.io/index.php?route=account/login"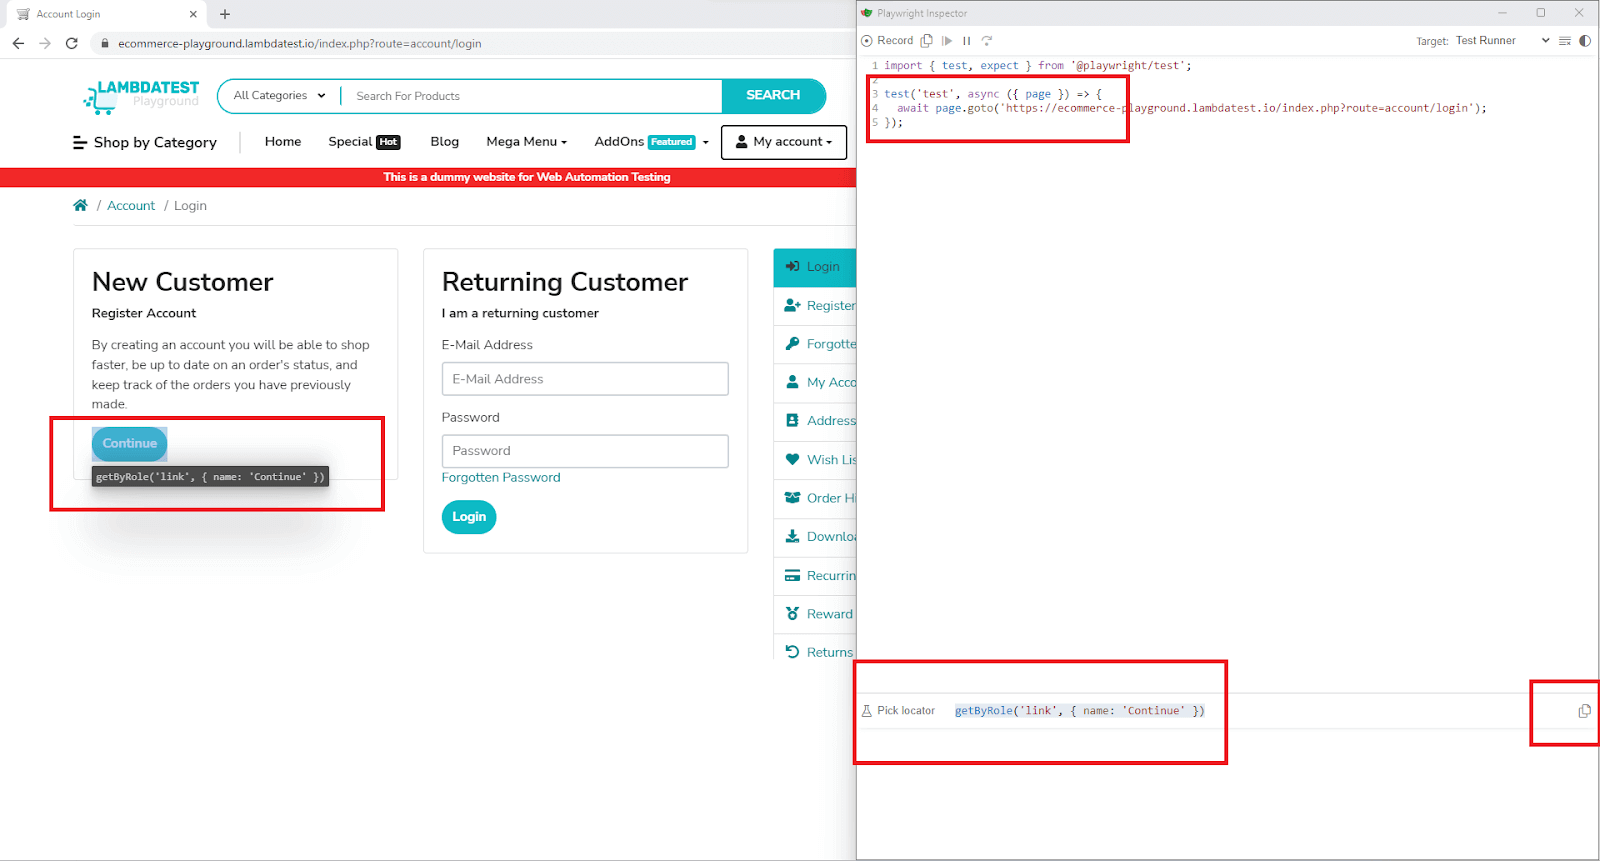
Role locators match an element by its ARIA role and accessible name, the way assistive technology reads the page, and codegen prioritizes role, text, and test id locators when it picks one. How to use Playwright locators covers the other built-in options, and Playwright assertions explains why expect(...).toBeVisible() retries until the element appears.
import { test, expect } from '@playwright/test';

const LOGIN_URL = 'https://ecommerce-playground.lambdatest.io/index.php?route=account/login';

test('new customer registration link to be visible', async ({ page }) => {
  await page.goto(LOGIN_URL);
  await expect(page.getByRole('link', { name: 'Continue' })).toBeVisible();
});
Test 2: Email and Password Fields
With recording stopped and Pick locator on, clicking the E-Mail Address field returns getByPlaceholder('E-Mail Address'), and the password field returns getByPlaceholder('Password'). Both inputs carry placeholder text, and the picked locators use it.
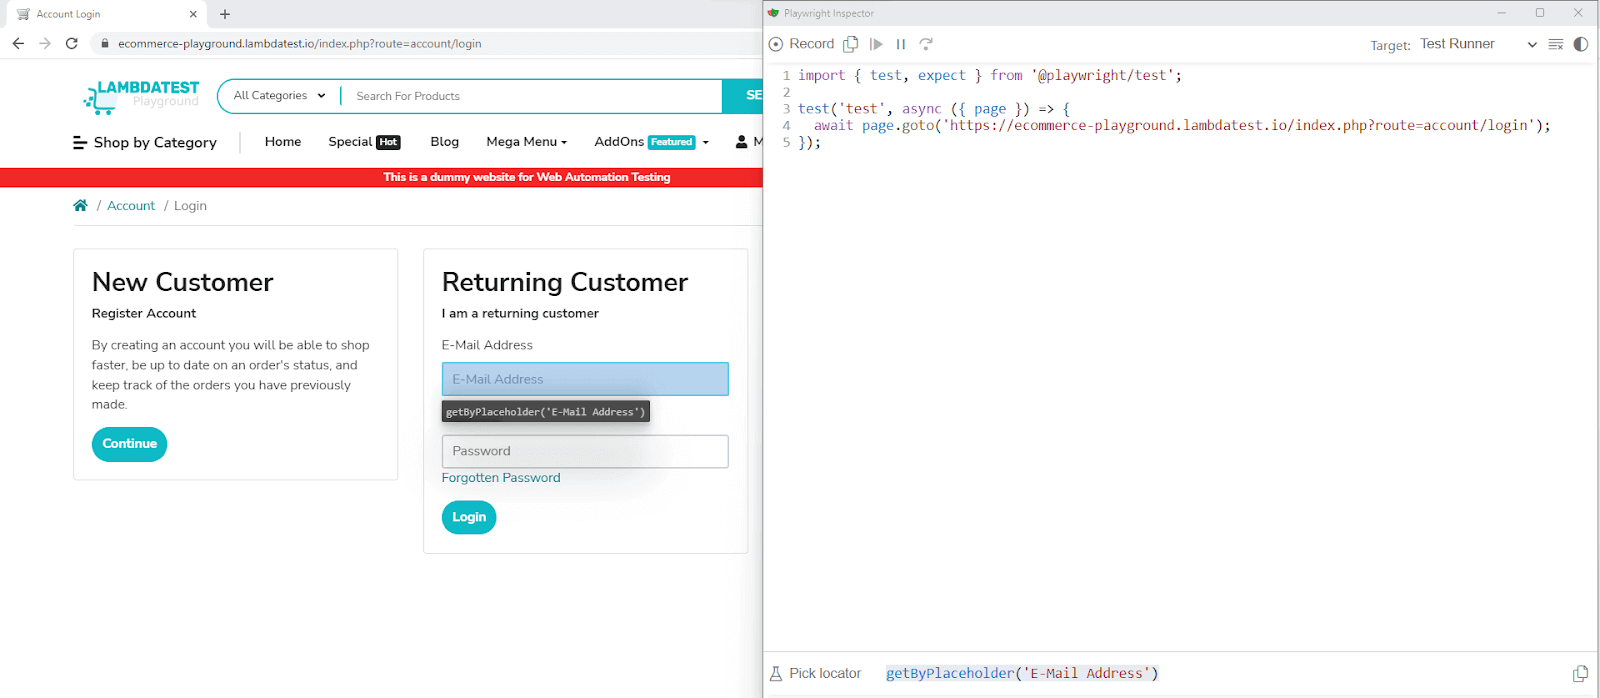
test('email password to be visible', async ({ page }) => {
  await page.goto(LOGIN_URL);
  await expect(page.getByPlaceholder('E-Mail Address')).toBeVisible();
  await expect(page.getByPlaceholder('Password')).toBeVisible();
});
Test 3: Forgotten Password Link
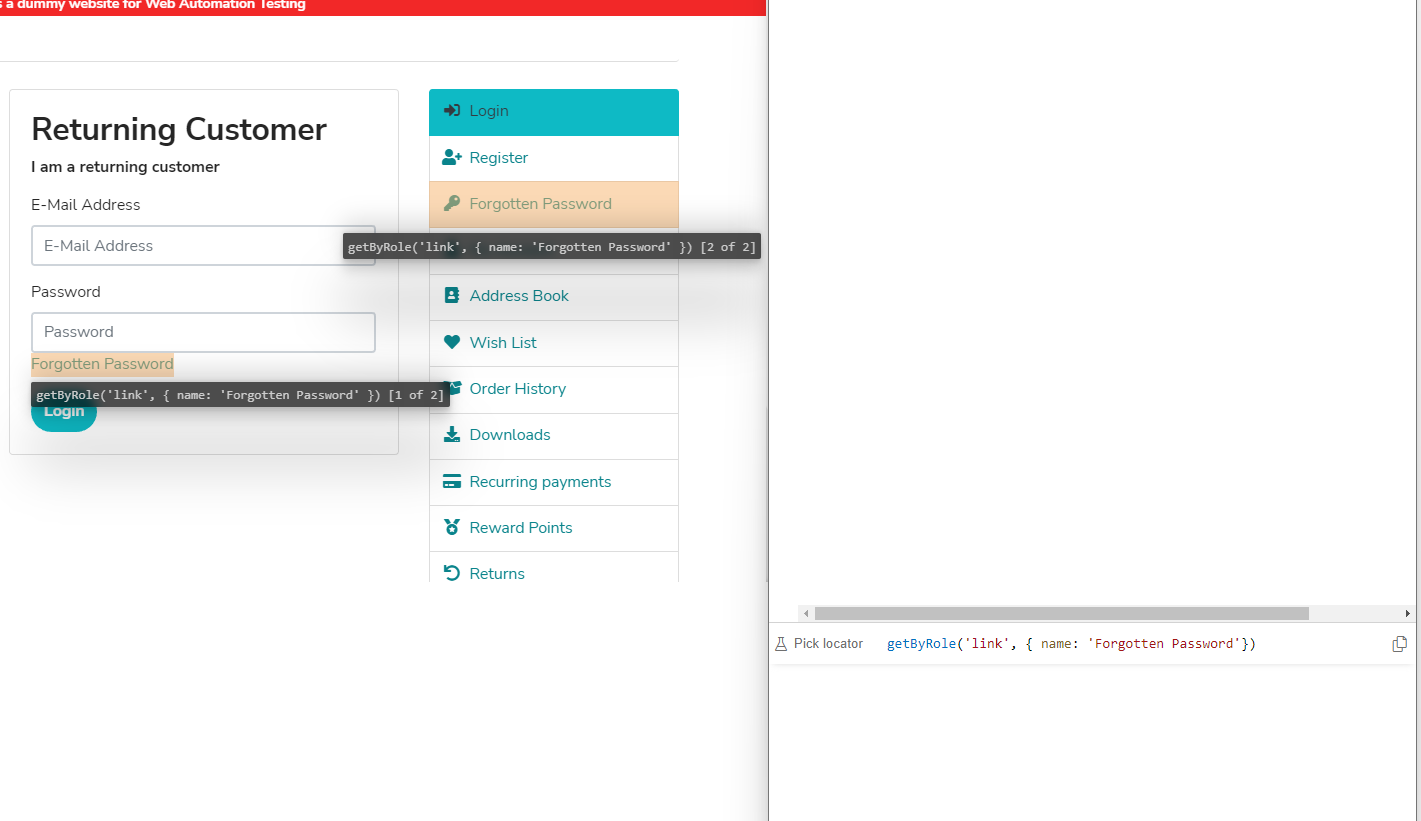
Picking the Forgotten Password link returns getByRole('link', { name: 'Forgotten Password', exact: true }). A second link in the account menu on the right also contains the text Forgotten Password, and exact: true limits the match to the link whose accessible name is exactly that text.
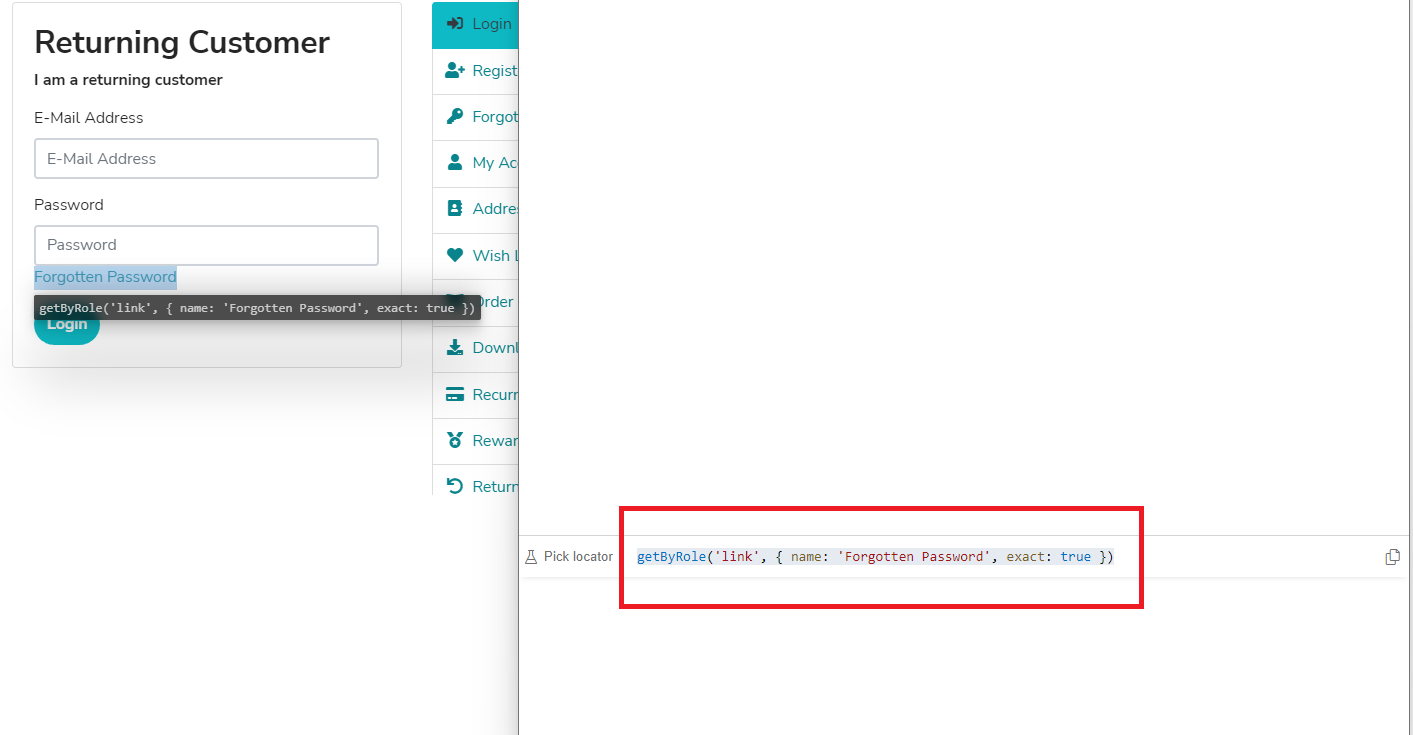
Delete exact: true in the locator field and the Inspector highlights 2 matches, which would make any action on the locator fail Playwright's strict mode.
test('forgotten password to be visible', async ({ page }) => {
  await page.goto(LOGIN_URL);
  await expect(page.getByRole('link', { name: 'Forgotten Password', exact: true })).toBeVisible();
});
Test 4: Product Quick View
On the product category page, each product card shows a Quick view button only on hover, and the button opens a modal with a quantity field and an image gallery. Start codegen on the page:
npx playwright codegen "https://ecommerce-playground.lambdatest.io/index.php?route=product/category&path=57"In a Playwright 1.63 codegen session on this page, scrolling produced no code, right-click then Hover recorded a hover, and clicking Quick view and the plus button recorded clicks. The recording, trimmed after the first click on the plus button:
import { test, expect } from '@playwright/test';

test('test', async ({ page }) => {
  await page.goto('https://ecommerce-playground.lambdatest.io/index.php?route=product/category&path=57');
  await page.getByTitle('Quick view').first().hover();
  await page.getByTitle('Quick view').first().click();
  await page.getByRole('button', { name: 'Increase quantity' }).click();
});
A test built from that recording failed on its hover step after the 30-second test timeout. The call log names the element in the way:
Error: locator.hover: Test timeout of 30000ms exceeded.
Call log:
  - waiting for getByTitle('Quick view').first()
    - locator resolved to <button title="Quick view" onclick="mz_quick_view.show('28');" class="btn btn-quick-view quick-view-28">…</button>
  - attempting hover action
    2 × waiting for element to be visible and stable
      - element is visible and stable
      - scrolling into view if needed
      - done scrolling
      - <div id="entry_212398" class="entry-col col-12 justify-content-between align-items-center flex-wrap">…</div> from <div id="entry_212397" class="entry-row row order-3 no-gutters ">…</div> subtree intercepts pointer events
    - retrying hover action
    - waiting 20ms
During recording, the mouse was already over the product card, so codegen aimed the hover at the Quick view button inside it. On replay nothing hovers the card first, so the div the log names still sits on top of the button and receives the pointer. Hovering the product image link instead fixes the test:
const CATEGORY_URL = 'https://ecommerce-playground.lambdatest.io/index.php?route=product/category&path=57';

test('dynamic element', async ({ page }) => {
  await page.goto(CATEGORY_URL);
  // Hover the product card itself; its Quick view button only takes pointer events after that
  await page.getByRole('link', { name: 'HTC Touch HD' }).first().hover();
  await page.getByTitle('Quick view').first().click();
  // One click() with clickCount: 5 replaces five recorded clicks on the plus button
  await page.getByRole('button', { name: 'Increase quantity' }).click({ clickCount: 5 });
  await expect(page.getByRole('spinbutton', { name: 'Qty' })).toHaveValue('6');
  await expect(page.locator('#image-gallery-212946').getByRole('link', { name: 'HTC Touch HD' })).toHaveCount(5);
});- Hover target - the product image link, getByRole('link', { name: 'HTC Touch HD' }).first(), replaces the Quick view button codegen picked.
- clickCount: 5 - one click() call stands in for clicking the plus button five times, which takes the quantity from 1 to 6.
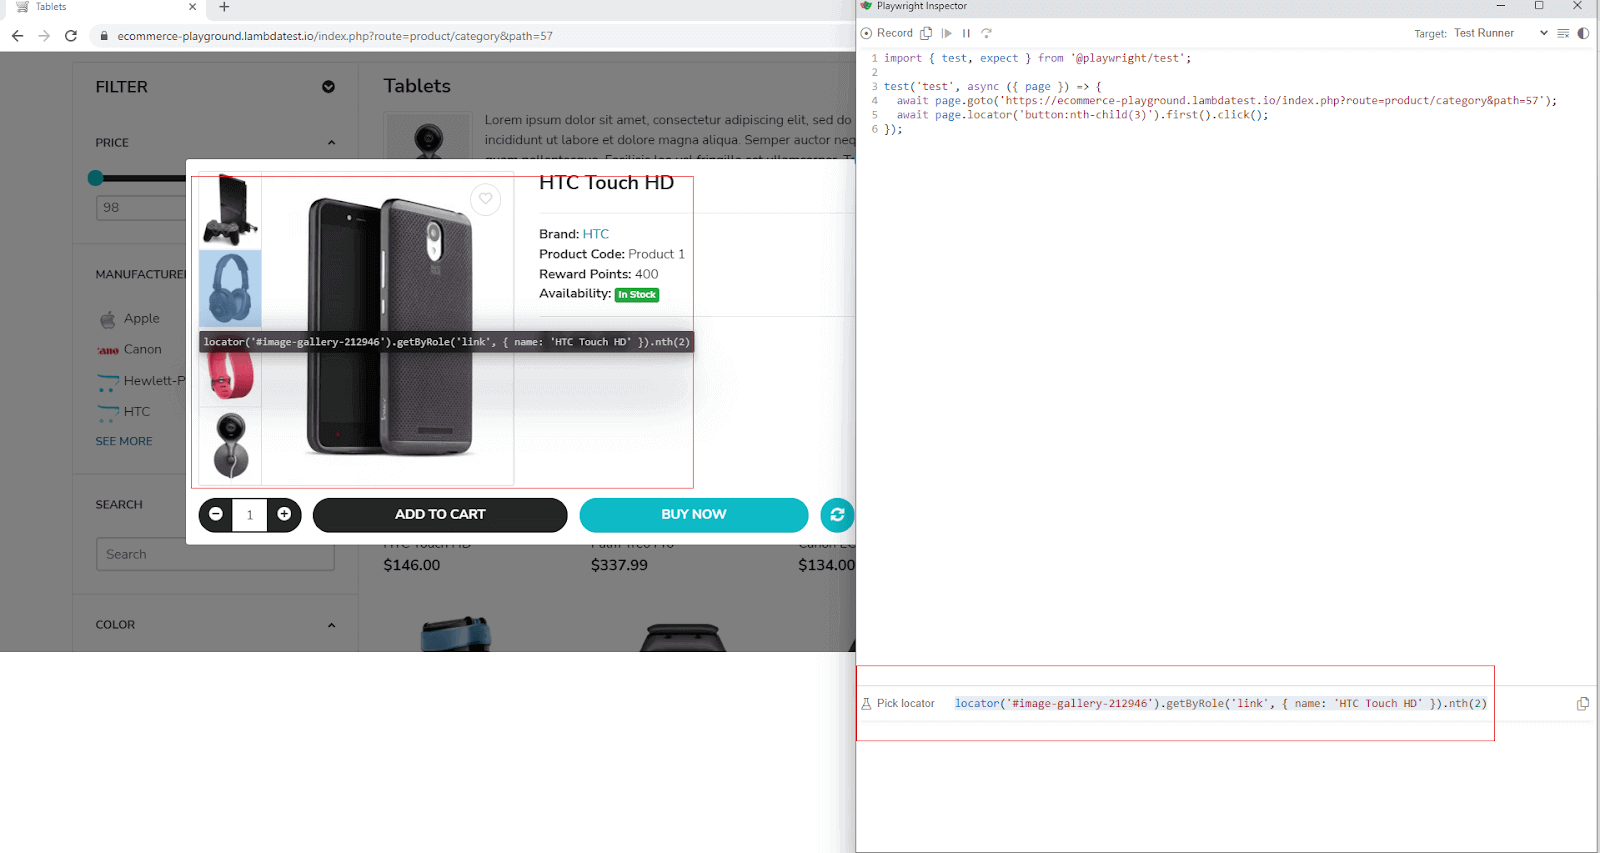
- Gallery assertion - Pick locator on a gallery thumbnail returns a chained locator scoped to #image-gallery-212946; dropping its .nth(2) gives the toHaveCount(5) check.
- No mouse.wheel() - the 2023 version of this test scrolled with page.mouse.wheel(0, 50) because codegen never records a scroll. hover() scrolls the card into view as part of its actionability checks, and the 1.63 run passes without the wheel call.
Run the Tests
With the four tests saved in tests/inspector.spec.ts, run the file from the project root:
npx playwright test tests/inspector.spec.tsThe run below used Playwright 1.63 on Windows with the locally installed Google Chrome (channel: 'chrome' in the project's use block):
Running 4 tests using 1 worker

  ok 1 [chromium] › tests\inspector.spec.ts:6:5 › new customer registration link to be visible (6.9s)
  ok 2 [chromium] › tests\inspector.spec.ts:11:5 › email password to be visible (7.4s)
  ok 3 [chromium] › tests\inspector.spec.ts:17:5 › forgotten password to be visible (7.0s)
  ok 4 [chromium] › tests\inspector.spec.ts:22:5 › dynamic element (14.4s)

  4 passed (36.8s)
npx playwright show-report opens the HTML report, where each test lists its steps and the actionability log behind each one.

Note: Debugging one browser on your machine leaves the rest of the matrix unchecked. Run the same spec on TestMu AI across Chrome, Firefox, Safari, and Edge, with video and logs for every session. Try TestMu AI free
Playwright Inspector Limitations
- Scrolling is never recorded - codegen ignores mouse-wheel scrolling. For elements already in the DOM, hover() and click() scroll them into view on their own; for infinite scroll or content that only renders after a scroll, add the scroll yourself. How to scroll to an element in Playwright covers the options.
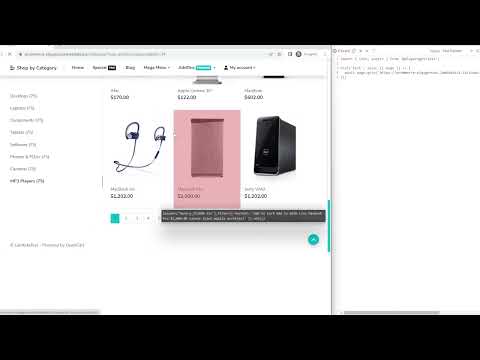
- Hover needs the right-click menu - moving the mouse over an element records nothing. Choose Hover from the Choose action menu, then check the recorded target, since it can land on a child element that only accepts pointer events after its parent is hovered, as in Test 4.
- It needs a headed browser - --debug and PWDEBUG launch headed browsers, and the page.pause() reference says the method requires headed mode. For failures that only happen in CI, record a trace instead.
- Recorded locators need review - codegen picks whatever is unique at recording time, which can be index-based (.first(), .nth(2)) or tied to a page-specific id such as #image-gallery-212946. Swap them for role or test id locators where the page allows it.

Austin Siewert
Co-Founder, Steadfast Systems
Discovered @TestMu AI yesterday. Best browser testing tool I've found for my use case. Great pricing model for the limited testing I do 👏
2M+ Devs and QAs rely on TestMu AI
Deliver immersive digital experiences with Next-Generation Mobile Apps and Cross Browser Testing Cloud

How to Debug Tests Using Playwright Inspector
Run the suite with the debug flag. Each test opens in a headed browser next to the Inspector, paused before its first action; Resume (F8) runs to the next page.pause() or the end of the test, and Step over (F10) runs one action.
npx playwright test --debug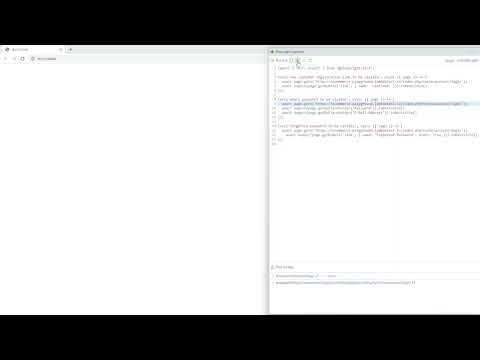
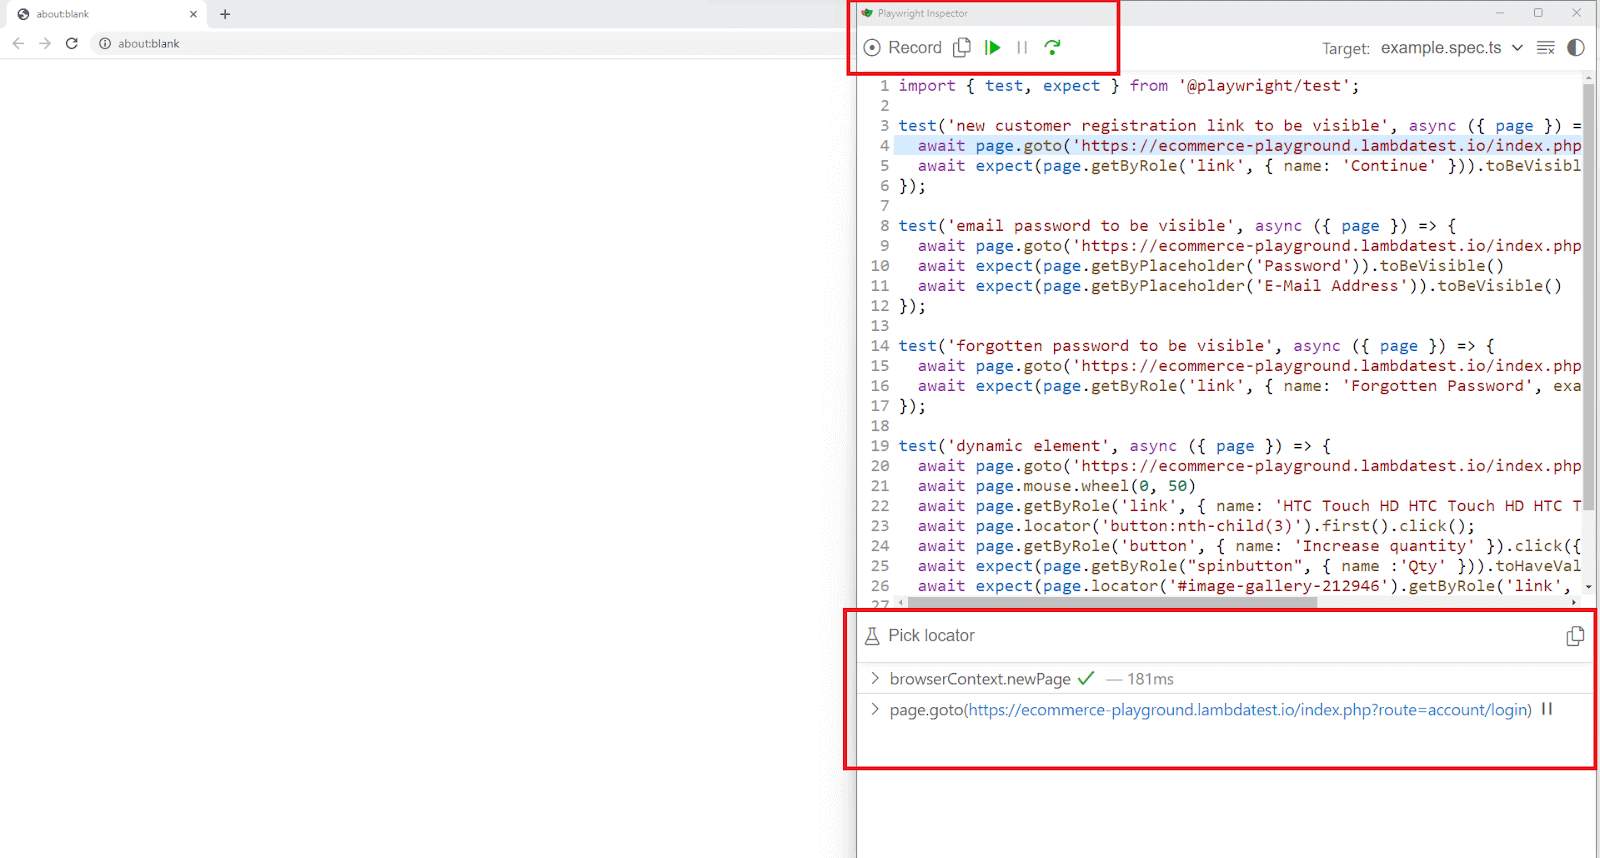
The screenshots in this section come from the original 2023 run of these tests, when the quick view test still had its mouse.wheel() line.
Step Through a Test
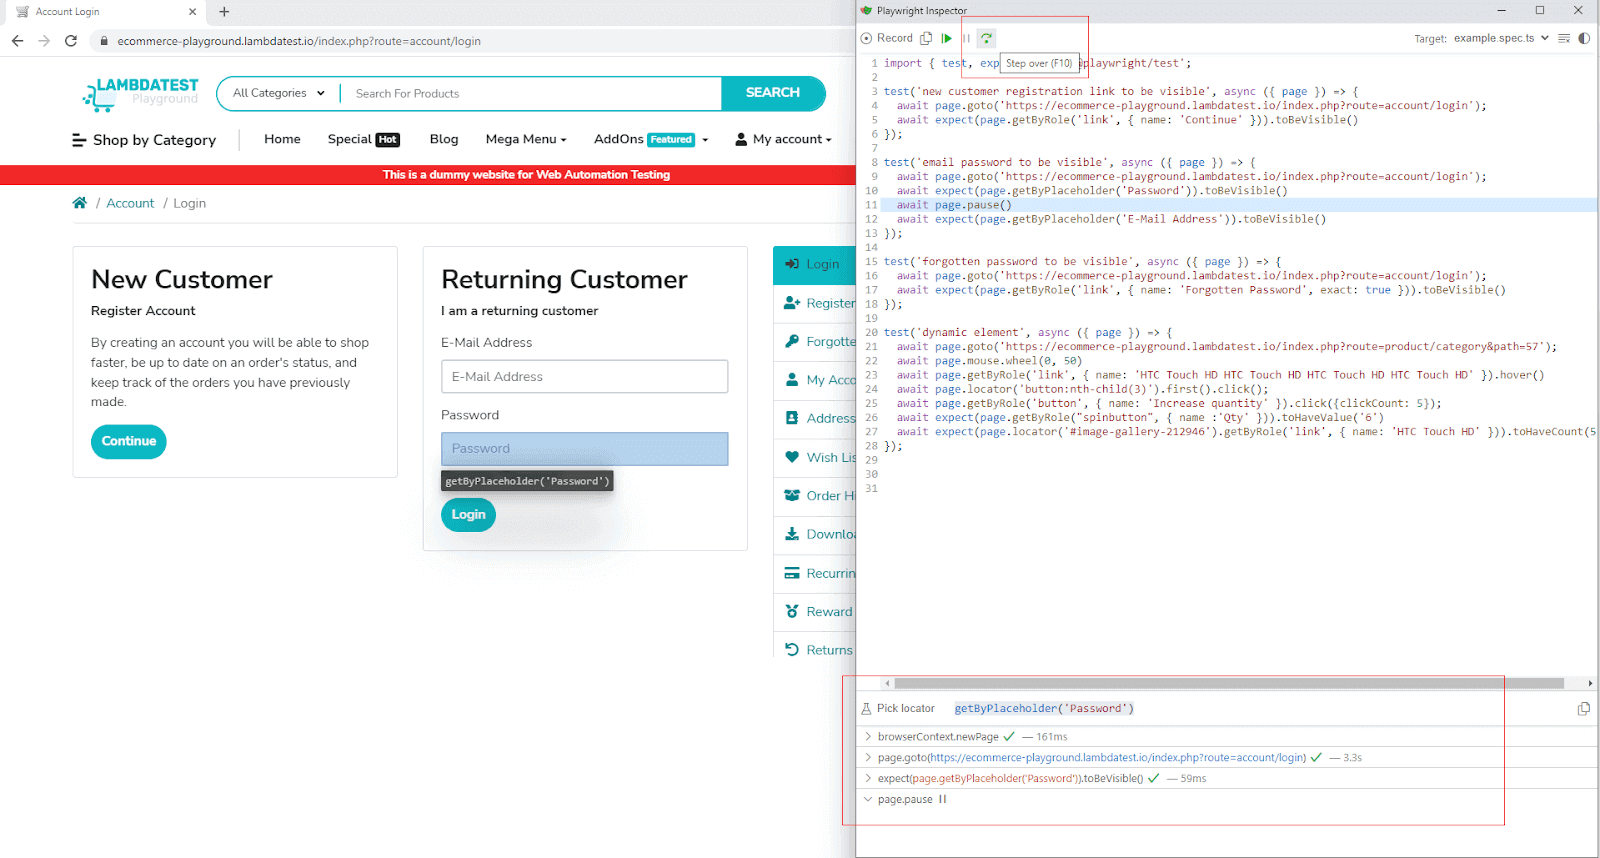
Press F10 or click Step over to run the highlighted action. The browser highlights the element that action targets, and the call log adds the action with its duration and its actionability checks.
Run From a page.pause() Breakpoint
Stepping from the first line is slow in a long test. Add await page.pause() where you want to stop, run in debug mode, and press Resume: the test runs until the pause and waits there until you press Resume again or call playwright.resume() in the DevTools console.
test('email password to be visible', async ({ page }) => {
  await page.goto(LOGIN_URL);
  await expect(page.getByPlaceholder('E-Mail Address')).toBeVisible();
  await page.pause();
  await expect(page.getByPlaceholder('Password')).toBeVisible();
});
Run only that test with -g, which matches test titles:
npx playwright test -g "email password to be visible" --debug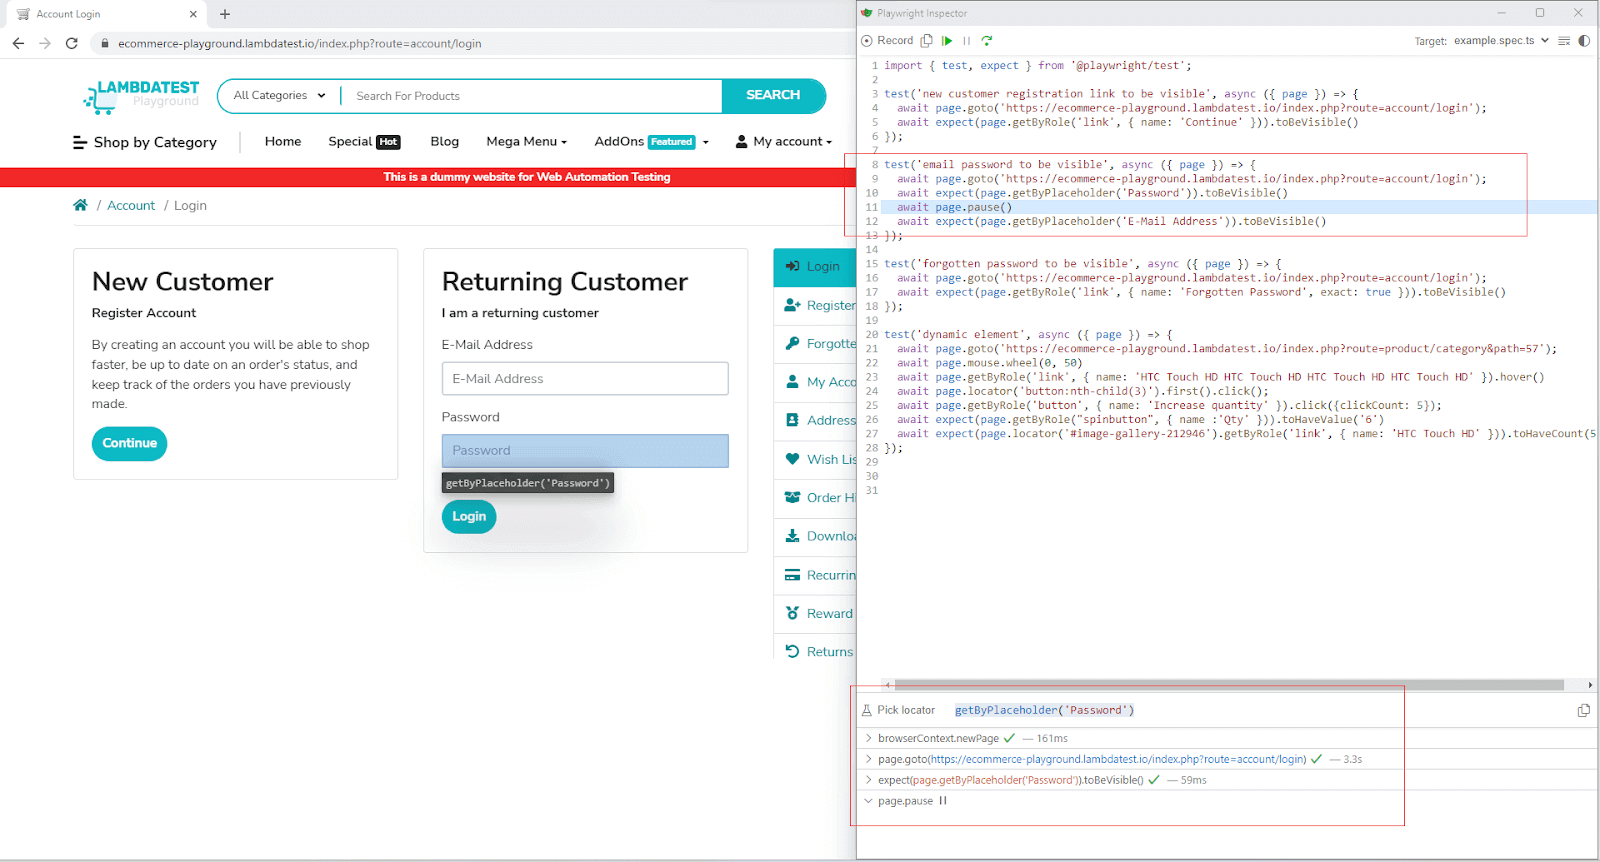
Live Edit Locators
While a test is paused, the field next to Pick locator shows the locator the test stopped on. Edit it and the matching elements highlight in the browser as you type, so you can check a replacement like getByRole('link') against the real page before you change the test.
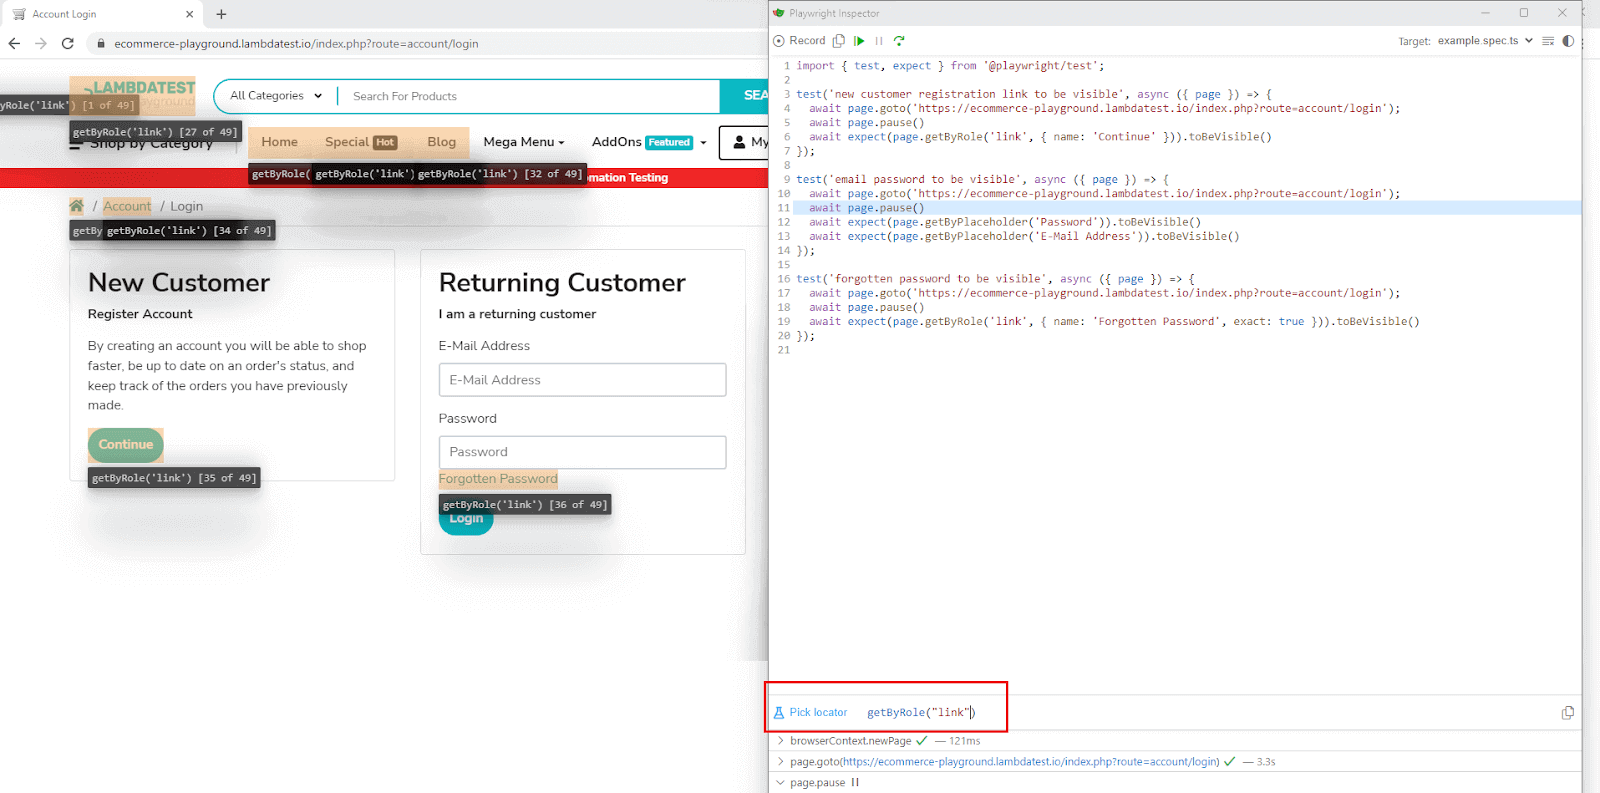
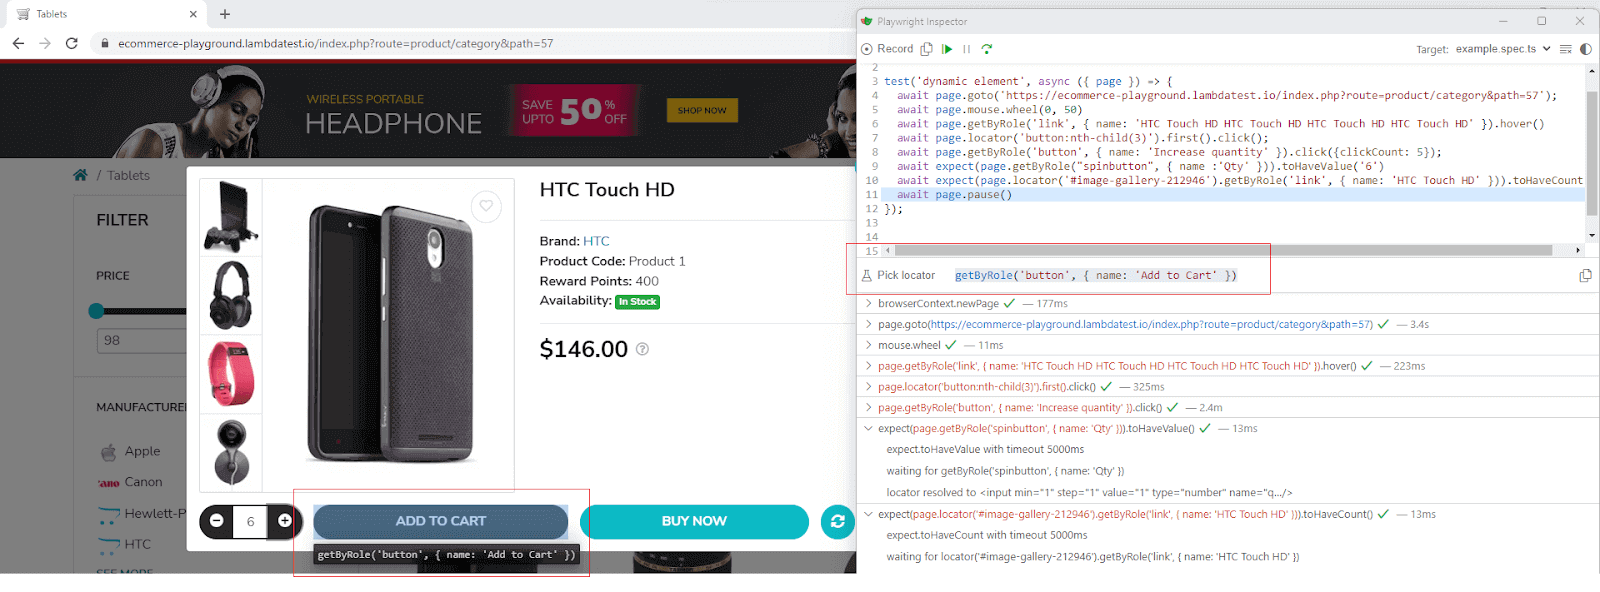
Pick locator also works while paused. In the quick view test, clicking the Add to Cart button in the modal returns its role locator, ready to copy into the next step.
Read the Actionability Log
The call log is where the Inspector explains a stuck action. For each click or hover it lists the checks Playwright ran: waiting for the locator, resolving it to an element, waiting until that element is visible, enabled, and stable, scrolling it into view, and whether another element intercepts the pointer. The Test 4 failure above shows the pattern: every check passed except the last one, which named the blocking element.
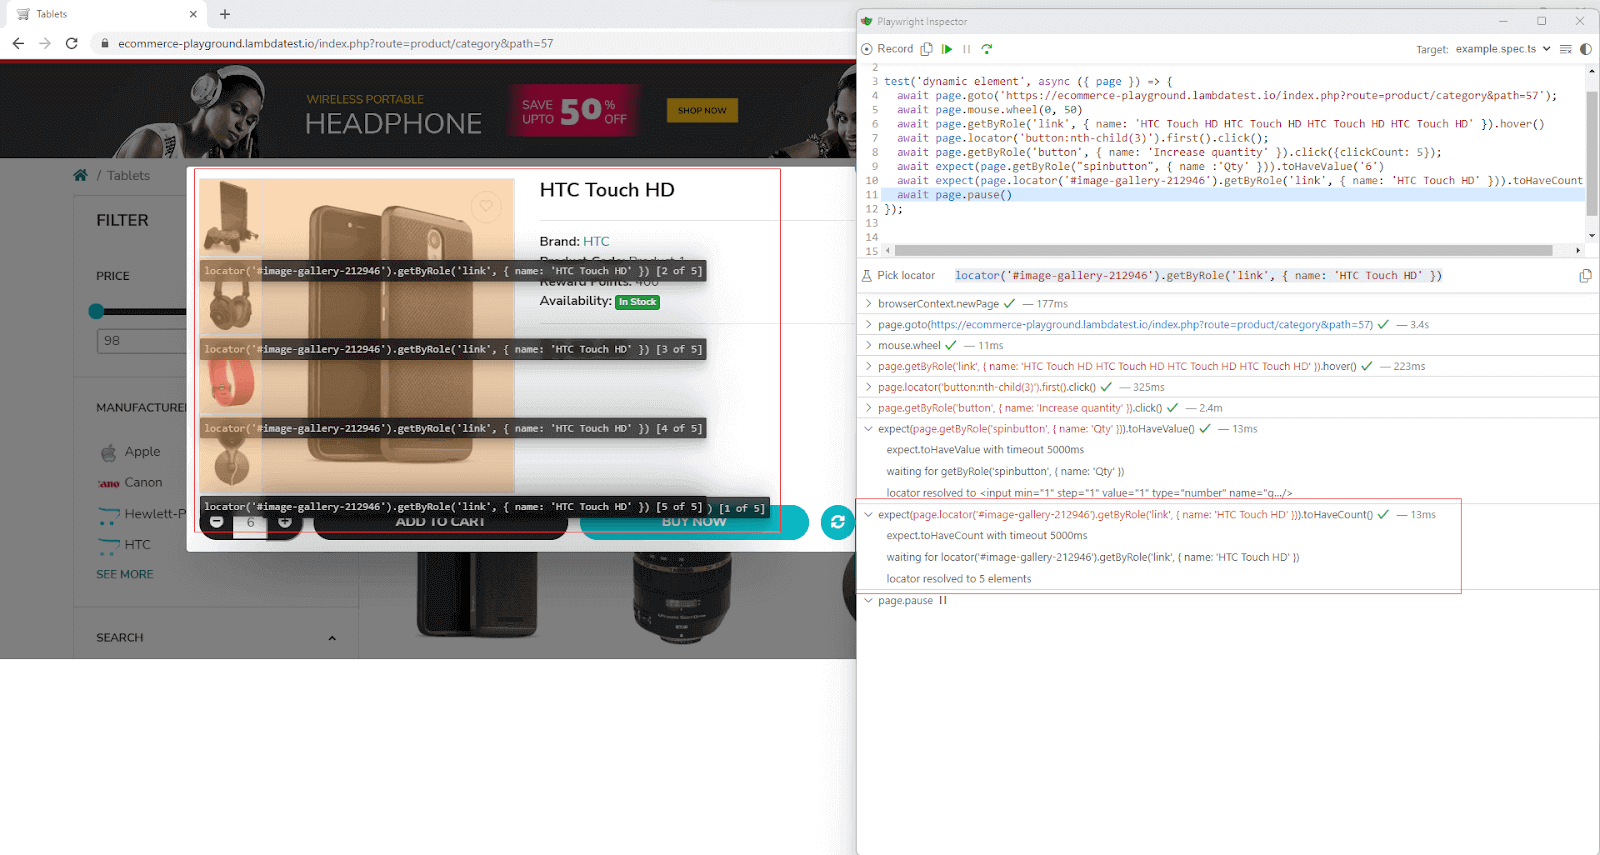
For assertions, the log shows what the locator resolved to. Stepping over the gallery assertion shows it resolving to 5 elements, with each match highlighted in the modal.
When a check keeps retrying until the timeout, the log line it repeats tells you whether to wait for the page or fix the locator. Playwright flaky tests lists the fixes for the common causes.
Debug on a Mobile Viewport
Debug mode runs the projects in playwright.config.ts, so add a device project and target it by name:
projects: [
  { name: 'chromium', use: { ...devices['Desktop Chrome'] } },
  { name: 'Mobile Safari', use: { ...devices['iPhone 12'] } },
],
npx playwright test --project="Mobile Safari" --debug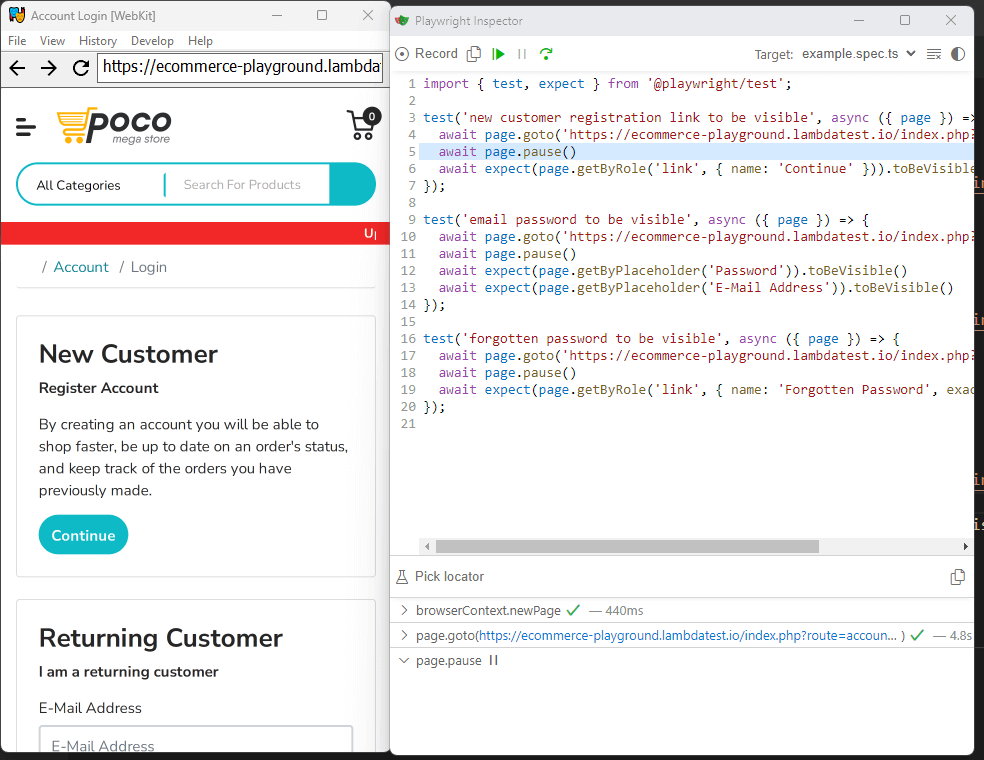
The Mobile Safari project is WebKit with the iPhone 12 viewport, user agent, and touch settings. It catches layout and locator problems on a small screen; bugs tied to the device itself need a physical iPhone.
Debug From the DevTools Console
PWDEBUG=console runs tests in debug mode and exposes a playwright object in the DevTools console of the browser under test, with playwright.$(), playwright.$$(), playwright.inspect(), playwright.locator(), and playwright.selector(). Setting DEBUG=pw:api prints the same call log to the terminal with no window at all.
# playwright object in the browser DevTools console
PWDEBUG=console npx playwright test

# the same call log in the terminal, no window
DEBUG=pw:api npx playwright test
Playwright Inspector vs UI Mode vs Trace Viewer
Pick the tool by where the failure is: happening now on your machine, or already over in CI.
| Tool | Start it with | Best for | Opens CI failures? |
|---|---|---|---|
| Playwright Inspector | --debug, PWDEBUG=1, page.pause() | Stepping through a live, paused browser and testing locators against the real page | No, it needs a headed browser on your machine |
| UI Mode | npx playwright test --ui | Running, watching, and re-running tests with a time-travel timeline, DOM snapshots, and Pick locator | No, it runs the tests itself |
| Trace Viewer | npx playwright show-trace trace.zip | Reviewing a finished run action by action, with DOM snapshots, console, and network | Yes, open the trace.zip from the CI job |
| VS Code extension | Testing sidebar | Breakpoints in your editor, plus Pick locator, Record new, and Record at cursor | No |
A practical order: reproduce a failure in UI Mode, stop on the failing line with the Inspector, and keep traces on retry so CI failures arrive with a trace.zip attached. Running and debugging tests with Playwright UI Mode covers the timeline and watch mode in detail.
use: {
  trace: 'on-first-retry',
},
Run the Same Tests on a Cloud Grid
TestMu AI Automation Cloud runs existing Playwright tests on 3,000+ browser and OS combinations and records network logs, console logs, video, screenshots, and a command log for every session, so a failure on a browser you cannot open locally still leaves a replay to debug.
The TestMu AI Playwright skill includes a lambdatest-setup.ts fixture that connects any project whose name ends in @lambdatest to the grid, with network, video, and console capture turned on. With the spec importing test and expect from that fixture, the only change from the local run is the project:
// playwright.config.ts, with tests importing test and expect from '../lambdatest-setup'
projects: [
  { name: 'chrome:latest:Windows 11@lambdatest', use: { viewport: { width: 1920, height: 1080 } } },
],
LT_USERNAME=<your-username> LT_ACCESS_KEY=<your-access-key> npx playwright test --project="chrome:latest:Windows 11@lambdatest"The same 4 tests on the TestMu AI grid, Chrome on Windows 11, Playwright 1.63 client:
Running 4 tests using 1 worker

  ok 1 [chrome:latest:Windows 11@lambdatest] › cloud-tests\inspector.spec.ts:6:5 › new customer registration link to be visible (21.6s)
  ok 2 [chrome:latest:Windows 11@lambdatest] › cloud-tests\inspector.spec.ts:11:5 › email password to be visible (18.1s)
  ok 3 [chrome:latest:Windows 11@lambdatest] › cloud-tests\inspector.spec.ts:17:5 › forgotten password to be visible (20.3s)
  ok 4 [chrome:latest:Windows 11@lambdatest] › cloud-tests\inspector.spec.ts:22:5 › dynamic element (29.0s)

  4 passed (1.5m)
Let Claude Code write Playwright tests that actually pass.

How Do AI Agents Debug Playwright Tests Without the Inspector?
AI agents do not click through the Inspector's window. They reach the same browser and the same logs through tools of their own:
- Playwright MCP - Microsoft's Playwright MCP server lets an LLM work with web pages through structured accessibility snapshots, without screenshots. Its tools include browser_click, browser_type, browser_navigate, and browser_hover, and the agent reads role and name data, the same information behind getByRole(). Playwright MCP server setup and tools covers the configuration.
- playwright-cli with --debug=cli - the Playwright 1.59 release notes added npx playwright test --debug=cli, so a coding agent can attach with playwright-cli and step over a paused test from the terminal. The Playwright MCP README notes that coding agents increasingly favor CLI plus skills because it avoids loading large tool schemas and accessibility trees into the model context.
- Test Agents - the Playwright 1.56 release notes introduced planner, generator, and healer agent definitions, and the healer runs the suite and repairs failing tests. npx playwright init-agents --loop=claude generates them for Claude Code. Playwright agents: planner, generator, and healer shows them in use.
- Copy prompt - per the Playwright 1.51 release notes, errors in the HTML report, Trace Viewer, and UI Mode have a Copy prompt button that copies the error and its context into a prompt for an LLM to fix.
Whichever route an agent takes, the fix for Test 4 still starts from the "subtree intercepts pointer events" line in the call log. Agent skills for test automation explains how the TestMu AI skills give coding agents Playwright patterns like role locators and web-first assertions.
Conclusion
Run your most troublesome test with npx playwright test --debug and read the call log on the step that fails before you change any locator. Once it passes locally, run the same spec on TestMu AI across browsers; the Playwright testing documentation covers credentials and capabilities.
Author

Jaydeep Karale
Blogs: 6


Jaydeep is a software engineer with 10 years of experience, most recently developing and supporting applications written in Python. He has extensive with shell scripting and is also an AI/ML enthusiast. He is also a tech educator, creating content on Twitter, YouTube, Instagram, and LinkedIn.
Reviewer

Parth Mistry
Reviewer
Parth Mistry is a Member of Technical Staff at TestMu AI (formerly LambdaTest), building SmartUI, the visual regression testing product. He developed and owns the SmartUI CLI, a modular TypeScript tool built on Playwright for multi-browser automation, and built the Storybook CLI for visual regression of UI components. He maintains cross-language SDKs in Python, Java, Ruby, C#, and Node.js, and engineered a Node-based visual rendering service on Kafka, Redis, MySQL, and S3. His migration of that service to an event-driven, KEDA-autoscaled architecture improved execution speed by 60% and cut annual infrastructure cost by $9,600. He also built the end-to-end SmartUI integration with KaneAI. Parth is a Google Summer of Code 2024 contributor and an alumnus of IIT Jodhpur.
Playwright Inspector FAQs
Did you find this page helpful?
More Related Blogs
TestMu AI forEnterprise
Get access to solutions built on Enterprise
grade security, privacy, & compliance
- Advanced access controls
- Advanced data retention rules
- Advanced Local Testing
- Premium Support options
- Early access to beta features
- Private Slack Channel
- Unlimited Manual Accessibility DevTools Tests