

Power Your Software Testing with AI Agents and Cloud
The Native AI-Agentic Cloud Platform to Supercharge Quality Engineering. Test Intelligently and Ship Faster.


- TestMu AI (Formerly LambdaTest)
- /
- Blog
- /
- Running and Debugging Tests With Playwright UI Mode
Running and Debugging Tests With Playwright UI Mode
Learn how to run and debug tests using Playwright UI mode. Explore its interactive interface to efficiently execute tests, debug, and analyze results.
Last Updated on:
On This Page
Running npx playwright test --ui opens Playwright UI mode, a visual test runner that lets you pause a run mid-test, inspect the DOM, and pick the most stable selector for an element. Its Watch feature reruns the affected test automatically whenever the test file changes, so a fix gets verified without manually re-triggering execution. This guide covers the mode's components, setup steps, debugging features, and how AI coding agents now debug through the same browser via Playwright MCP.
Key Takeaways
- Playwright UI mode opens with npx playwright test --ui and lets a person pause a test mid-run to inspect the DOM and pick a stable selector.
- The Watch feature reruns a test automatically whenever its file changes, removing the need to manually re-trigger execution.
- The Developer Tools panel groups Locator, Source, Call, Log, Errors, Console, Network, Attachments, and Annotations into one interface instead of separate browser tools.
- Playwright MCP, Microsoft's official Model Context Protocol server, lets AI coding agents control the same Chromium, Firefox, or WebKit browser through a structured tool call instead of a GUI.
- Accessibility-tree based automation is faster and cheaper on tokens than pixel-based clicking, which is why AI agents default to it for browser control.
- UI mode suits interactive human debugging, while an agent running in CI calls Playwright MCP directly without opening a visual interface.
What Is Playwright UI Mode?
Playwright UI mode is an interactive feature that allows you to run, inspect, and debug tests in a visually intuitive environment.
With UI mode, users can see exactly what’s happening on their website during test execution, making it easier to identify issues and improve test reliability. This interface brings a visual and user-friendly approach to testing, which contrasts with the traditionally code-centric methods of automation testing.
Key Benefits:
- Enables you to view the test run in real-time. When each step is executed, the associated actions are presented side by side to demonstrate how the elements are used.
- Allows you to stop test execution at any stage and check the page elements for issues such as timing or selector issues.
- Comes with a Trace Viewer that provides details about every test run. The Trace Viewer records all the actions performed while a test is in progress, using screenshots and network traffic.
- Makes it easy to find reliable Playwright locators for page elements. When you hover over various elements, Playwright shows the most stable selector for each one.
- Lets you easily execute test steps and see the results if you change them. This streamlines the testing process by reducing the number of full test cycles needed. It helps you save time, especially when working on large-scale projects, where tests can take time to execute completely.
- Supports automated screenshots and video recordings of test runs. These visual aids clearly represent the testing journey step by step, helping teams understand exactly where issues occur.

Note: Run Playwright headed tests across 50+ real browsers. Try TestMu AI Today!
Components of Playwright UI Mode
The screenshot shows the Playwright UI mode, which provides a graphical interface for running and debugging Playwright tests.
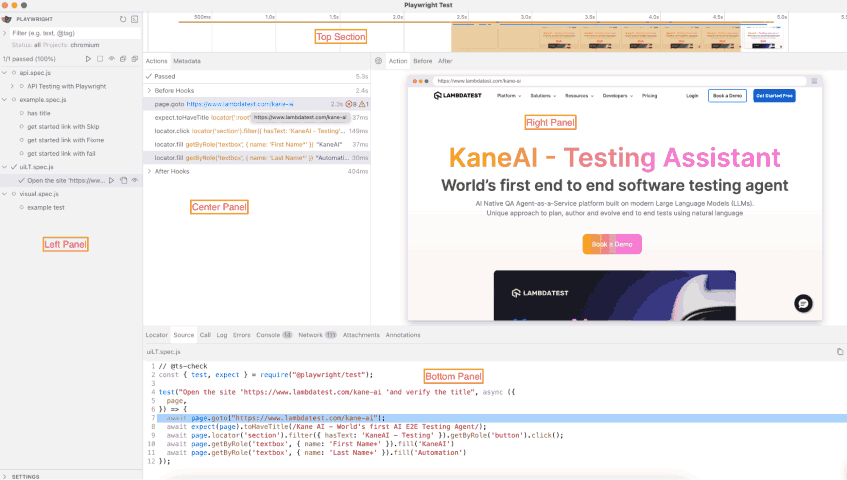
Let’s break down each component in detail:
- Test Explorer (Left Panel): The test explorer comes with the following features:
- Filters tests (through search box) by keywords, tags (e.g., @tau), or metadata, helping to narrow down tests in large suites.
- Displays tests of all statuses (passed, failed, skipped) by default, with the option to filter specific states.
- Filters tests based on the selected browser (e.g., Chromium, Firefox, WebKit).
- The above screenshot shows the following test files:
- api.spec.js
- example.spec.js
- uiLT.spec.js
- visual.spec.js
- Timeline (Top Section): It displays a graph tracking test execution over time. This helps visualize the duration of each test or step. It is also useful for identifying performance bottlenecks and debugging slow-running tests.
- Action Explorer (Center Panel): It records and displays test execution details step by step.
- Actions: Logs user interactions (clicks, inputs, navigation, etc.).
- Metadata: Displays additional test attributes (e.g., environment, priority).
- Action: Lists recorded actions performed during the test.
- Before/After: Shows test setup and teardown steps.
- Pick Locator: Helps identify element locators for test scripts.
- Browser Preview (Right Panel): It provides a real-time view of test execution. In the screenshot, the browser shows that the KaneAI link is opened.
- Developer Tools (Bottom Panel): It contains tabs similar to browser dev tools:
- Locator: Assists in finding elements.
- Source: Displays the test script source code.
- Call: Logs API calls, function executions, or internal Playwright actions.
- Log: Provides a detailed execution log.
- Errors: Lists runtime errors (e.g., element not found, network failures).
- Console: Displays logs and debug messages.
- Network: Logs network requests made during test execution.
- Attachments: Stores test artifacts like screenshots, videos, and downloaded files.
- Annotations: Highlights test case statuses (e.g., skipped, fixme, slow).
How to Use Playwright UI Mode?
Now, let’s look at how to set up UI mode in Playwright:
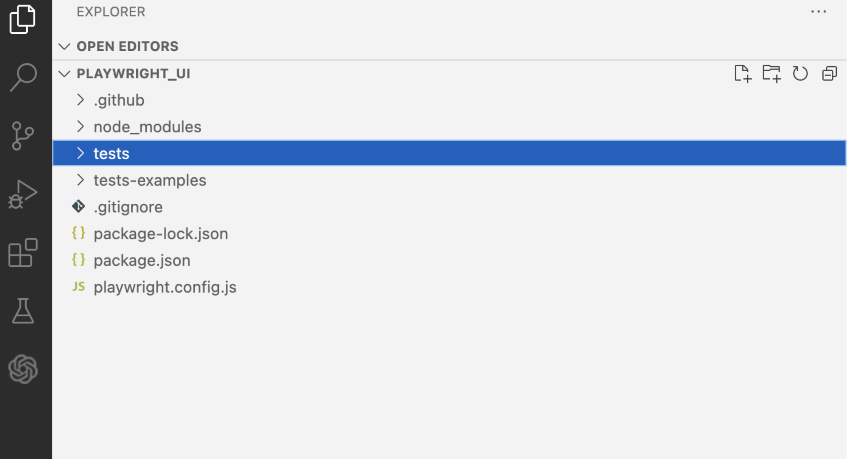
- Install Playwright v1.32 by running the below command:
npm install @playwright/test@1.32
npm init playwright@latest
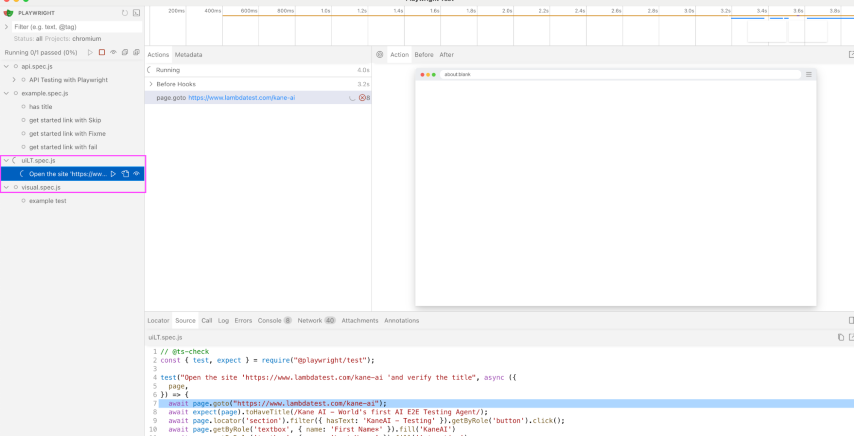
npx playwright test --ui
// @ts-check
const { test, expect } = require("@playwright/test");


test("Open the site , verify the title, and fill data in the fields", async ({
 page,
}) => {
 await page.goto("https://www.testmuai.com/kane-ai/");
 await expect(page).toHaveTitle(/Kane AI - World's first AI E2E Testing Agent/);
 await page.locator('section').filter({ hasText: 'KaneAI - Testing' }).getByRole('button').click();
 await page.getByRole('textbox', { name: 'First Name*' }).fill('KaneAI')
 await page.getByRole('textbox', { name: 'Last Name*' }).fill('Automation')
});
Features of Playwright UI Mode
Now let’s look at different UI mode features offered by Playwright and how you can use them:
Filtering Tests
You can filter the executed test script by text or @tag. Also, With the status ‘passed,’ it will display only the passed test cases. Status with ‘failed’ will display all failed test cases, and the status ‘skipped’ will display if there are any skipped test cases during the execution.
Additionally, you can filter by the project (Chromium, Firefox, and WebKit) and display test cases executed as part of cross-browser testing.

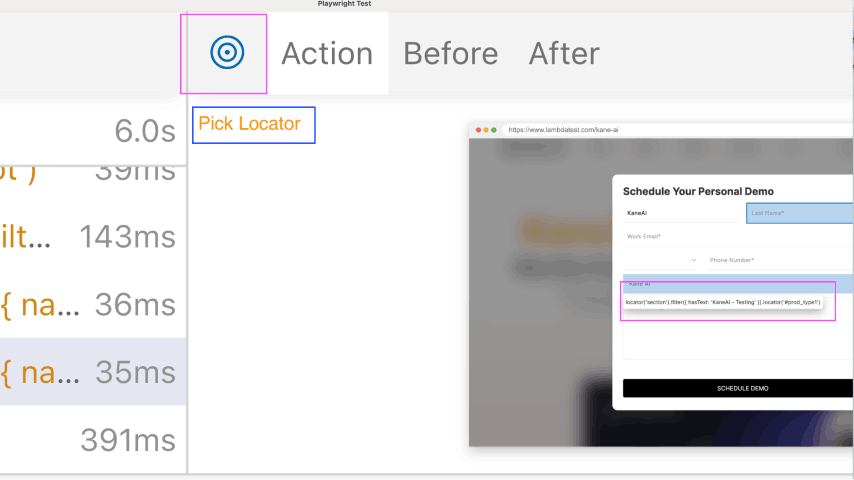
Pick Locator
The Pick Locator feature in Playwright UI mode assists in identifying locators for elements on a webpage. To capture the locator of a specific field, simply click on the circle icon (as shown in the screenshot) and hover over the desired field. This will highlight and display the corresponding locator for easy selection.
Actions and Metadata
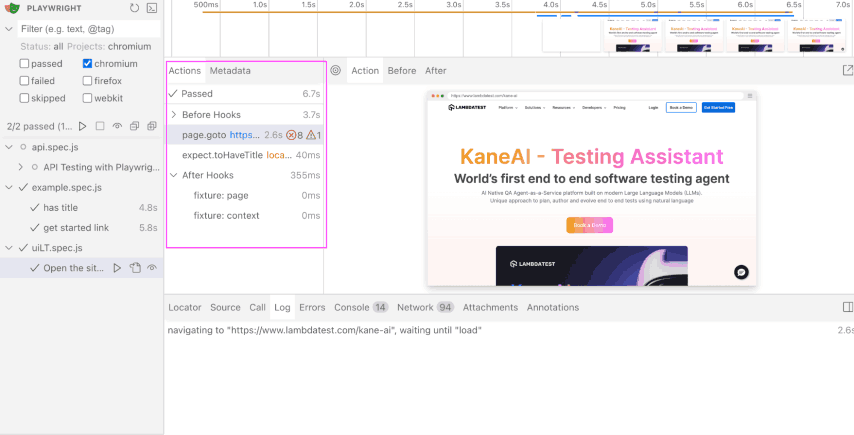
In the Actions tab, you can see all the actions we have performed against a particular test. When you hover over each command, you can see the change in DOM on the right side.
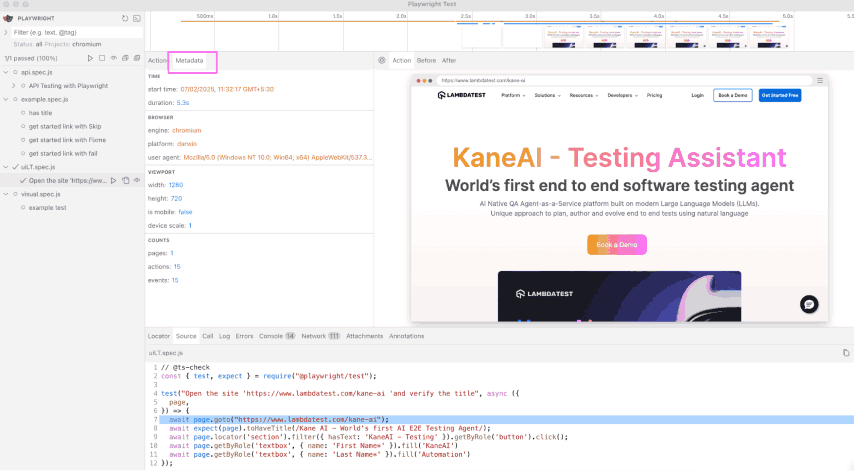
In the Metadata tab, you can see the details about the particular test case start time, browser, viewport and count, which include pages, actions and events.
Timeline View
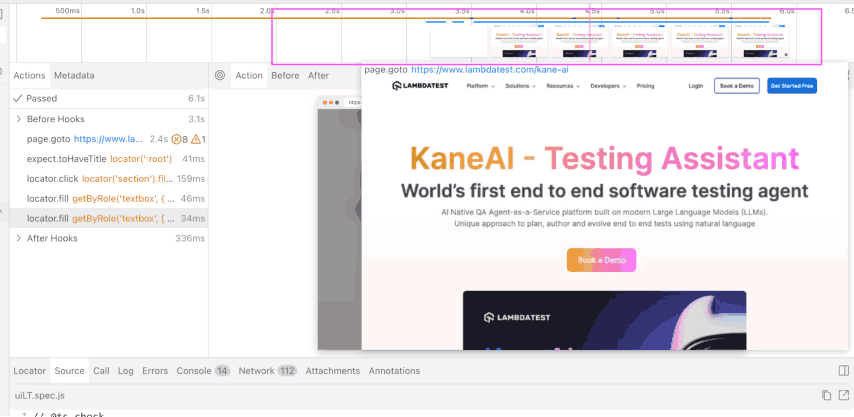
At the top of the trace, you can see a timeline view of each action of your test. The timeline shows image snapshots after hovering over it, and double-clicking any action will show its time range.
The slider adjustment lets you choose additional actions that directly filter the Actions tab while controlling log visibility in the console and network tabs.
Watch Feature
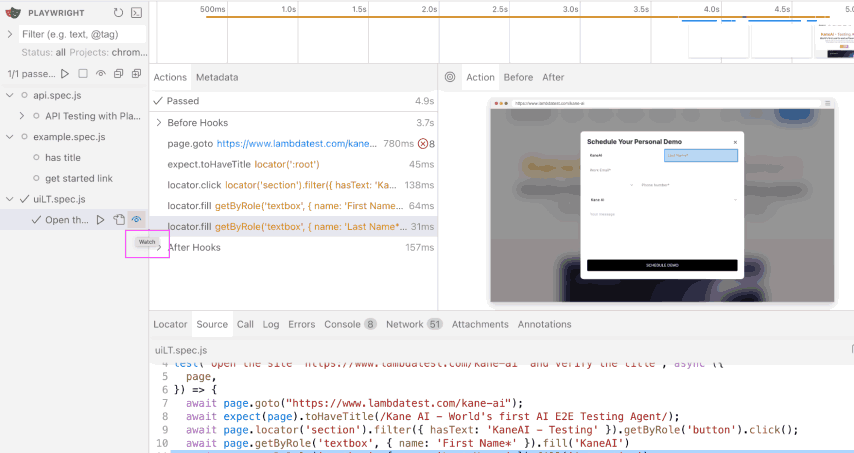
The Watch feature enhances the testing experience by automatically rerunning the test when changes are made to the test file. This eliminates the need for manually re-executing tests after modifications, making the development and debugging process more efficient.
To enable the Watch in Playwright UI mode, simply click on the watch icon next to the specific test case. Once enabled, any changes made to that test file will automatically trigger the test to re-execute.
Source, Call, and Log
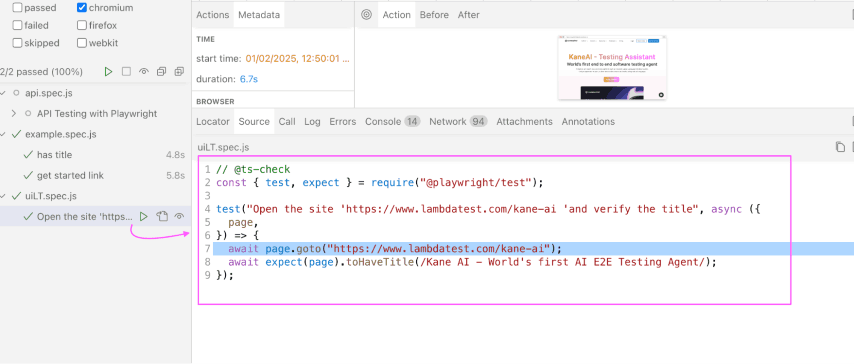
Source
In the Source tab, you can see the source code of the selected test case.
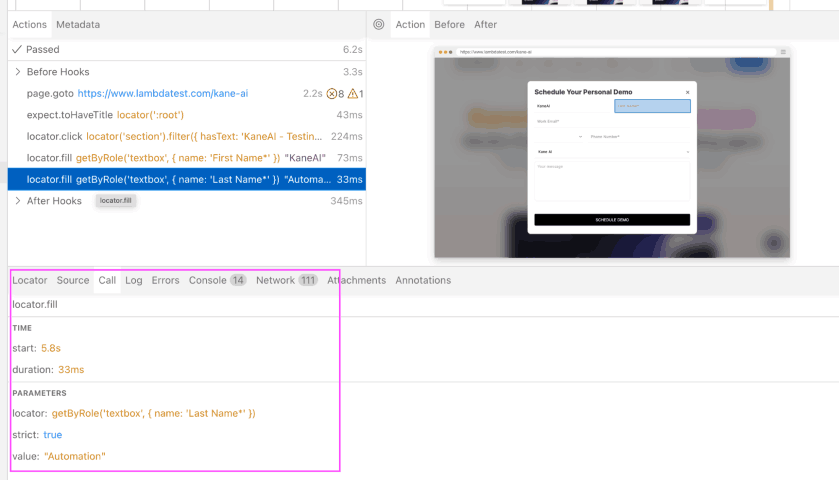
Call
In the Call tab, you can view the details of a particular command, including its start time, the time it takes to complete and other parameters.
Log
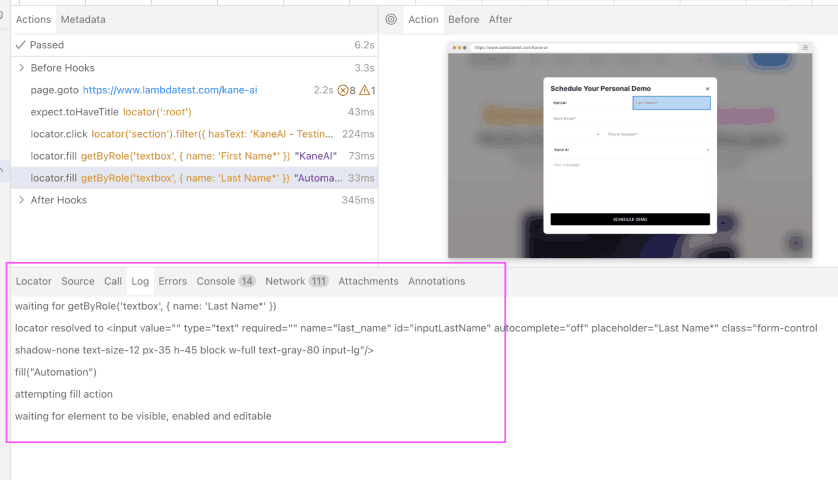
The Log tab provides the execution of the particular command in detail.
In the below screenshot, you can see the command is attempting to fill the “Last Name” field with the value “Automation”. It first waits for the textbox with the role textbox and the name Last Name* to be located.
Once the locator resolves to the correct <input> element, the script attempts to perform the fill action. However, before filling, it ensures that the element is visible, enabled, and editable.
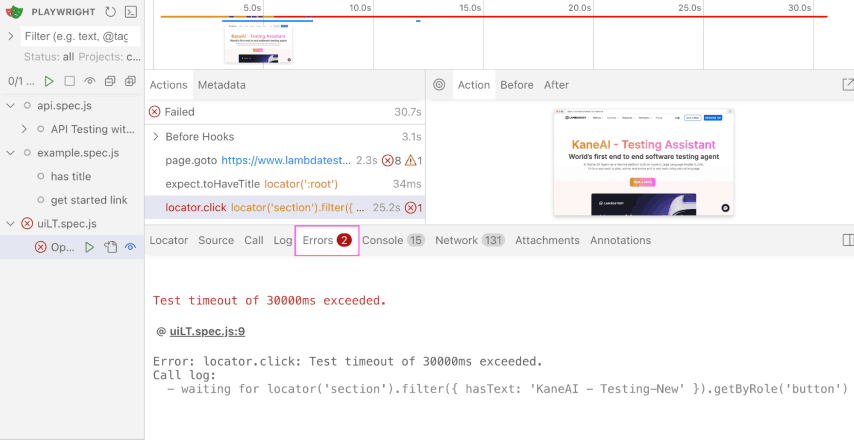
Errors
The Error tab lets you know the reason for test failure. In case any test fails, the Timeline at the top is also highlighted with a red color where the error comes.
Console
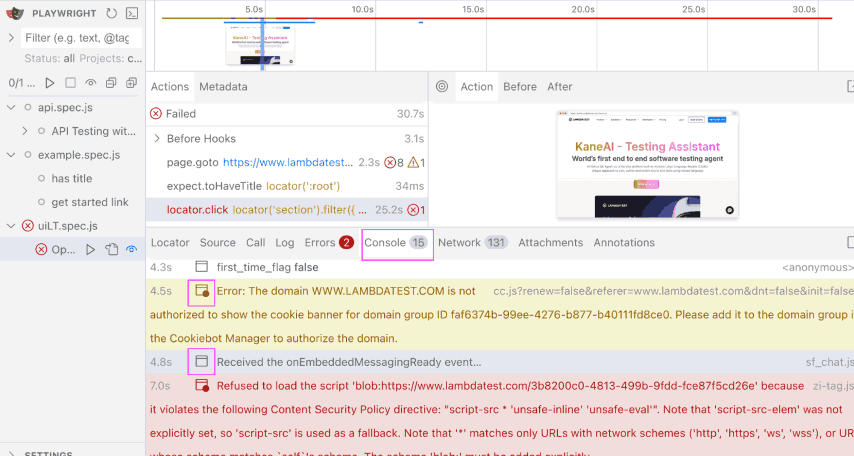
The Console tab shows the log from the test and browser. The icons below indicate whether the console log came from the browser or the test file.
Network
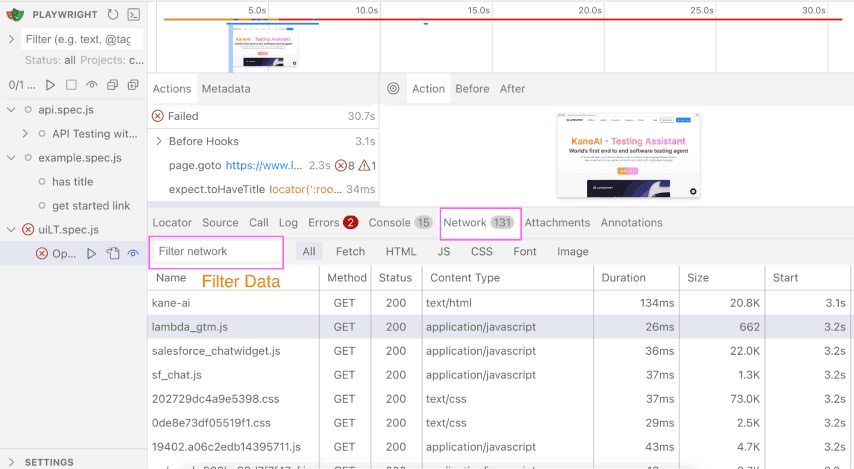
In the Network tab, you can see all the requests made during the test execution. You can filter the network requests and sort them by different types of requests, methods, status codes, content types, sizes and durations.
Attachments
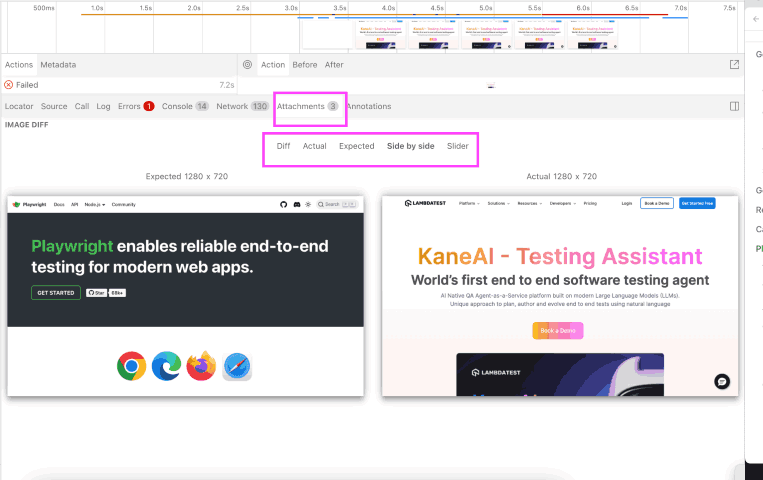
The Attachments tab helps with Playwright screenshot comparison by identifying the difference between the images. By clicking on Diff, you can see the difference between the actual and expected images.
Annotations
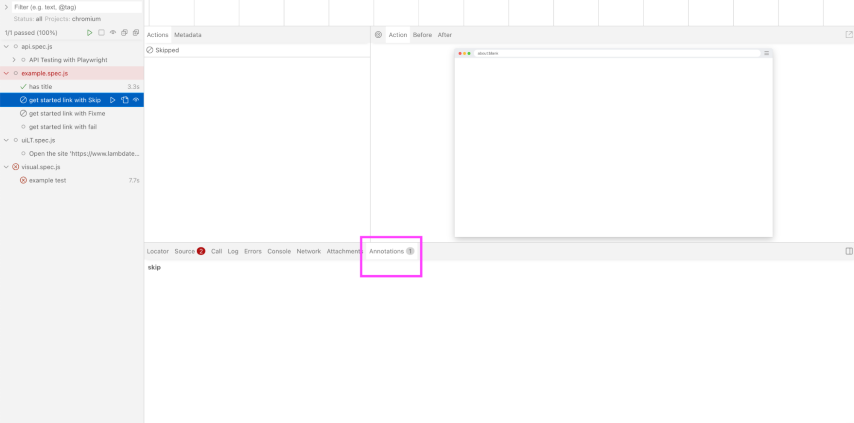
Annotations are special markers that you can add to test suites to change the behavior of the test execution. Any of the tests are marked as test.skip(), test.fail(), test.fixme(), test.slow() will show in the UI mode.
Overall, Playwright UI mode makes debugging tests easier with its interactive interface, but running tests locally has limitations.
However, AI-native test execution platform such as TestMu AI allows you to scale these tests across real browsers and devices on the cloud, ensuring reliable results in different environments—without worrying about infrastructure setup.
To get started, refer to this guide on Playwright testing with TestMu AI.
How Do AI Agents Use Playwright to Debug Browser Tests?
AI coding agents use Playwright MCP, Microsoft's official Model Context Protocol server, to control a real browser and read the same DOM and network data UI mode shows a human.
- A real browser, not a script guess: Playwright MCP runs Chromium, Firefox, or WebKit under the hood and exposes a structured tool surface, so an agent controls the same rendering engine a human test would use, not a simulated DOM.
- Accessibility-tree targeting: the agent reads the page's accessibility tree instead of clicking on pixel coordinates, which is faster, cheaper on tokens, and more deterministic than screenshot-based automation.
- Same debugging data, agent-driven: an agent calling Playwright MCP gets the console output, network requests, and DOM snapshots that a person would otherwise read inside UI mode's Developer Tools panel, but drives the inspection through tool calls instead of clicks.
- When UI mode still wins: a person debugging a flaky selector benefits from the visual Pick Locator and Timeline views in UI mode, while an agent running in CI calls Playwright MCP directly with no GUI, so the two approaches complement each other instead of replacing one another.
Wrapping Up!
With Playwright UI mode, you can fully access automated test functionality without any hindrances. The real-time visual testing framework enhances debugging, improves test reliability, and accelerates test development.
Integrated features such as live test execution monitoring, step-by-step debugging, Trace Viewer, and selector inspection make the test automation process more efficient.
Leveraging Playwright UI mode can optimize test automation workflows, leading to higher test quality and reduced debugging time. This streamlined approach enables you to create more effective test scripts and quickly resolve test failures.
Citations
- Playwright UI mode: https://playwright.dev/docs/test-ui-mode
Author

Kailash Pathak
Blogs: 12


Kailash Pathak is a Senior QA Lead Manager at 3Pillar Global with over 18 years of experience in software testing and automation. He has built scalable automation frameworks using Selenium, Cypress, and Playwright, integrating them with CI/CD pipelines and aligning them with business goals. He is the author of Web Automation Testing Using Playwright, which ranked #1 in Amazon’s “API & Operating Environments” category for six consecutive months. He is a Microsoft MVP (Most Valuable Professional) in Quality Assurance, a LinkedIn “Top QA Voice” with 19,500+ followers, and a core member of TestMu AI Spartans, DZone, and Applitools Ambassador programs. Kailash holds certifications including AWS (CFL), PMI-ACP®, ITIL®, PRINCE2 Practitioner®, and ISTQB. He has delivered 25+ QA talks across conferences and webinars and actively mentors engineers while driving quality strategies, shift-left testing, and continuous improvement.


Frequently asked questions
Did you find this page helpful?
More Related Blogs
TestMu AI forEnterprise
Get access to solutions built on Enterprise
grade security, privacy, & compliance
- Advanced access controls
- Advanced data retention rules
- Advanced Local Testing
- Premium Support options
- Early access to beta features
- Private Slack Channel
- Unlimited Manual Accessibility DevTools Tests