

Power Your Software Testing with AI Agents and Cloud
The Native AI-Agentic Cloud Platform to Supercharge Quality Engineering. Test Intelligently and Ship Faster.


- TestMu AI (Formerly LambdaTest)
- /
- Learning Hub
- /
- Performance Testing: Types, Metrics, Tools & Sample Scripts
Performance Testing: Types, Metrics, Tools & Sample Scripts
Performance testing explained: all 8 types compared, the metrics that matter (p95, p99, error rate), how to set SLO thresholds, plus k6 and JMeter scripts.
Last Updated on:
On This Page
- What Is Performance Testing
- What Performance Testing Measures
- Why Invest in Performance Testing
- What Teams Gain
- Performance Testing in Practice
- What Are the Types
- Testing vs Engineering
- What Causes Poor Performance
- How the Process Works
- Who Is Responsible
- Which Metrics Matter Most
- How Do You Set Thresholds
- When to Conduct Performance Testing
- Why Test in the Cloud
- Performance Testing in CI/CD
- What a Script Looks Like
- Which Tools Are Used
- Best Practices
Performance testing is a non-functional testing technique that checks how an application's speed, stability, and scalability hold up under a defined workload.
The targets are not arbitrary. Jakob Nielsen's three response time limits still set the boundaries: 0.1 seconds feels instant, 1 second holds attention, 10 seconds loses it.
Google's Core Web Vitals draw a similar line under front-end performance, which is why the two disciplines increasingly share thresholds.
By the end of this guide you will be able to pick the right test type, set defensible p95 thresholds, and wire them into CI so regression fails the build.
Overview
What Is the Difference Between Performance Testing and Load Testing?
Load testing is one type of performance testing. Performance testing is the parent discipline covering load, stress, spike, soak, volume, scalability, capacity, and recovery testing.
What Are the Most Common Performance Testing Mistakes?
Four errors account for most failed performance programs:
- Reporting averages: A healthy mean hides the slow tail where real users abandon.
- Undersized environments: Half-scale infrastructure produces numbers you cannot extrapolate to production.
- No pass or fail gate: Measuring without thresholds leaves the verdict to whoever reads the dashboard.
- Testing only before release: Late discovery makes architectural bottlenecks expensive to fix.
What Is Performance Testing
Performance testing is a non-functional technique that subjects an application to a defined workload to measure speed, scalability, and stability, with the goal of locating bottlenecks before release.
The distinction that matters is intent. A performance test is not hunting for defects in logic, it is hunting for the point where the system stops meeting its targets.
Three parameters carry the verdict on any run:
- Stability: whether the application holds steady as the workload changes rather than degrading unpredictably.
- Scalability: the maximum user load the application absorbs while still meeting its response targets.
- Speed: how quickly the application responds, measured across the distribution rather than on average.
What Does Performance Testing Measure
The scope is behavior under load rather than correctness of features. A run evaluates response time, throughput, scalability, resource use, and stability against a workload you define upfront.
That distinction sets the scope. A functional test asks whether checkout completes; a performance test asks whether it still completes in under a second when 5,000 people check out at once.
The output is also different. Functional testing produces a pass or fail per case, while performance testing produces a distribution you interpret against a target.
Three measurement families cover most of what a run reports:
- Speed: how long a request takes, reported as percentiles rather than an average.
- Capacity: how many concurrent users or transactions the system sustains at target speed.
- Stability: whether speed and error rate hold steady as load persists over time.
Skip this and the gap surfaces in production, where a slow application reads to users as a broken one. The business case for avoiding that is the next section.

Note: Ensure your software application's stability, speed, and scalability.Try TestMu AI Now!
Why Invest in Performance Testing
Teams invest in performance testing because latency costs money. Slow pages lose conversions, raise support load, and force emergency infrastructure spend far beyond the cost of testing early.
The argument is easier to fund than most quality work because the loss is measurable. A checkout that degrades under Black Friday load has a revenue number attached to it.
Five reasons carry most of that case:
- Revenue protection: Latency on transactional flows suppresses conversion, and the effect compounds on banking and ecommerce traffic.
- Cheaper fixes: Architectural bottlenecks found before release cost a fraction of what they cost after launch.
- Capacity planning: Testing tells you what your ceiling actually is, so you scale on evidence rather than on guesswork.
- Release confidence: A threshold that fails the build catches regression before a customer reports it.
- Stack validation: Load exposes the weak link, whether that is a query plan, a connection pool, or a downstream API.
Those are the commercial arguments. What changes inside the engineering team is a separate question, covered next.
What Do Engineering Teams Gain From Performance Testing
Engineering teams gain a defensible baseline, faster root-cause analysis, objective release decisions, safer refactoring, and infrastructure sized on measured headroom rather than guesswork.
Five shifts show up consistently once tests run on a schedule:
- A defensible baseline: You gain a documented number for current behavior, so every later change is measured against evidence.
- Faster root cause: Load correlated with resource counters points at the bottleneck instead of prompting a guess.
- Objective release calls: A threshold breach is a fact, which removes the argument about whether a build feels slow.
- Safer refactoring: Engineers change hot paths with confidence because regression surfaces in the next pipeline run.
- Right-sized infrastructure: Measured headroom stops the reflex of over-provisioning to compensate for unknown limits.
The second one matters most in my experience. Teams rarely lack the will to fix slowness; they lack an agreed number that says which of six suspects is guilty.
What Does Performance Testing Look Like in Practice
In practice the shape changes with the constraint. Web applications are usually limited by query latency and caching, while mobile applications are limited by device memory, battery, and network.
Two contexts show the difference clearly:
- Web applications: Load is measured server-side, so the constraint is usually query latency, connection pooling, or cache behavior.
- Mobile applications: The device is part of the system, so memory ceilings, battery drain, and latency matter alongside backend throughput.
Both share a pattern worth noting. The failure mode is rarely a crash, but degradation that sits just inside what users tolerate until it suddenly does not.
What Are the Types of Performance Testing
The eight types are load, stress, spike, endurance, volume, scalability, capacity, and recovery testing. They differ in the shape of load applied and the question that load is meant to answer.
Most teams run the first six regularly. Capacity and recovery testing are usually reserved for capacity planning and disaster-recovery drills.
Use this matrix to pick the right one before you write a single script.
| Type | Question it answers | Load pattern | Typical duration | Primary metric |
|---|---|---|---|---|
| Load testing | Does the system hold up under the traffic we actually expect? | Ramp to expected peak, then hold steady | 30 min to 2 hrs | p95 response time, error rate |
| Stress testing | Where does it break, and how does it break? | Ramp past peak until failure | 30 min to 1 hr | Breaking point, error rate |
| Spike testing | Can it survive a sudden surge with no warning? | Near-instant jump, then drop | 5 to 20 min | Recovery time, error rate |
| Endurance (soak) testing | Does it degrade when the load never stops? | Moderate load held for a long time | 8 to 72 hrs | Memory growth, response time drift |
| Volume testing | Does it slow down as the database grows? | Steady load against large data sets | 1 to 4 hrs | Query latency, throughput |
| Scalability testing | Does adding resources actually buy us headroom? | Stepped load across resource tiers | 2 to 6 hrs | Throughput per node, cost per request |
| Capacity testing | How many users can we support before we must scale? | Incremental steps to a target ceiling | 2 to 8 hrs | Max concurrent users at target SLO |
| Recovery (reliability) testing | After it falls over, does it come back on its own? | Induced failure, then observation | 1 to 3 hrs | Time to recovery, data integrity |
Each type is covered in detail below:
- Scalability testing: Raises load across resource tiers to confirm the application scales up rather than merely surviving.
- Volume testing: Populates the database heavily, then measures how query latency degrades as stored data grows.
Take a messaging app as an example. Volume testing might simulate 10,000 users exchanging messages against a database already holding millions of records.
- Spike testing: Applies a sudden surge with no ramp, then measures how quickly the system recovers afterwards.
- Endurance testing: Holds a moderate load for hours or days to expose memory leaks and resource exhaustion.
- Stress testing: Pushes past expected peak until the system fails, to find the breaking point deliberately.
A stress run should answer four questions:
- At what load does the system stop meeting its targets?
- How does it fail, gracefully or catastrophically?
- Does it recover on its own once load drops?
- Which component gives way first under unexpected load?
- Load testing: Validates behavior under expected traffic, surfacing bottlenecks before the application reaches production.
A load run should answer three questions:
- At what load does behavior shift from predictable to erratic?
- At what data volume does throughput start to fall away?
- Are any of the delays attributable to the network rather than the application?
- Capacity testing: Establishes how many users the system supports at target performance, tuning disk, memory, and bandwidth.
A capacity run should answer three questions:
- Can the current environment absorb projected future load?
- Where is the ceiling on the infrastructure as configured today?
- Which additional resources would raise that ceiling most cheaply?
- Recovery or reliability testing: Induces failure deliberately, then measures whether the system returns to normal and how long that takes.
Consider a trading platform that fails at peak and stays down for two hours. If it restores itself without intervention, it is recoverable; the two hours is the metric that matters.
How Does Performance Testing Differ From Performance Engineering
Both roles consume the same results but act on them differently. A test engineer reports where targets are missed, while a performance engineering specialist reshapes the design itself.
A performance test engineer measures response times under a given load and reports where the targets are missed.
A performance engineer asks why that number is what it is, and changes the design so it improves. One measures the system, the other shapes it.
| Aspects | Performance Testing | Performance Engineering |
|---|---|---|
| Definition | Creation and execution of test cases by performance test engineers | Active involvement of performance engineers throughout SDLC |
| Focus | Bugs and bottleneck identification, analysis reports for developers | Elevating performance concerns, meeting business case requirements |
| Tools | Uses various tools, may not require coding skills | Involves best practices and requires programming skills |
| Load Handling | Determines if a website can sustain a given load with baseline performance | Systems constructed for high performance, surpassing expectations |
| Timing of Activity | Typically conducted after a software development round | Ongoing process integrated throughout all SDLC stages |
| Goal | Assess the application's ability to manage loads and respond promptly | Incorporates performance metrics into the design for early issue detection |
| QA Team Involvement | Involves in executing performance testing | Involves in both Research and Development (RND) and QA teams |
What Causes Poor Performance
Poor performance traces to four causes: resource bottlenecks in code or hardware, architecture that will not scale out, slow server response, and heavy front-end payloads that delay render.
Each leaves a different signature in your metrics, which is what makes diagnosis tractable. The four break down as follows:
- Bottlenecks: A single constrained resource caps throughput, usually a query plan, connection pool, disk, memory, or CPU.
The fix is to find the constrained resource rather than to add hardware everywhere. Adding capacity around a bottleneck moves cost without moving the ceiling.
- Poor scalability: The system holds at low load but degrades sharply as users climb, exposing shared state or locking.
- Poor response time: The interval between request and response stretches past what users tolerate, and attention drops sharply beyond a second.
- Long load time: The initial time to start or first render runs long, usually from oversized payloads or blocking resources.
Each of these issues has a different signature in your metrics, which is why the process below starts with deciding what to measure rather than which tool to install.
How Does the Performance Testing Process Work
The process runs from requirement analysis and a tooling proof of concept, through planning, scripting, load modeling and execution, to analysis and a report the development team can act on.
The diagram below shows how those stages connect.
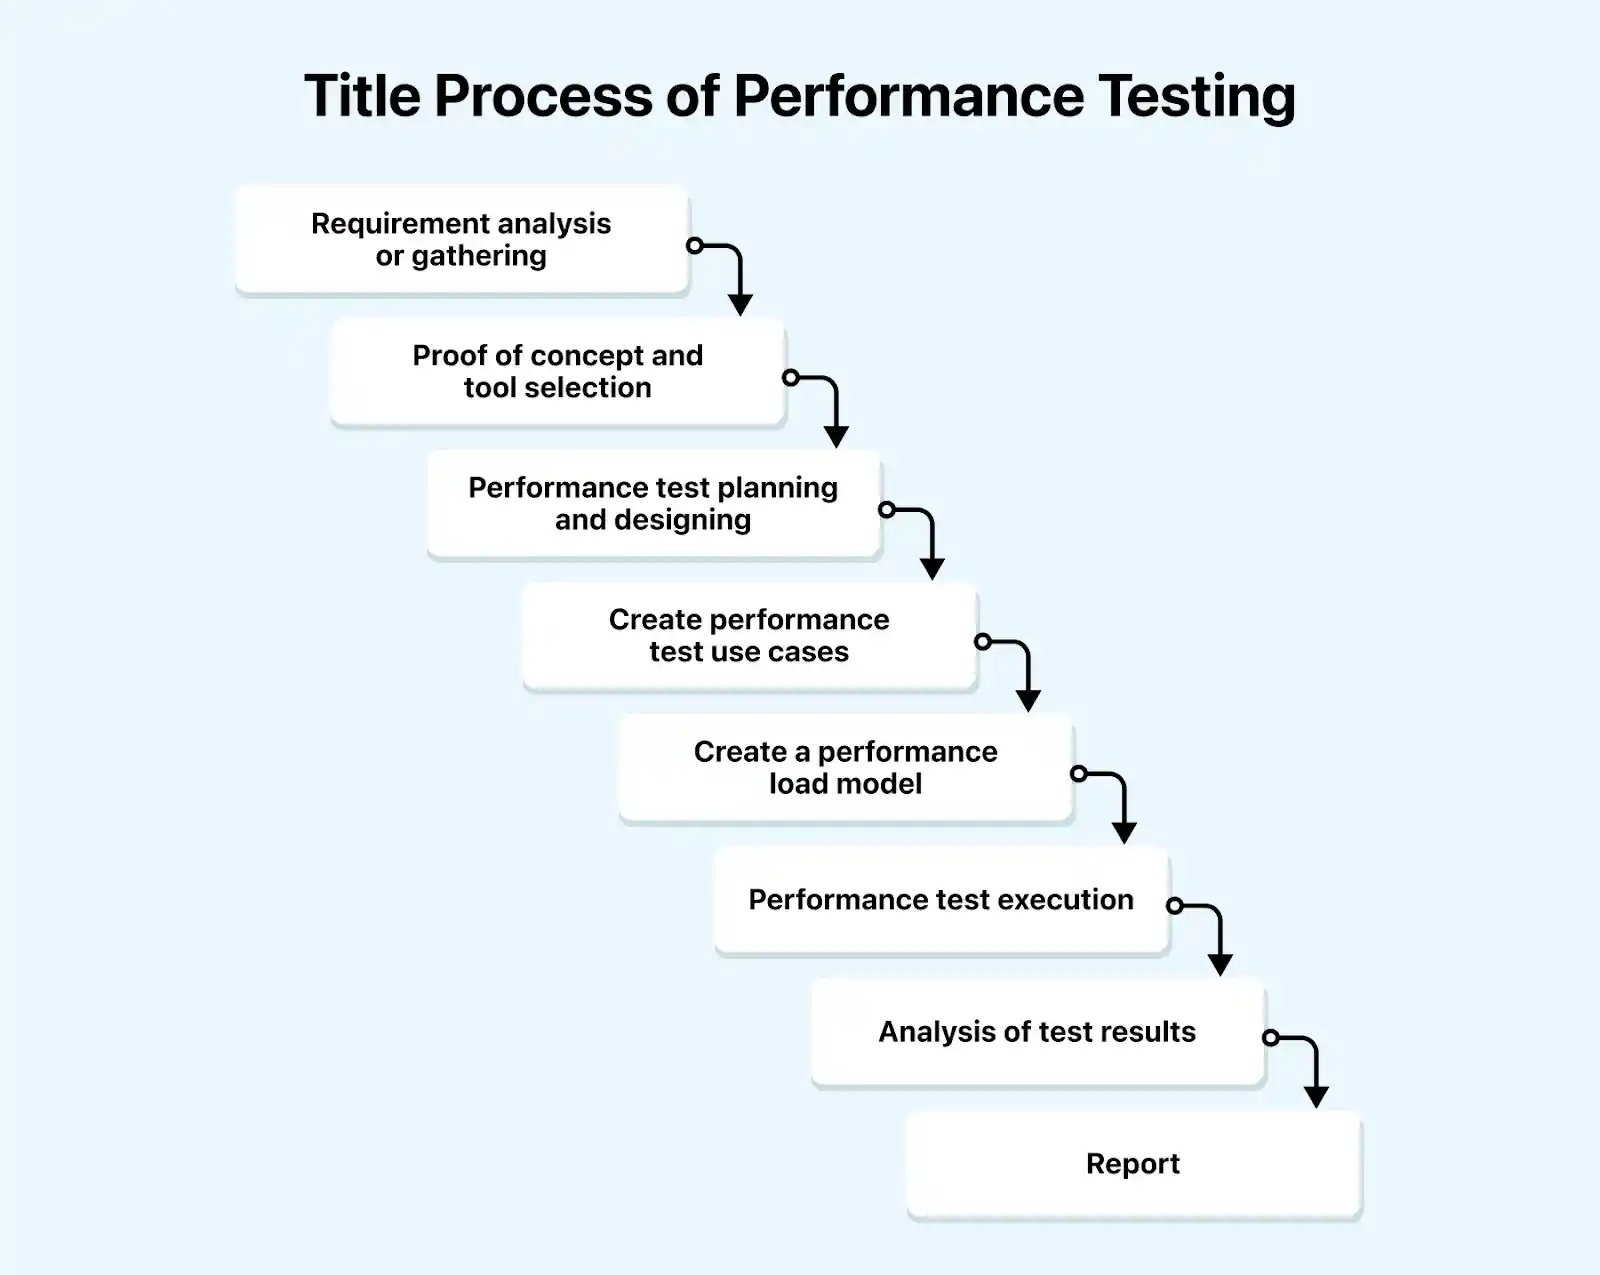
Each stage breaks down as follows:
- Requirement analysis: Gather technical and business requirements, covering hardware, usage patterns, intended users, database, and architecture.
- Proof of concept and tool selection: Identify critical functionality, then trial candidate tools against cost, protocol support, and expected user count.
Build scripts for the proof of concept around essential functionality only, then execute with 10 to 15 virtual users to validate the approach cheaply.
- Planning and design: Turn requirements into a test plan covering environment, workload, and hardware.
- Create test use cases: Write use cases for key functionality, secure sign-off, then begin script development against them.
Use the performance test tools to extend those scripts with custom functions, parameterization, and correlation for dynamic values.
Validate each script across user profiles while the environment is provisioned in parallel, since environment setup is usually the longer lead time.
- Create a load model: Model expected concurrency and think time, commonly using Little's Law to relate throughput and users.
- Test execution: Ramp load in increments rather than jumping to peak, so you see where the curve bends.
- Analysis of test results: Give every run a unique, meaningful name, then compare it against the previous run rather than reading it in isolation.
A useful run summary records the test goal, virtual-user count, duration, throughput, response-time percentiles, errors encountered, and any change to the environment since the last run.
Conclusions come from several runs, never one. A single result tells you what happened once; a trend tells you what is true.
- Report: Present a clear conclusion with the reasoning behind it, since developers need the analysis path, not just the verdict.
Now that we have learned about the process of performing testing, we will learn the various responsibilities of the performance testing team in the section below.
Who Is Responsible for Performance Testing
A performance test lead owns requirements, strategy, and sign-off on deliverables. A performance tester builds the scripts, executes runs, and submits results. On smaller teams one engineer does both.
Performance test lead:
- Procuring the performance requirements.
- Analyzing the performance requirements.
- Drafting the requirements and signing them off.
- Drafting the strategies and signing them off.
- Participating in the reviews of the deliverables.
Performance tester:
- Developing the performance test scripts for the identified scenarios.
- Conduct the performance test.
- Submitting the test results.
Validating performance means validating it against numbers, the same discipline applied to software testing metrics. The metrics that carry the signal are covered next.
Which Metrics Matter Most in Performance Testing
Six metrics carry almost all of the signal: p50, p95, and p99 response time, error rate, throughput, and resource saturation. Everything else is diagnostic detail you reach for once one goes red.
The starting targets below are common defaults for a typical web API, not universal truths. Treat them as a first draft to tighten against your own data.
A search endpoint and a checkout endpoint should never share a threshold, because the user's tolerance for each is different.
| Metric | What it measures | Common starting target |
|---|---|---|
| p50 (median) response time | The experience of your typical user | Under 200 ms |
| p95 response time | The experience of your slower 5% of requests | Under 500 ms |
| p99 response time | The tail, where timeouts and abandonment live | Under 1 second |
| Error rate | Share of requests that fail or time out under load | Under 1% |
| Throughput (RPS / TPS) | Requests or transactions handled per second | At or above projected peak |
| Resource saturation | CPU, memory, and I/O headroom while under load | Under 70% to 80% at steady state |
Why percentiles and not averages? Because averages hide the slow tail. A 200 ms average can conceal 5% of requests taking four seconds, and those requests belong to real users who are watching a spinner.
Reporting a mean makes a system look healthy precisely when its worst-served users are leaving. Report p95 and p99, and only use the average as a sanity check.
Some teams also track Apdex, which collapses response times into a single satisfaction score between zero and one against a target threshold.
It reports well to stakeholders but is no substitute for the percentile detail engineers need to debug.
Resource-level counters. Once a headline metric breaches its target, these are the counters you drill into to find out why.
You do not need to watch them all on every run. Reach for the ones below once a headline metric goes red:
- Garbage collection: It involves evaluating unused memory and returning it to the system to increase the application’s efficiency.
- Thread counts: It helps determine the count of running and active threads, indicating the software application's health.
- Top waits: Identifies the wait times worth reducing, usually tied to how fast data is retrieved from memory.
- Database locks: This implies that the databases and tables are monitored and tuned carefully.
- Rollback segment: It determines the volume of data that can roll back at a specific time.
- Hits per second: The count of hits on a web server per second is provided during the load testing.
- Hit ratios: It involves the count of SQL statements managed by the cache data in place of the costly input/output operations.
- Maximum active sessions: It renders the maximum count of sessions that can be active simultaneously.
- Connection pooling: The share of requests served by pooled connections, which correlates closely with sustained throughput.
- Throughput monitoring: It provides the rate at which the network or the computer receives requests per second.
- Response time monitoring: Time from request entry to the first character of the response returning.
- Network bytes per second: Rate of bytes sent and received on the interface, including framing characters.
- Network output queue length: Packets queued for output. A length above two signals delay worth investigating.
- Disk queue length: It provides the average count of read and write requests queued for the selected disk during a sample interval.
- CPU interrupts per second: It monitors and renders the average count of hardware interrupts a processor receives and processes per second.
- Page faults/second: It returns the overall rate at which the processor processes the fault pages.
- Memory pages/second: This offers the count of pages the system reads from or writes to the disk to resolve complex page faults.
- Committed memory: It provides the volume of the used virtual memory.
- Private bytes: Non-shareable bytes allocated by a process, the primary signal when hunting a memory leak.
- Bandwidth: It renders the bits per second used by a network interface.
- Disk time: This displays when the disk executes a write or read request.
- Memory use: It reduces the number of physical memory processes used on a computer.
- Processor usage: It displays the time the processor executes non-idle threads.
Collecting these counters only pays off once you attach numbers to them, which is what the next section covers.
How Do You Set Performance Thresholds
Set thresholds from real production baselines rather than aspirations. Pull the current p95 and p99 per endpoint, gate slightly below those numbers, and fail the build when the budget is breached.
Without them a test is only a measurement. Someone still has to read a dashboard and decide whether the run was acceptable, so the verdict shifts with whoever is looking.
Thresholds convert that judgment call into a pass or fail the pipeline enforces. Three terms are worth separating first:
- SLI (Service Level Indicator): the thing you measure. "p95 response time on the checkout endpoint."
- SLO (Service Level Objective): the target you hold that measurement to. "p95 under 500 ms for 99% of the month."
- SLA (Service Level Agreement): the contractual promise to a customer, with financial consequences attached if you miss it.
A practical way to derive your first set of thresholds:
- Start from real user data: Pull the current p95 and p99 per critical endpoint from your APM or access logs.
- Gate at or just below baseline: A threshold in CI catches regression; it should not encode an aspiration you have never met.
- Set thresholds per endpoint: A report generator and a login call have genuinely different budgets.
- Add an error budget: Fail when an agreed share of requests breach the target, not on a single slow outlier.
- Fail the build on breach: A threshold nobody enforces is a comment. k6 exits non-zero, which makes enforcement automatic.
The second point is where most teams go wrong. I have watched an aspirational p95 gate get commented out within a fortnight because it failed every build, and a muted gate protects nothing.
The one anti-pattern worth naming: setting a threshold on the average. Averages can stay inside budget while the p99 doubles, so an average-based gate will happily pass the exact regression you built it to catch.
The next sections show what these thresholds look like in a real script.

When to Conduct Performance Testing
Start performance testing as soon as a component is testable, then run it continuously. The cost of fixing a performance defect rises sharply the later in the lifecycle it is found.
The reason is architectural. A logic bug is usually a local fix, while a performance defect often traces to a design decision that is expensive to unwind once built on.
Run these tests throughout the software development life cycle rather than as a pre-release gate. Issues found in production hit retention and acquisition cost directly.
Those effects show up in the key performance indicators the business already tracks, which is what makes late discovery costly.
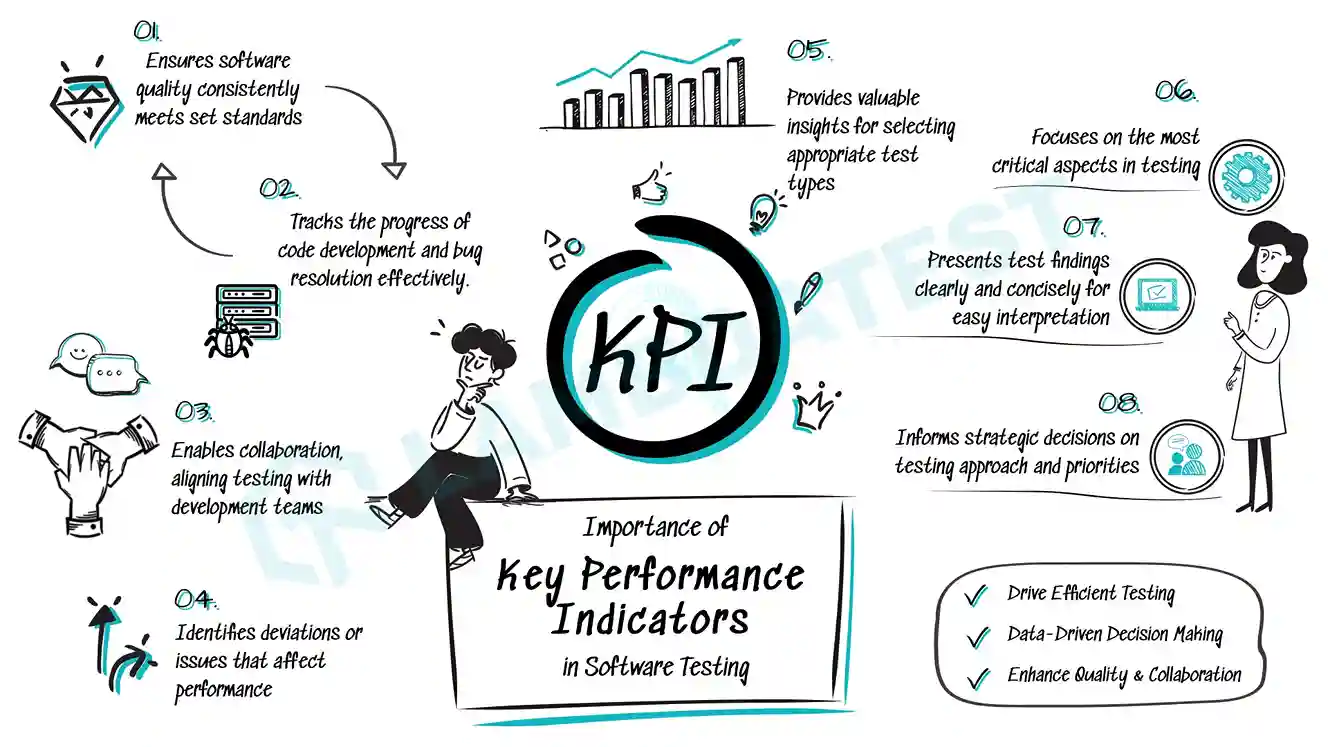
Integrate performance tests throughout development to cover web services, microservices, and APIs. As the application takes shape, these runs belong in the regular testing routine rather than in a separate phase.
Sequencing matters here. Run performance tests once functional testing is stable, because chasing a slow response that turns out to be a logic bug wastes a full cycle.
Why Run Performance Tests in the Cloud
Replicating peak workloads takes hardware. On-premise load generation means buying and maintaining machines that sit idle between test cycles, which is why most teams move this workload to the cloud.
Two constraints decide whether a cloud run produces usable numbers.
The first is the target environment. Mirror production, including firewalls, load balancers, and TLS termination, because a half-sized environment gives you numbers you cannot safely extrapolate from.
The second is the load generator. A single machine running JMeter saturates its own CPU long before it saturates a production-sized service, and at that point you are measuring your laptop.
I lost the better part of a day to exactly that once, chasing a plateau in the results before thinking to check the generator's own CPU graph.
Distributing generation across cloud workers in more than one region removes that ceiling and lets you model geographically spread traffic. This approach is covered further in our cloud testing tutorial.
TestMu AI's cloud performance testing runs existing JMeter and Gatling suites on a managed cloud grid, so you scale virtual users without provisioning your own load-generator fleet.
What it removes is the idle hardware between test cycles and the manual correlation work between load and system health.
Four capabilities matter most for performance workloads:
- Bring your own scripts: Existing .jmx and Gatling suites run unchanged, so there is no rewrite cost to migrate.
- Distributed generation: Load originates from multiple regions, which models real traffic geography instead of one office IP.
- On-demand concurrency: Virtual-user counts scale per run, so you pay for peak tests rather than idle capacity.
- Correlated reporting: Response-time percentiles sit alongside resource counters, which shortens the path from breach to root cause.
Setup details are in the HyperExecute performance testing documentation.
Tooling diversity is the norm rather than the exception. According to the Future of Quality Assurance survey, 74.6% of organizations use two or more frameworks, and 38.6% use more than three.
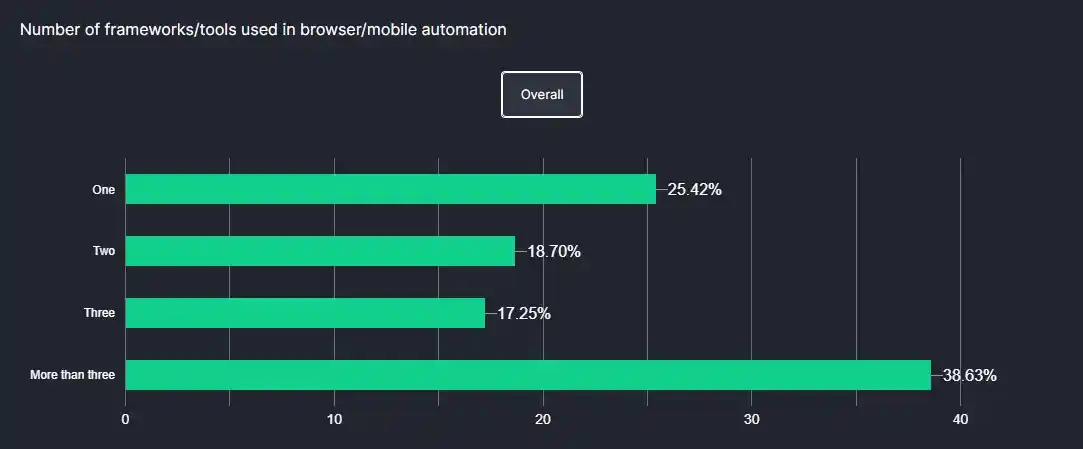
That spread is why grid compatibility matters more than any single feature. A platform that only runs one tool forces you to abandon suites you already trust.
The video below walks through the platform in more detail.

You can subscribe to the TestMu AI YouTube Channel for walkthroughs on running and scaling test suites.
How to Run Performance Tests in CI/CD
Run performance tests in CI by splitting them into tiers: a short smoke test on every pull request, a full load test nightly, and a soak test weekly against a production-like environment.
The lifecycle process above describes a full engagement. This section covers the narrower problem of keeping performance from regressing between those engagements.
The reason tiering matters is cost. A twenty-minute load test on every commit will be disabled within a fortnight, so match test duration to how often the trigger fires.
| Tier | Trigger | Duration | Gate behavior |
|---|---|---|---|
| Smoke | Every pull request | 2 to 3 minutes | Fail the build on threshold breach |
| Load | Nightly on main | 20 to 40 minutes | Fail and alert the owning team |
| Soak | Weekly or pre-release | 8 hours or more | Report only, review memory trend |
Four practices keep the pipeline honest:
- Version the test with the code: An endpoint change and its test update land in the same pull request.
- Pin the environment: Shared staging under someone else's load produces noise rather than signal.
- Compare against a stored baseline: Absolute thresholds catch cliffs; trend comparison catches slow creep.
- Quarantine flaky gates fast: A gate failing for infrastructure reasons trains the team to ignore it.
Pinning the environment is the one I would fight hardest for. Nightly runs against shared staging generate failures nobody can reproduce, and an unreproducible failure teaches the team to ignore the suite.
What Does a Performance Test Script Look Like
A performance test script defines a load profile and a pass or fail gate. The k6 and JMeter examples below apply the same ramp, then fail the run automatically when the percentile budget is breached.
k6. Thresholds are declared in the options block. A breach exits non-zero, which is what lets CI fail the build with no extra glue code. The k6 thresholds documentation covers the full syntax.
import http from 'k6/http';
import { check, sleep } from 'k6';

// Thresholds are the pass/fail gate. If any is breached,
// k6 exits non-zero and the CI pipeline fails.
export const options = {
  stages: [
    { duration: '2m', target: 100 },  // ramp up
    { duration: '5m', target: 100 },  // hold at steady state
    { duration: '2m', target: 0 },    // ramp down
  ],
  thresholds: {
    http_req_duration: ['p(95)<500', 'p(99)<1000'],
    http_req_failed: ['rate<0.01'],   // error rate under 1%
    http_reqs: ['rate>50'],           // sustain 50+ requests/sec
  },
};

export default function () {
  const res = http.get('https://example.com/api/products');
  check(res, {
    'status is 200': (r) => r.status === 200,
    'body is not empty': (r) => r.body.length > 0,
  });
  sleep(1);
}
JMeter. JMeter expresses the same gate through assertions attached to a sampler. The XML below shows Duration and Response assertions as they appear in a .jmx file.
<!-- Duration Assertion: fail any sample slower than 500 ms -->
<DurationAssertion guiclass="DurationAssertionGui"
                   testclass="DurationAssertion"
                   testname="p95 budget - 500ms" enabled="true">
  <stringProp name="DurationAssertion.duration">500</stringProp>
</DurationAssertion>

<!-- Response Assertion: fail anything that is not HTTP 200 -->
<ResponseAssertion guiclass="AssertionGui"
                   testclass="ResponseAssertion"
                   testname="Status is 200" enabled="true">
  <collectionProp name="Asserion.test_strings">
    <stringProp name="49586">200</stringProp>
  </collectionProp>
  <stringProp name="Assertion.test_field">Assertion.response_code</stringProp>
  <intProp name="Assertion.test_type">8</intProp>
</ResponseAssertion>
You add these through the GUI in practice and commit the resulting file, rather than hand-editing XML.
One caveat matters here. A JMeter Duration Assertion fires per sample, so a single slow outlier fails the whole run.
For error-budget behavior instead, assert on the aggregate report in your pipeline step rather than on individual samples.
Which Tools Are Used for Performance Testing
The main tools are k6, Gatling, JMeter, Locust, and Artillery. Choice depends on your team language, the protocols you must cover, and whether developers or a dedicated team own the suite.
Those are the language your team already writes, the protocols you must cover, and whether developers or a dedicated performance team will own the suite.
| Tool | Best for | Scripting in | License |
|---|---|---|---|
| Grafana k6 | Developer-owned tests wired into CI | JavaScript | Open source |
| Gatling | JVM teams wanting expressive scenarios | Scala, Java, Kotlin | Open source + commercial |
| Apache JMeter | Protocol-heavy enterprise suites | GUI / XML, Groovy | Open source |
| Locust | Python teams and custom protocols | Python | Open source |
| Artillery | Node.js and serverless workloads | YAML, JavaScript | Open source + commercial |
| LoadRunner | Legacy enterprise protocols (SAP, Citrix, mainframe) | C-like scripting | Commercial |
| WebLOAD | Large enterprise suites with heavy reporting needs | JavaScript | Commercial |
A few notes that the table cannot carry:
- k6 and Gatling suit new projects. Both keep tests as code beside the application, so they get reviewed and versioned normally.
- JMeter casts the widest protocol net. For JDBC, JMS, LDAP, or FTP in one suite, it remains the pragmatic answer.
- LoadRunner is a legacy-protocol play. It earns its license cost driving SAP, Citrix, or mainframe traffic that open-source tools cannot speak.
- WebLOAD by RadView targets large enterprise suites needing heavy reporting. Learn more about this performance testing software.
- Pair the generator with observability. This is the step teams most often skip, and it is what separates detection from diagnosis.
That last point deserves emphasis. A load tool reports that a request took 900 ms, while an APM such as Datadog, New Relic, or Grafana names the query that consumed them.
For a wider comparison across the category, browse the full roundup of performance testing tools and match features against your project needs.
Whichever you pick, the deciding constraint is usually where the load originates rather than which tool authored it. Local runs cap out on your own hardware.
JMeter itself runs free locally. To scale .jmx suites across a managed grid, see the JMeter performance testing pricing plan for tier options.
Note: Set your p95 thresholds once and let every pipeline run enforce them.Book a TestMu AI demo
What Are the Best Practices for Performance Testing
Best practices divide across four stages. Derive scenarios from real logs, name transactions after business flows, run against production-sized infrastructure, and add counters around the bottleneck.
Each stage has one mistake that accounts for most wasted effort:
- Planning: Derive scenarios from server logs rather than assumption, and model the workflows your users actually hit most often.
Build the profile in tiers, moving from light to medium to peak usage, so you can see where the curve bends rather than only whether it broke.
Decide the duration up front. Longer runs of eight hours or more surface the defects short tests never reach, particularly memory leaks and connection exhaustion.
If an APM is available, run it during the test. Correlating load with system health is what turns a slow number into a diagnosed cause.
- Development: Name transactions after the business flows in your plan, so a failure report points at checkout rather than at request 47.
Never record third-party domains into a script. If they slip in during capture, filter them out before the suite runs, or you will load-test someone else's infrastructure.
Autocorrelation handles most dynamic values but not all. Verify the ones it misses manually, because a stale token produces failures that look like performance defects.
- Execution: Run against an environment that matches production, including firewalls, load balancers, and TLS termination.
Testing at half the size of production is the most common shortcut here, and it is the one that most reliably produces wrong conclusions. Scaling results from a half-sized environment assumes linearity that rarely holds.
Match the workload shape to reality too. Check server logs for an existing application, or agree the expected mix with the business team for a new one.
On long runs, check the test intermittently rather than only at the end. A run that failed in hour two wastes the remaining six.
- Analysis: Start with few counters and add more only around the bottleneck once one appears, rather than collecting everything at once.
Failure has several signatures. An application may respond slowly, return an error code, fail validation, or stop responding entirely, and each points somewhere different.

Conclusion
Most performance testing programs fail for the same two reasons. The first is running the wrong type of test for the question being asked.
The second is measuring without deciding in advance what counts as a failure, which leaves the verdict to whoever happens to read the dashboard.
If you take one thing from this guide, take this. Pick your critical endpoints, pull their current p95 and p99 from production, and write those numbers into your test as thresholds.
Then let the pipeline fail on breach. That single change turns performance from a pre-release ritual into a regression gate that holds every day.
From there, deepen coverage in the order your risk demands. Start with load testing for expected traffic, then move to stress and scalability work once you need to prove that adding capacity buys real headroom.
Author

Nazneen Ahmad
Blogs: 39


Nazneen Ahmad is a freelance Technical Content SEO Writer with over 6 years of experience in crafting high ranking content on software testing, web development, and medical case studies. She has written 60+ technical blogs, including 50+ top-ranking articles focused on software testing and web development. Certified in Automation Basic and Advanced Training - XO 10, she blends subject knowledge with SEO strategies to create user focused, authoritative content. Over time, she has shifted from quick, keyword-heavy drafts to producing content that prioritizes user intent, readability, and topical authority to deliver lasting value.


Performance Testing FAQs
Did you find this page helpful?
More Related Learning Hubs
TestMu AI forEnterprise
Get access to solutions built on Enterprise
grade security, privacy, & compliance
- Advanced access controls
- Advanced data retention rules
- Advanced Local Testing
- Premium Support options
- Early access to beta features
- Private Slack Channel
- Unlimited Manual Accessibility DevTools Tests