

Next-Gen App & Browser Testing Cloud
Trusted by 2 Mn+ QAs & Devs to accelerate their release cycles


- TestMu AI (Formerly LambdaTest)
- /
- Blog
- /
- June'26 Updates
June'26 Updates: iOS 27, macOS Golden Gate & KaneAI Test Runs
What's new at TestMu AI in June: iOS 27 and macOS Golden Gate on Day 0, KaneAI's new Test Run instance view, SmartUI A/B baselines, plus Real Device, App Automation, Test Manager and Insights updates.

Saniya Gazala
Author

Salman Khan
Reviewer
Last Updated on:
Last month comes down to two things: testing on the platforms your users just upgraded to, and seeing exactly what happened when a test runs.
iOS 27 and macOS Golden Gate both landed on TestMu AI on Day 0, so you can start testing the moment your users update. And KaneAI's new Test Run instance view replays every automation step, screenshot by screenshot, so a failure tells you where it broke and why.
Around those, SmartUI cuts down false failures with A/B baselines, real devices pick up custom clocks and live app profiling, and App Automation, Test Manager, and Insights all make results easier to act on. Here's everything that shipped.
KaneAI: A New Test Run Instance View, Container Scrolling, and Code Validation
If you author tests in KaneAI, June is about closing the loop between authoring and debugging, with a few niceties for mobile and CI along the way.
Replay Automation Steps in the New Test Run Instance View
When an automated test fails, you want to see the exact step that broke, not dig through logs. Test Runs now have a new instance view that replays your automation in the same format you authored it, with auto-heal visible at every step.
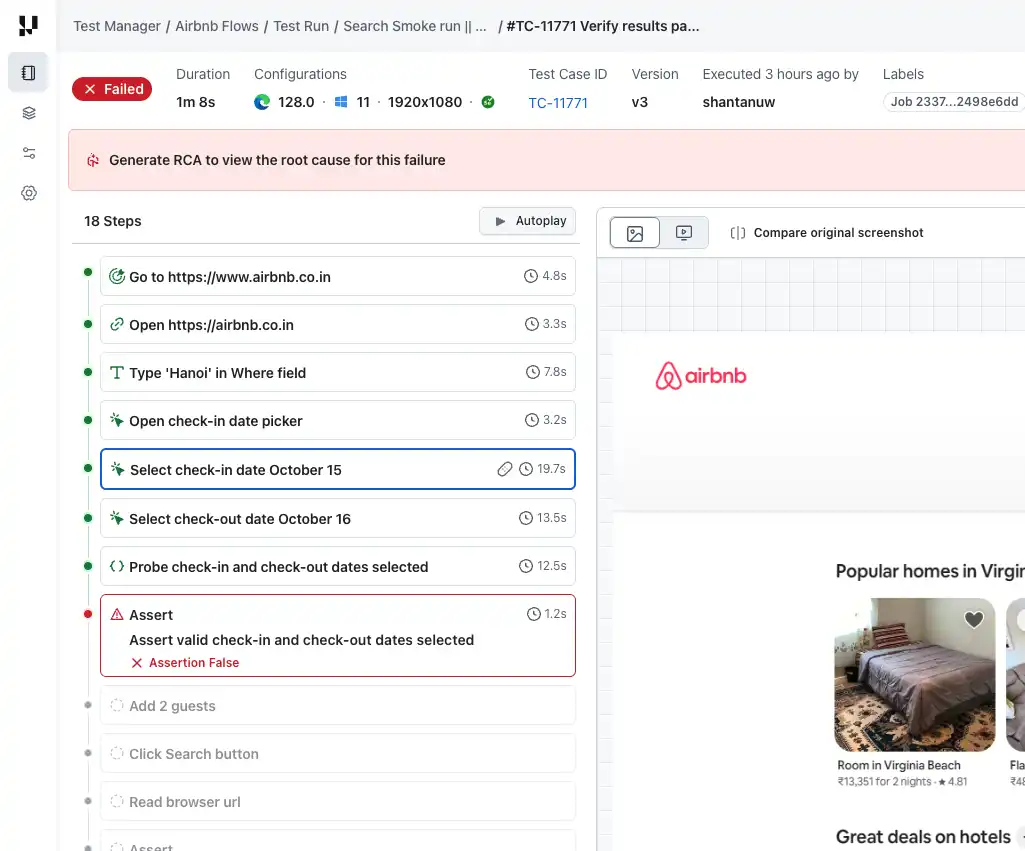
- Autoplay: Step through a screenshot-based slideshow of the run, with a pointer showing where each action landed.
- Test case version: See the exact version the run executed on, plus a bottom quick-navigation bar to hover and jump between steps.
- Logs on demand: Open command logs (in sync with each step), network logs, and HyperExecute terminal logs right from the view.
- Screenshot compare: Put the authoring screenshot next to the execution one, step by step, to spot what changed.
- Share: Create a public link to the instance view or attach it directly to Jira.
Next time a run fails, start here: the Test Run instance view.
Scroll to Elements Inside Containers on Mobile
Not every scroll is a full-screen scroll. The KaneAI mobile app now scrolls until an element appears inside a specific container, and handles horizontal scroll, all authored in natural language.
- Scroll inside containers: Scroll until a target element appears within a specific scrollable container, not just the full screen.
- Horizontal scroll: Author horizontal scroll steps for carousels, tab strips, and side-scrolling lists.
On your next mobile test, just describe it, and KaneAI handles the scroll until an element step for you.
Edit Advanced Settings on an Existing KaneAI Test Case
Authored a test and realized the config was off? You can now edit the advanced settings of an existing KaneAI test case straight from the Test Summary page, no need to rebuild it from scratch.
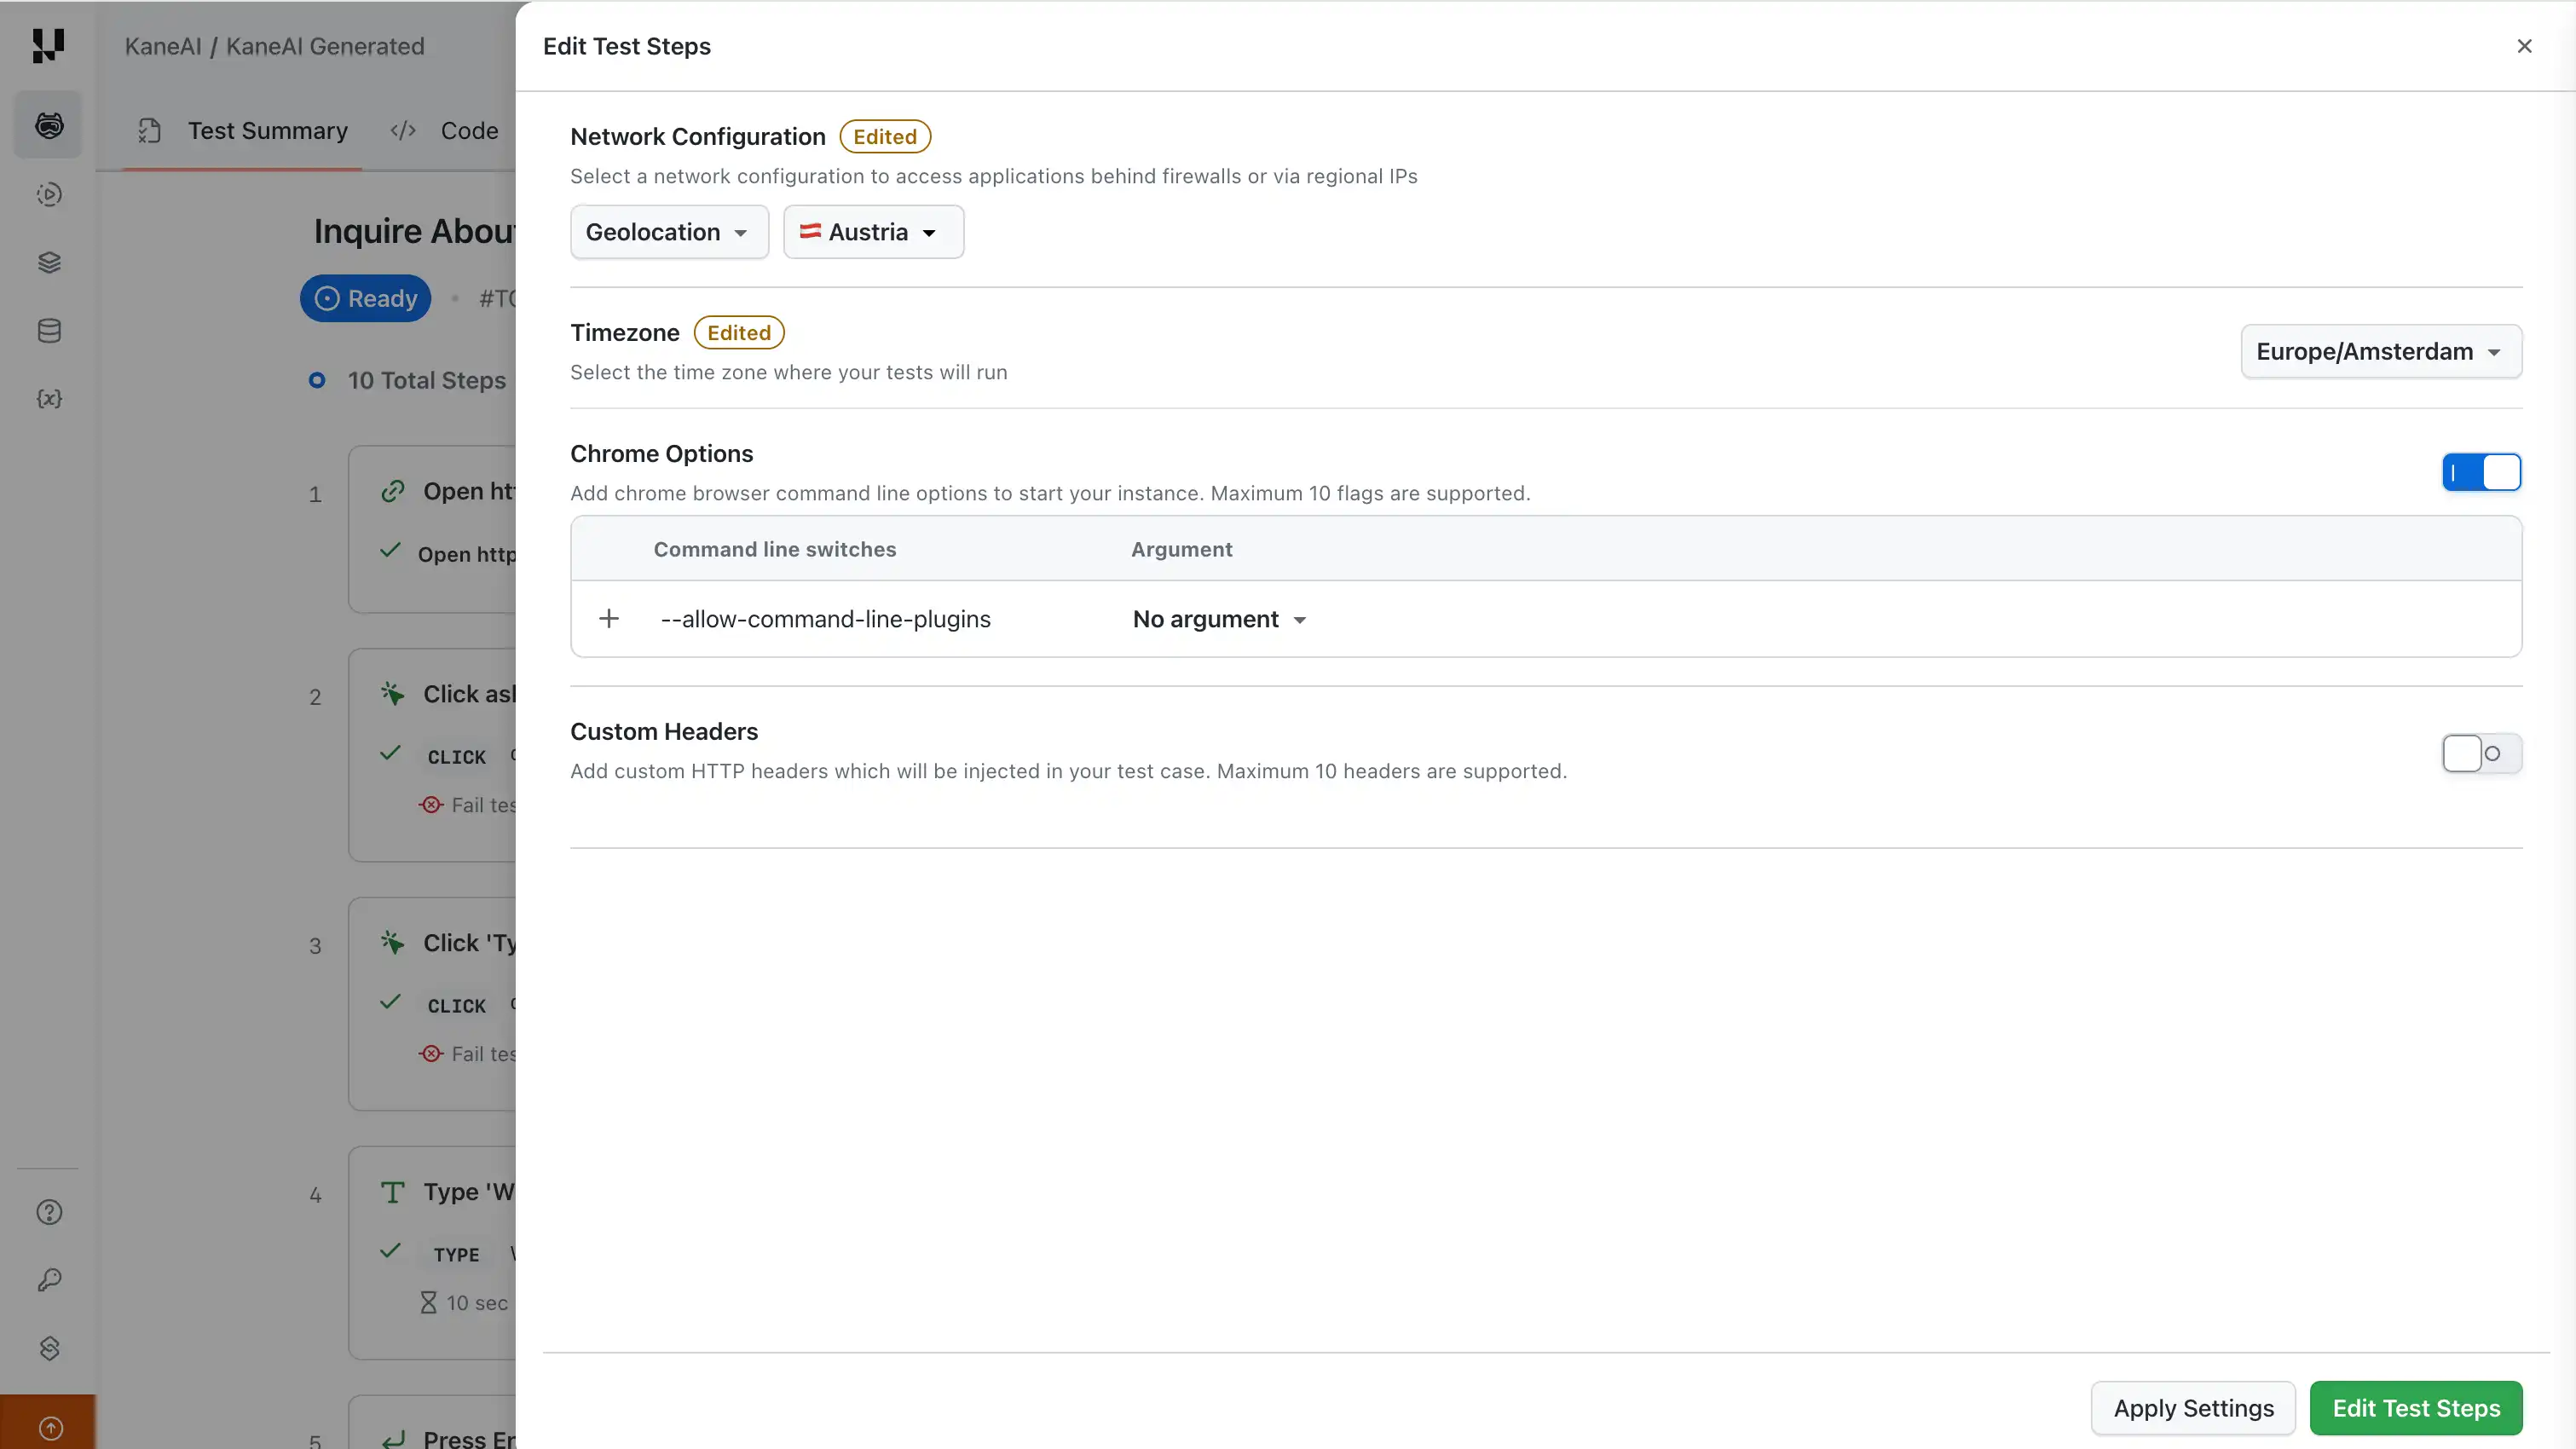
- Editable configs: Change network settings, timezone, Chrome options, and custom headers on an existing test case.
- No re-authoring: Apply changes from the Test Summary page instead of building the test again.
Already authored the test? You can still change its config from the Test Summary page.
Validate KaneAI Code With Sample Run Execution
Code Validation in KaneAI now runs through Sample Run Execution across the platform. Execution is more consistent, the old restrictions are gone, and generated test cases work more smoothly with Test Runs.
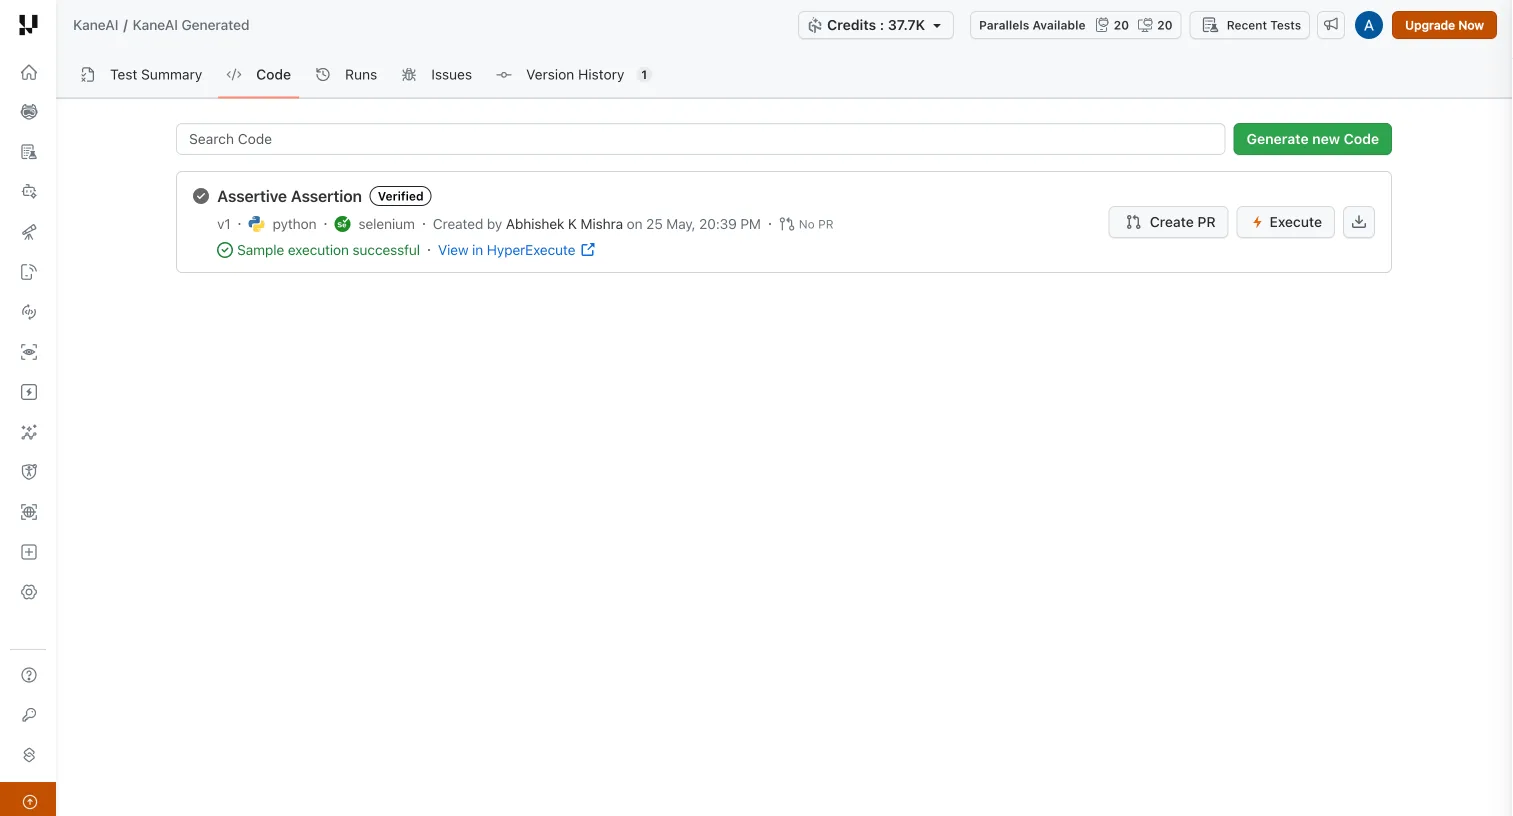
- Sample Run Execution: Validate generated code through a consistent sample run instead of the older, more restrictive flow.
- Fewer restrictions: Generated test cases interact with Test Runs more smoothly, with blockers from the previous flow removed.
If you spend time in the generated code, the Code tab is where you'll notice the difference.
Target Preview URLs and Tunnels From the GitHub App
Testing a PR shouldn't mean leaving GitHub. You can now customize KaneAI GitHub App test generation workflows with the --url and --tunnel parameters, directly from pull request comments.
- --url: Override the target application URL to test PR-specific preview environments.
- --tunnel: Route executions through a named tunnel to validate locally hosted or private applications.
- Flexible deployments: Support dynamic deployments and secure environment testing without leaving GitHub.
You can trigger test generation right from a pull request with these parameters.

SmartUI: Scroll Capture, A/B Baselines, and Screenshot Grouping
SmartUI, our visual testing tool, focused on two things - capturing pages accurately, and cutting down the failures that were never real bugs.
Capture the Exact Scroll Position in SmartUI
Pages that rely on scroll containers used to snap back to the top the moment you captured them. Now SmartUI custom viewport capture preserves the scroll position that exists when you take a snapshot.
- Scroll position preserved: Snapshots keep the current page and element scroll position instead of resetting to the top.
- Complex layouts covered: Capture nested scroll containers, PDF and document viewers, virtualised lists, infinite-scroll pages, data grids, modals, and drawers accurately.
Got a page full of scroll containers? SmartUI will now preserve its scroll position when you capture it.
Keep Multiple Baselines With SmartUI A/B Testing
A page can look different and still be correct, an A/B variant, a feature flag, a different locale. You can now keep multiple approved reference images, called variations, for a single SmartUI screenshot or PDF page.
Each new capture is compared against every active variation, and the UI shows you which one it matched based on the closest visual agreement.
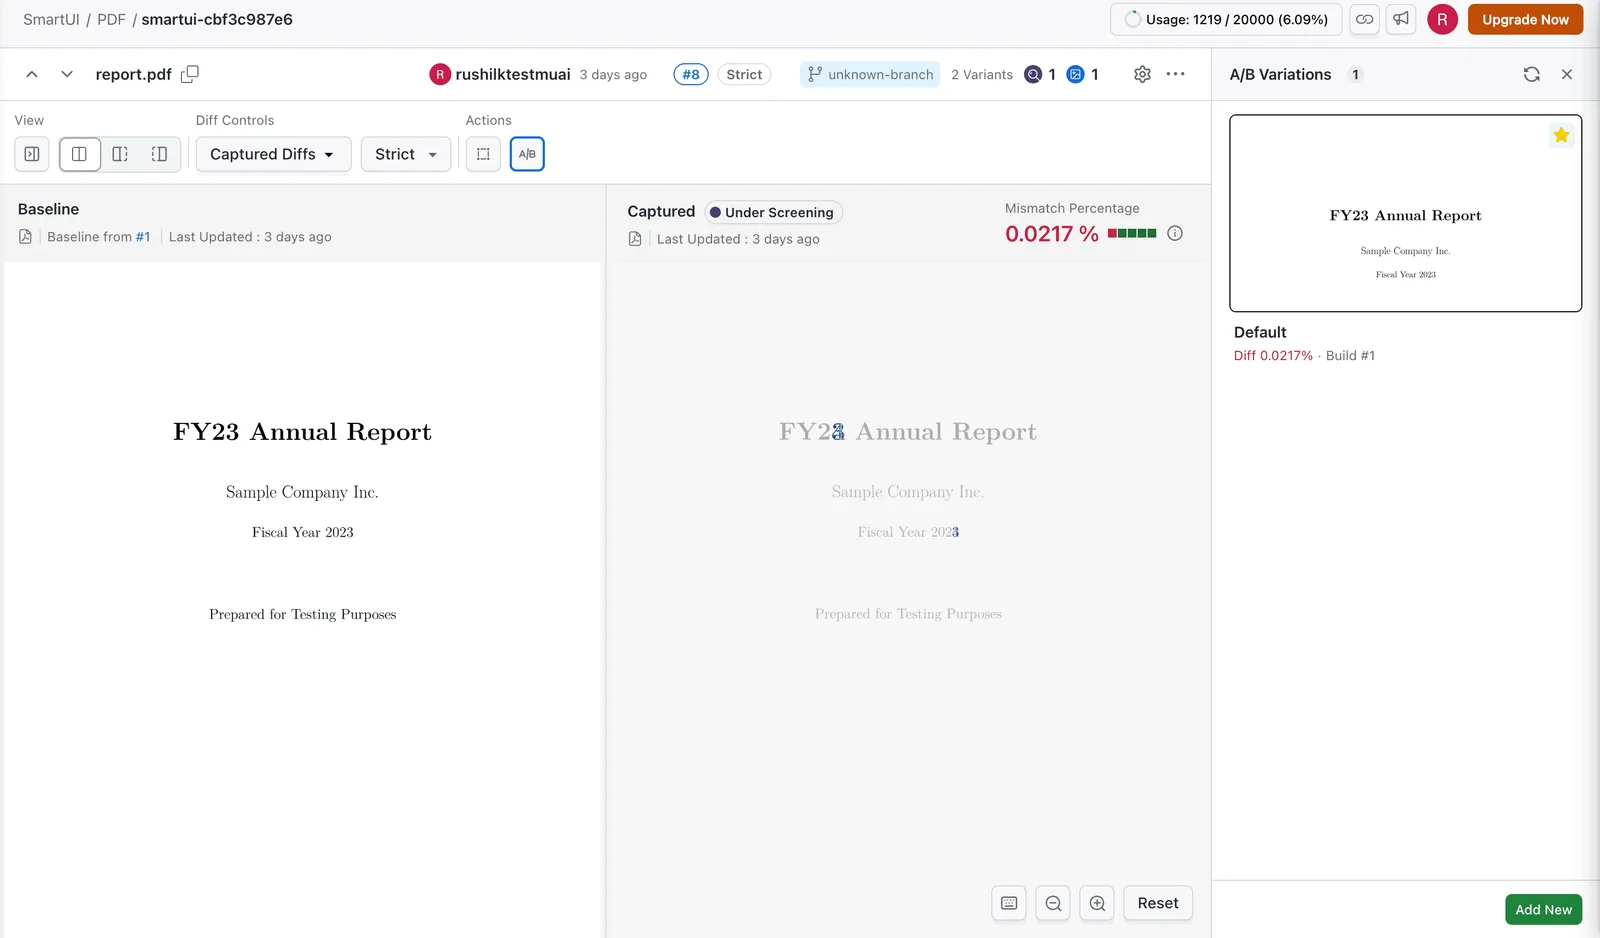
- Multiple variations: Store several approved baselines under one name instead of splitting a page into separate names in your automation or upload flows.
- Closest-match comparison: Every capture is checked against all active variations, and the matched variation is shown clearly in the panel.
- Fewer false failures: Cover A/B tests, feature flags, themes, locales, and PDF layout variants without flagging valid differences as regressions.
Running an A/B test right now? This is how you keep a baseline for every variation.
Group SmartUI Screenshots by Test Case
Hunting for the right screenshot in a flat list is nobody's favorite task. You can now group screenshots in the SmartUI build view by test case, and move between your Automation and SmartUI pages without losing context.
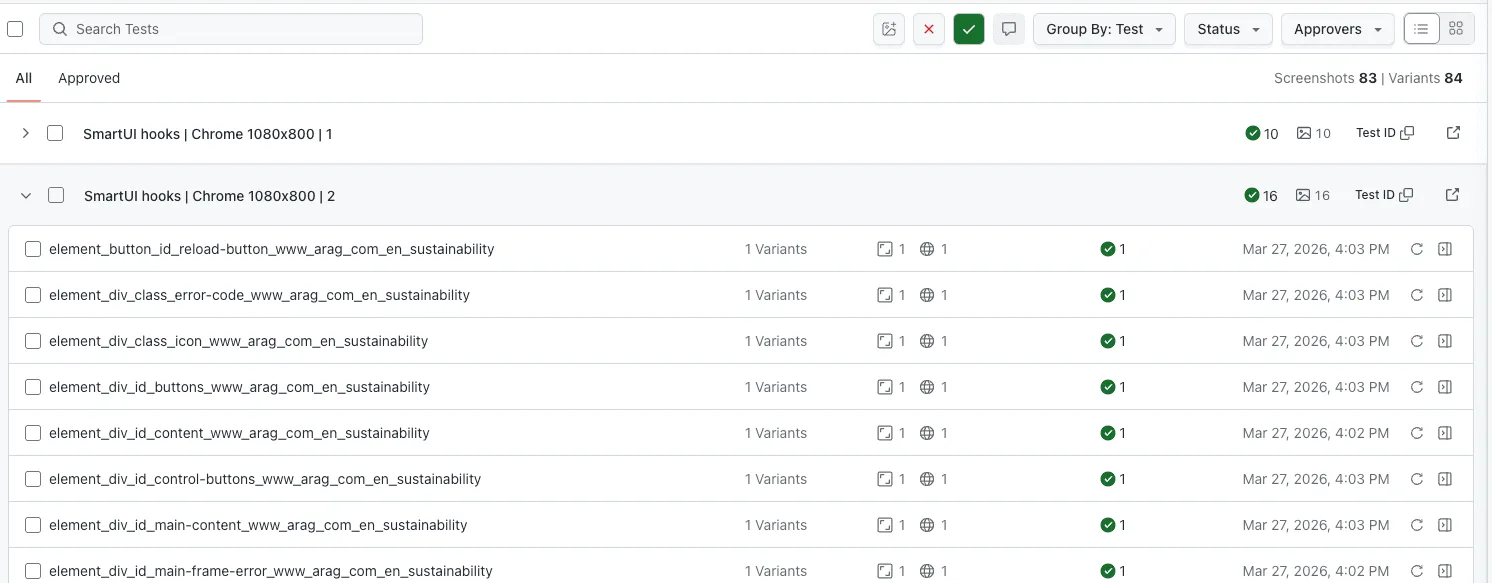
- Group by test case: Organize screenshots in the build view by their test case so related visuals stay together instead of in one flat list.
- Automation to SmartUI navigation: Jump straight from an Automation test to its SmartUI screenshots, and back, to review visual results in context.
- Faster review: Spend less time hunting for the right screenshot and more time triaging visual differences.
Your build view gets a lot tidier once you group screenshots by test case.
Real Devices: Custom Clocks, Manual Session Tracking, and Live App Profiling
Real-world conditions are where apps actually break. This release lets you reproduce more of them on the Real Device Cloud, and keeps a proper record of what you did manually.
Set a Custom Date, Time, and Hour Format on Real Devices
Testing your app often means validating how it behaves across different date, time, and format scenarios. You can now dynamically configure the date, time, 12 or 24 hour format, and the automatic time toggle on real iOS (14+) and Android (10+) devices, both in manual sessions and through Appium automation hooks.
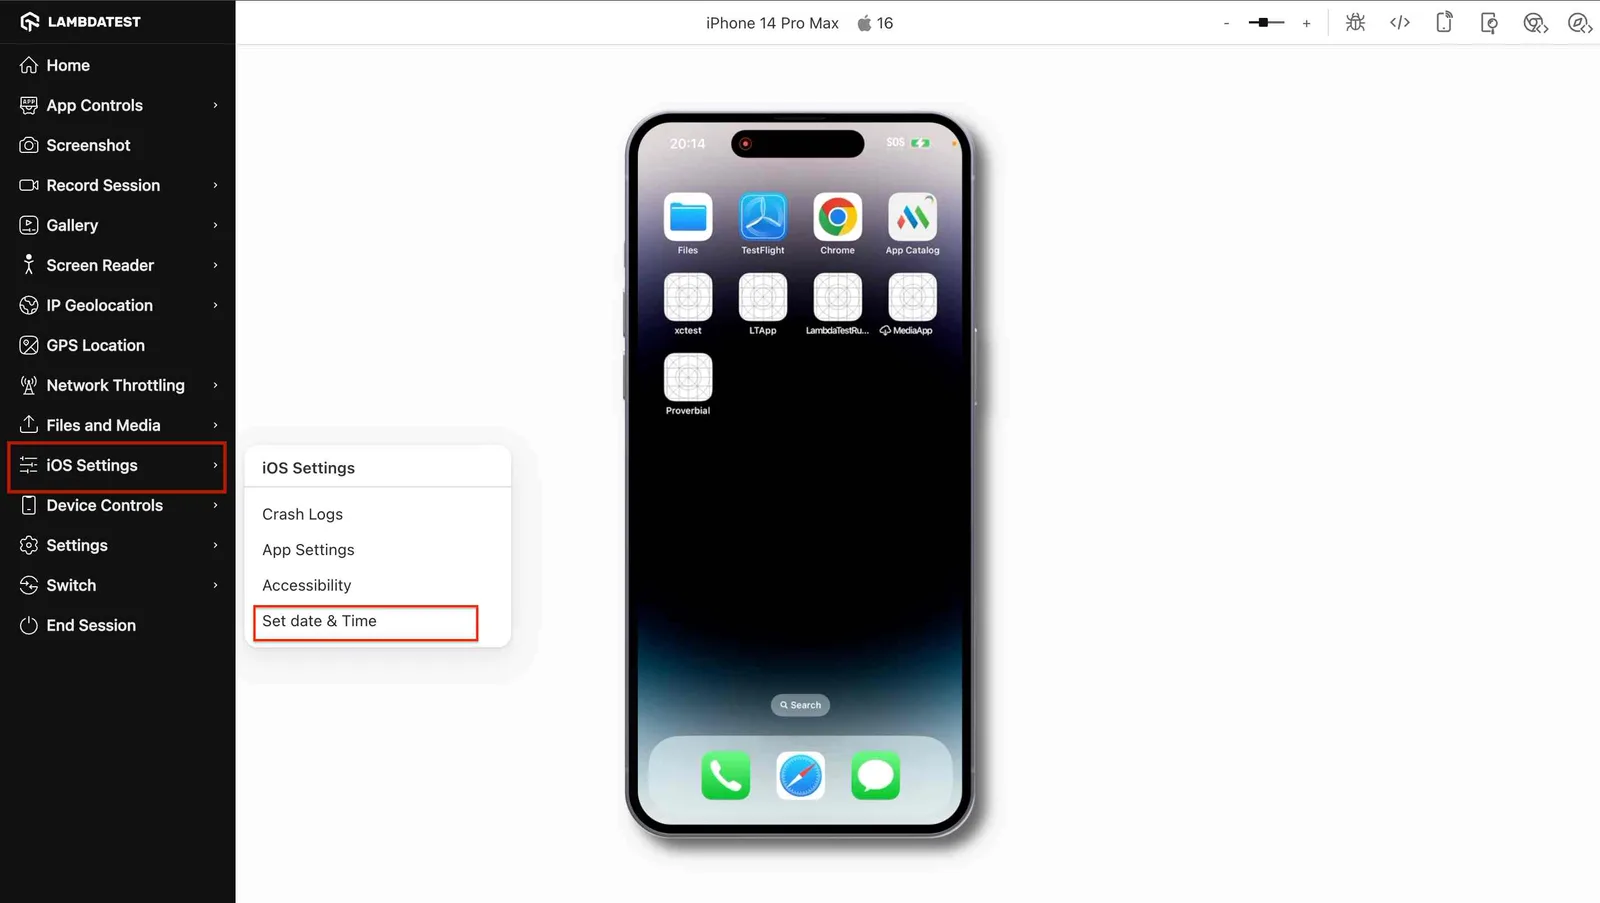
- Custom date and time: Set any date and time on the device to test reminders, expiry flows, scheduling, and time-sensitive logic.
- 12 or 24 hour format: Switch the hour format to verify your app renders times correctly in both modes.
- Automatic time toggle: Turn the device's automatic date and time on or off to cover network-synced and manually-set scenarios.
- Manual and automation: Apply these settings during live manual sessions or pass them via Appium automation hooks.
Anything time-sensitive in your app? Set the date, time, and hour format before you start.
Profile App Performance During Manual Sessions
Automated profiling through Appium tests is great for CI/CD pipelines, but sometimes you need to interact with your app yourself and watch how it behaves in real time. Manual App Profiling gives you that instant visibility as you tap through your app on real hardware.
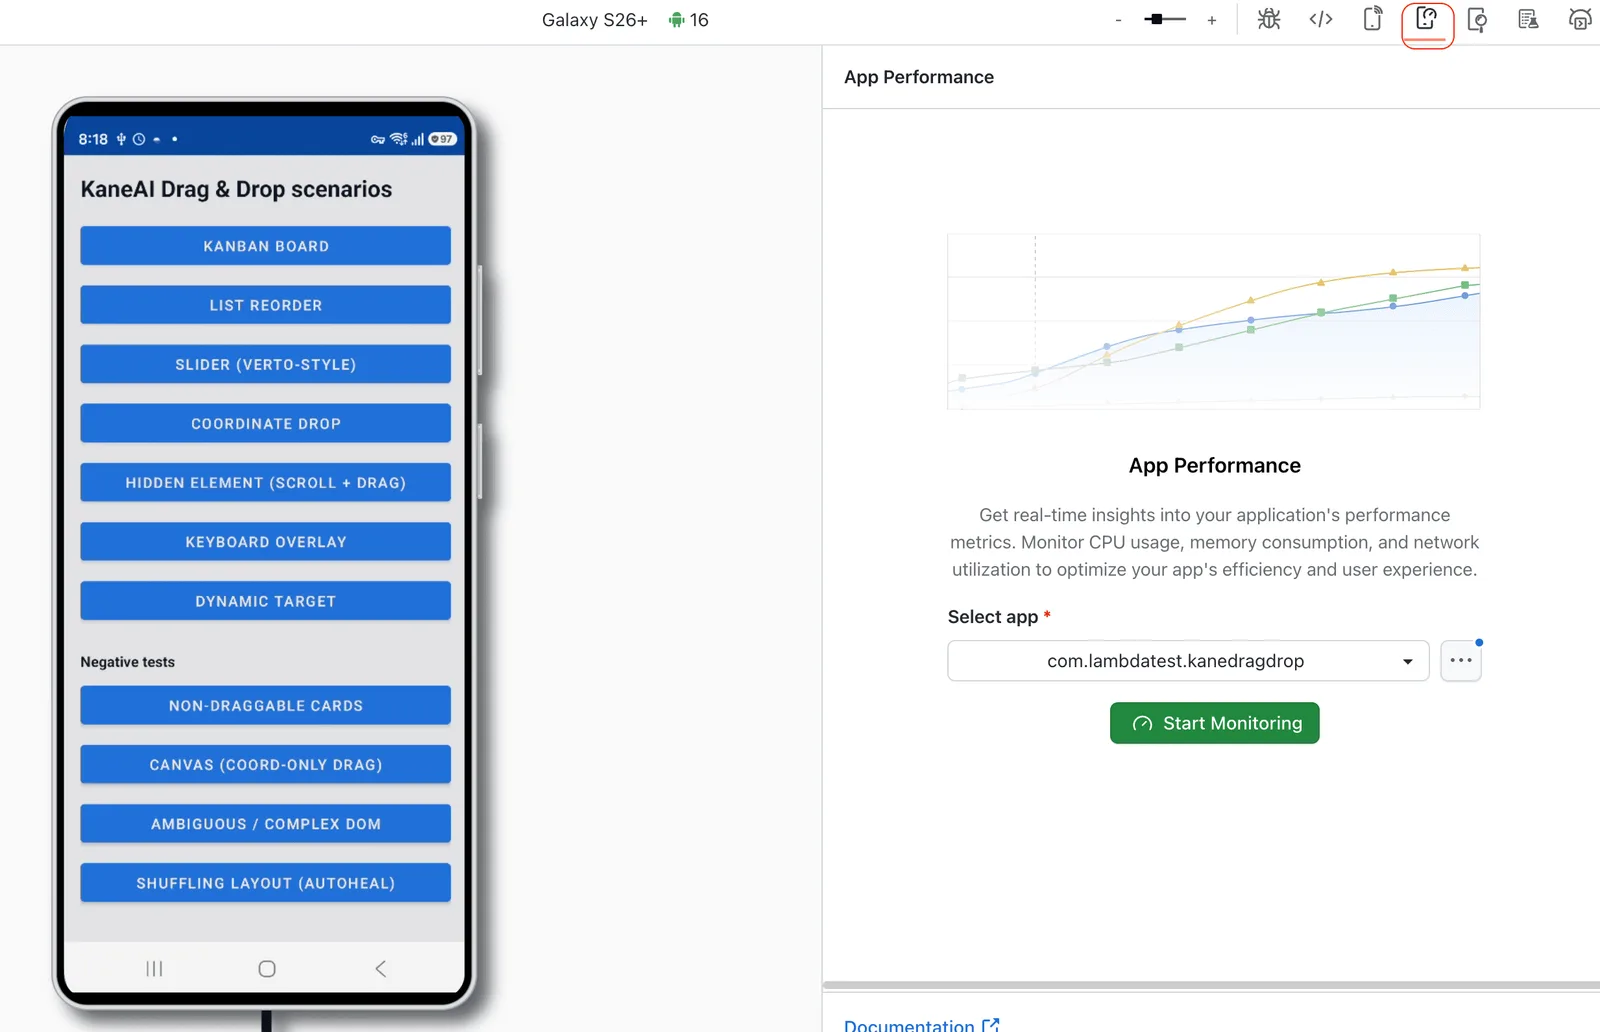
- Real-time metrics: Watch CPU, memory, disk, network, and more update live while you interact with the app.
- Real device sessions: Profile on real hardware during manual testing, not just in automated runs.
- Catch issues early: Spot performance regressions and resource spikes as they happen, instead of digging through logs later.
Open it on your next manual session and watch your app's performance in real time.
Track Every Manual Session in One Dashboard
Manual sessions used to vanish the moment you closed them. The Manual Tests Sessions Dashboard turns them into structured historical records, so you can track, analyze, and report on your manual testing activity over time.
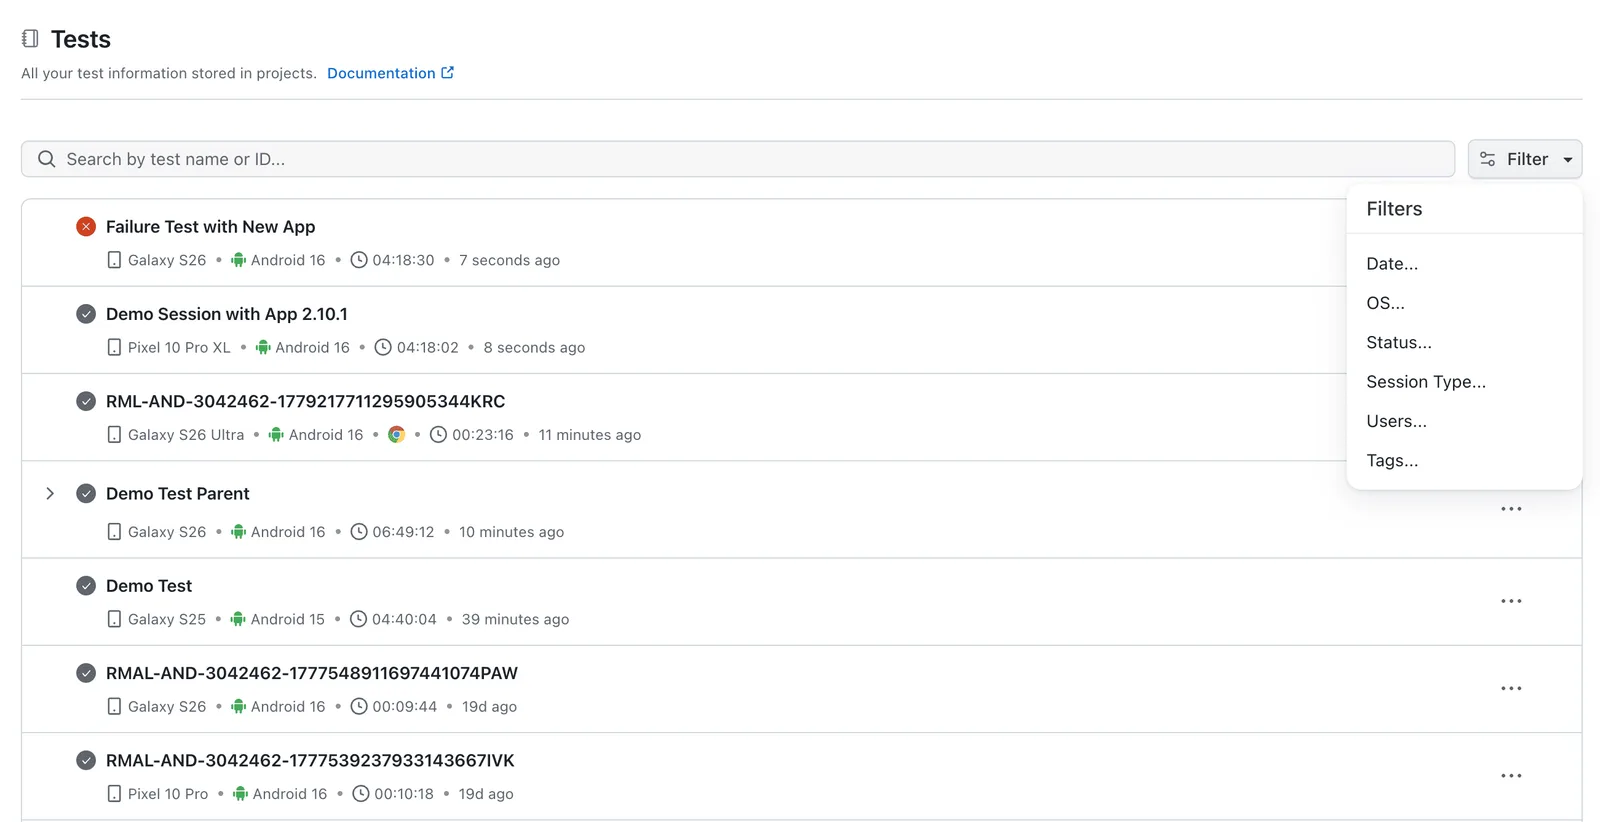
- Unified view: See every manual session across your Real Devices products in one place.
- Automatic capture: Your Real Devices App Testing (App Live) and Real Devices Browser Testing (Browser Live) sessions are stored on the dashboard automatically.
- Historical records: Revisit past sessions to track activity, analyze trends, and build reports instead of losing context when a session ends.
Everything you ran last week is already waiting in the Manual Tests Sessions dashboard.
Search Network Logs Across Every Field
Search in network logs now matches across all relevant fields by default, with optional field-specific scoping when you need more precise results.
- All scope: Search across any field from a single query without choosing a scope first.
- Field-specific scopes: Narrow results with dedicated Method and Status scopes for precise filtering.
Next time you're digging through a session, just type what you remember into the network log search.

App Automation: App Downloads, Terminal Logs, and Run History
App Automation's updates are all about getting more out of your runs: pulling builds and logs through APIs, and keeping a record of what already ran.
Download Uploaded Apps via API
You can now download apps you have uploaded to TestMu AI programmatically. Two new REST APIs let you pull builds using either the App ID or a Custom ID, which is useful for CI/CD pipelines and automation scripts.
- Download by App ID: Fetch an uploaded build directly using its App ID.
- Download by Custom ID: Retrieve a build using your own Custom ID for easier referencing in scripts.
You can download an uploaded app by its ID through the REST API.
Attach Your Own Terminal Logs to Mobile Runs
Got Appium server logs, test-runner output, or CI logs you want alongside a session? You can now attach your own terminal logs to any app automation session through a single REST API, then view or download them from the Automation dashboard.
- Single API upload: Attach terminal logs to a mobile app or web session with one REST API call.
- View in dashboard: Access uploaded logs under Logs, then Terminal, in the TestMu AI Automation dashboard.
Already collecting logs in CI? Push them up with the terminal logs API.
Review Past Runs With History View in App Automation
App Automation now supports a History View on mobile devices, so you can review your past app automation runs and their details in one place.
- Run history: Browse previous app automation sessions on mobile devices without leaving the dashboard.
- Quick review: Revisit past executions to track activity and compare runs over time.
New to App Automation? Get started with Appium testing on TestMu AI.
Test Manager: Rich Text Remarks and New Dashboard Widgets
Test Manager's updates make documenting what you saw during a run less clunky, and team workload easier to read.
Add Rich Text and Pasted Images to Test Remarks
Remarks in Manual Test Instance execution now support rich-text formatting and direct image pasting from your clipboard. You can add formatted observations and screenshots without downloading and re-uploading attachments.
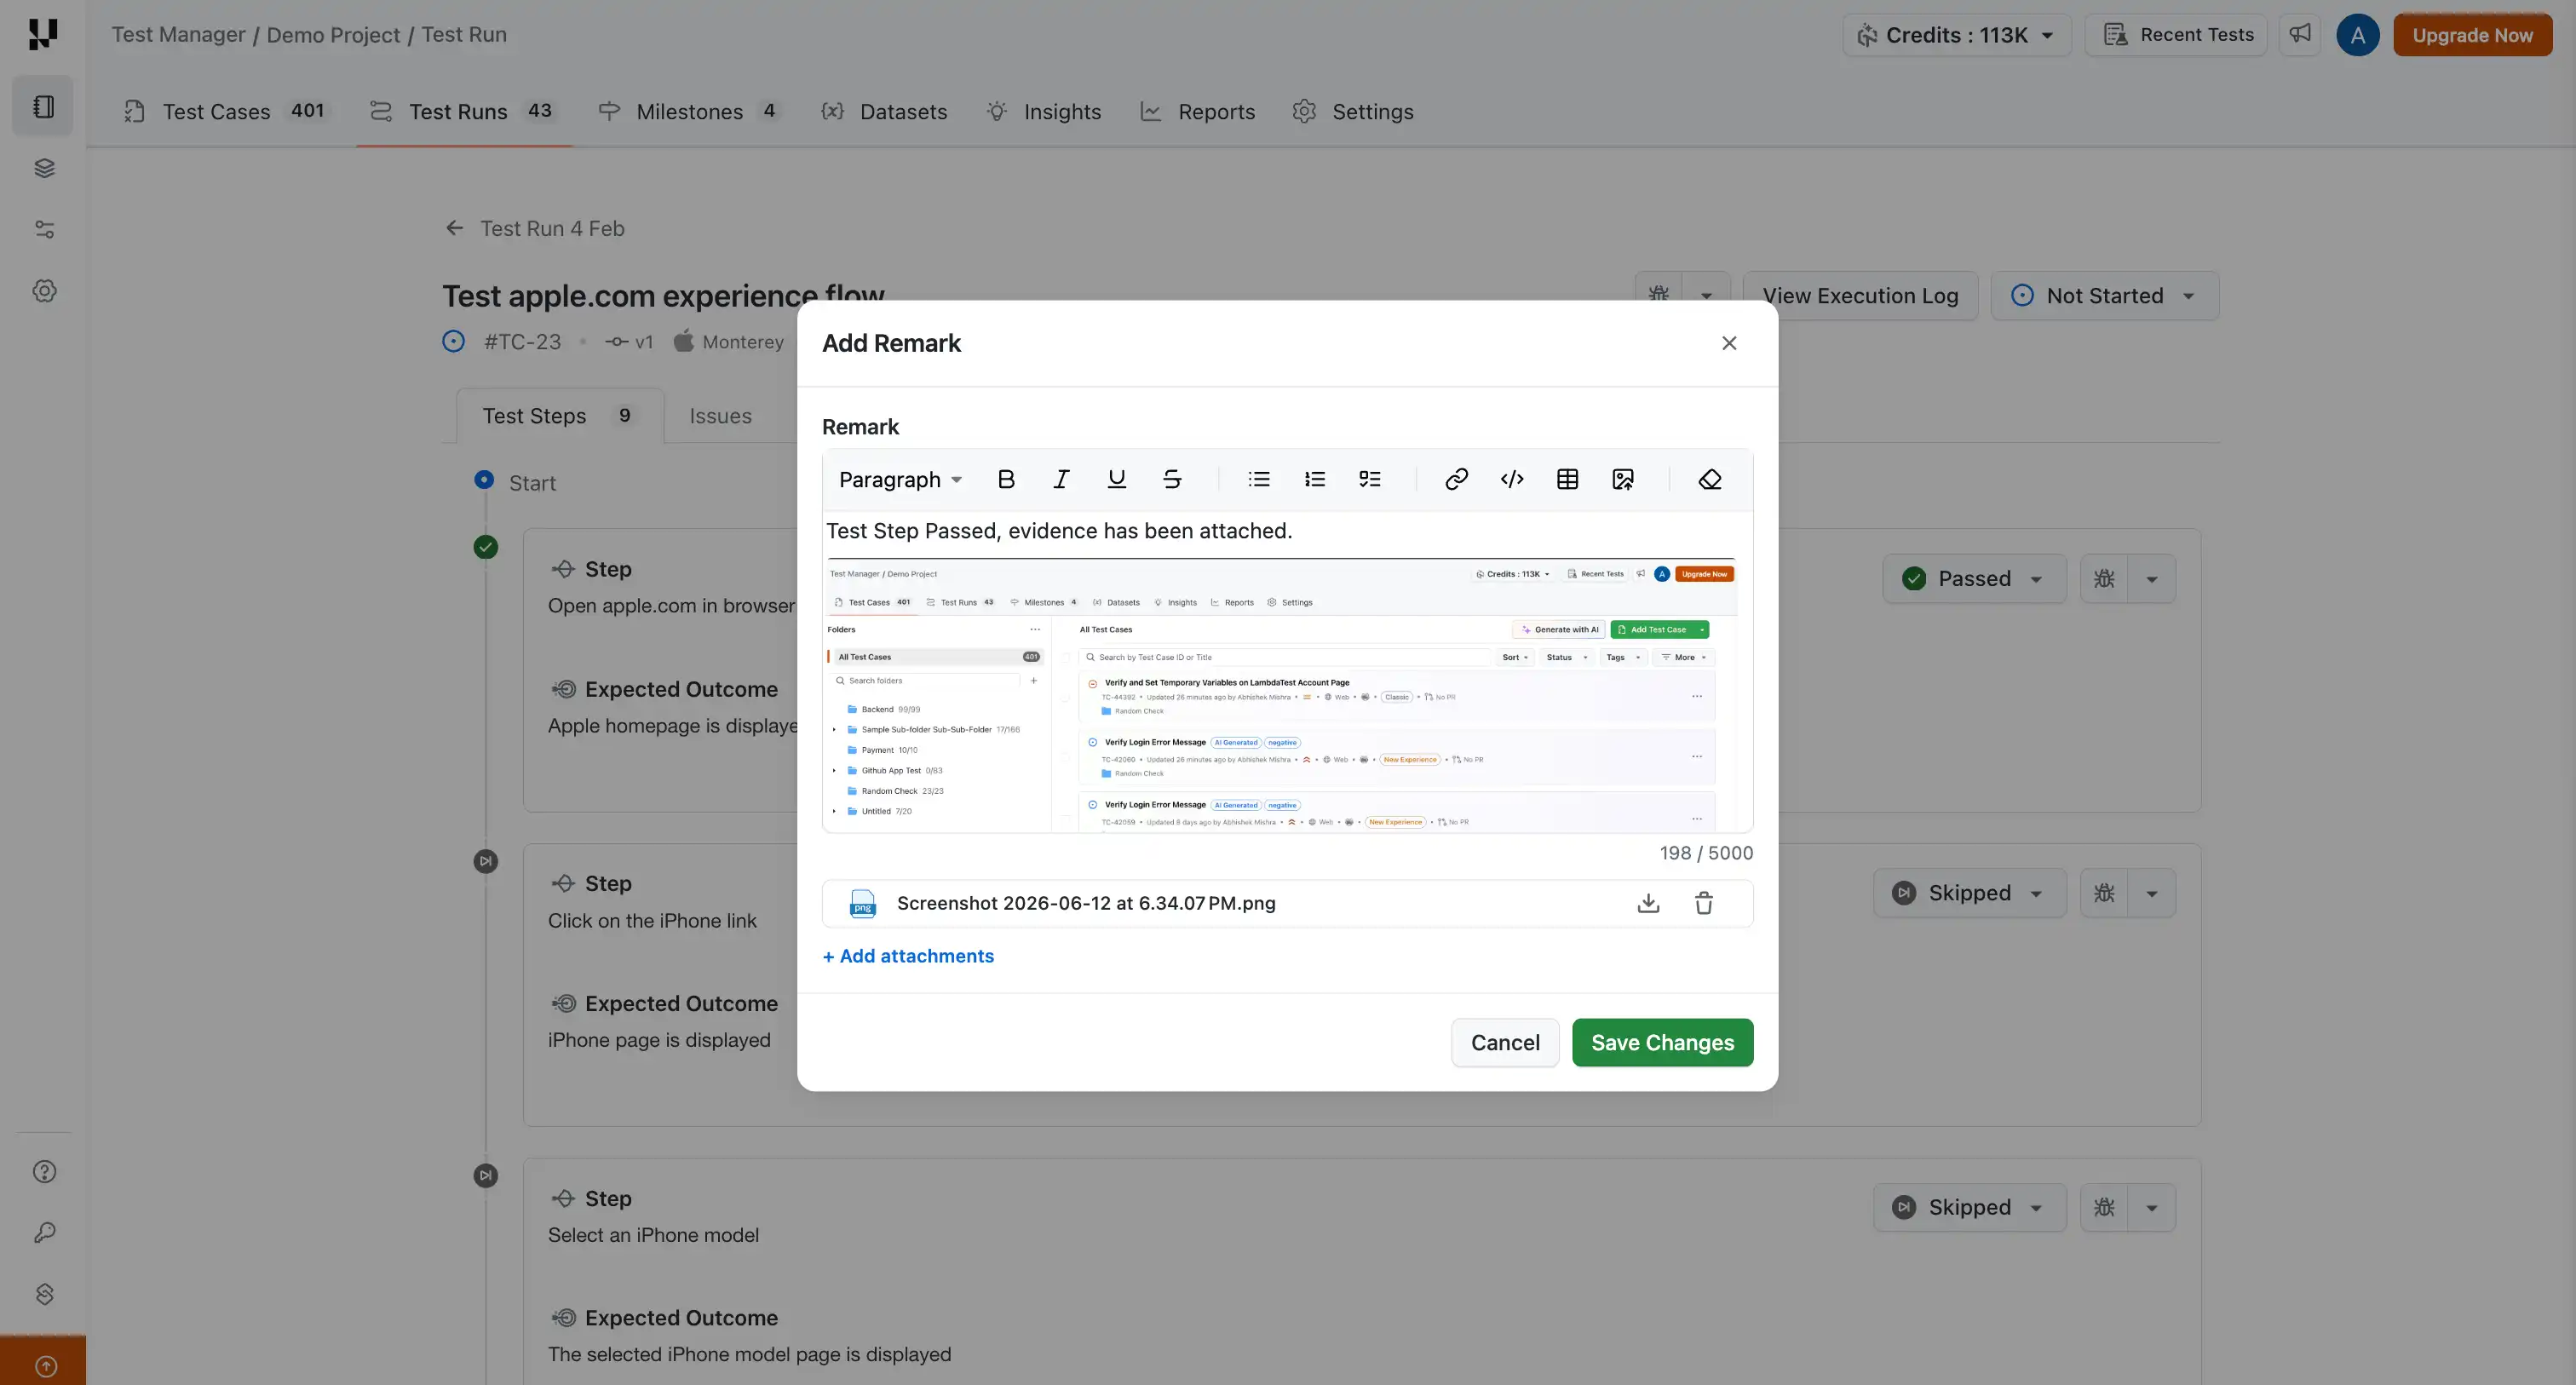
- Rich text: Add formatting, lists, and links to your remarks for clearer documentation.
- Paste images: Paste screenshots straight from the clipboard instead of saving and uploading files.
- Backward compatible: Existing text remarks and attachments continue to work as before.
Paste a screenshot straight into your next run's remarks and attachments.
Track Defects and Tester Workload With New Test Manager Widgets
Two new widgets are now available on the Test Manager Insights dashboard. You can add either of them to any Test Manager dashboard from the widget library, and both respect your existing dashboard date range and filters.
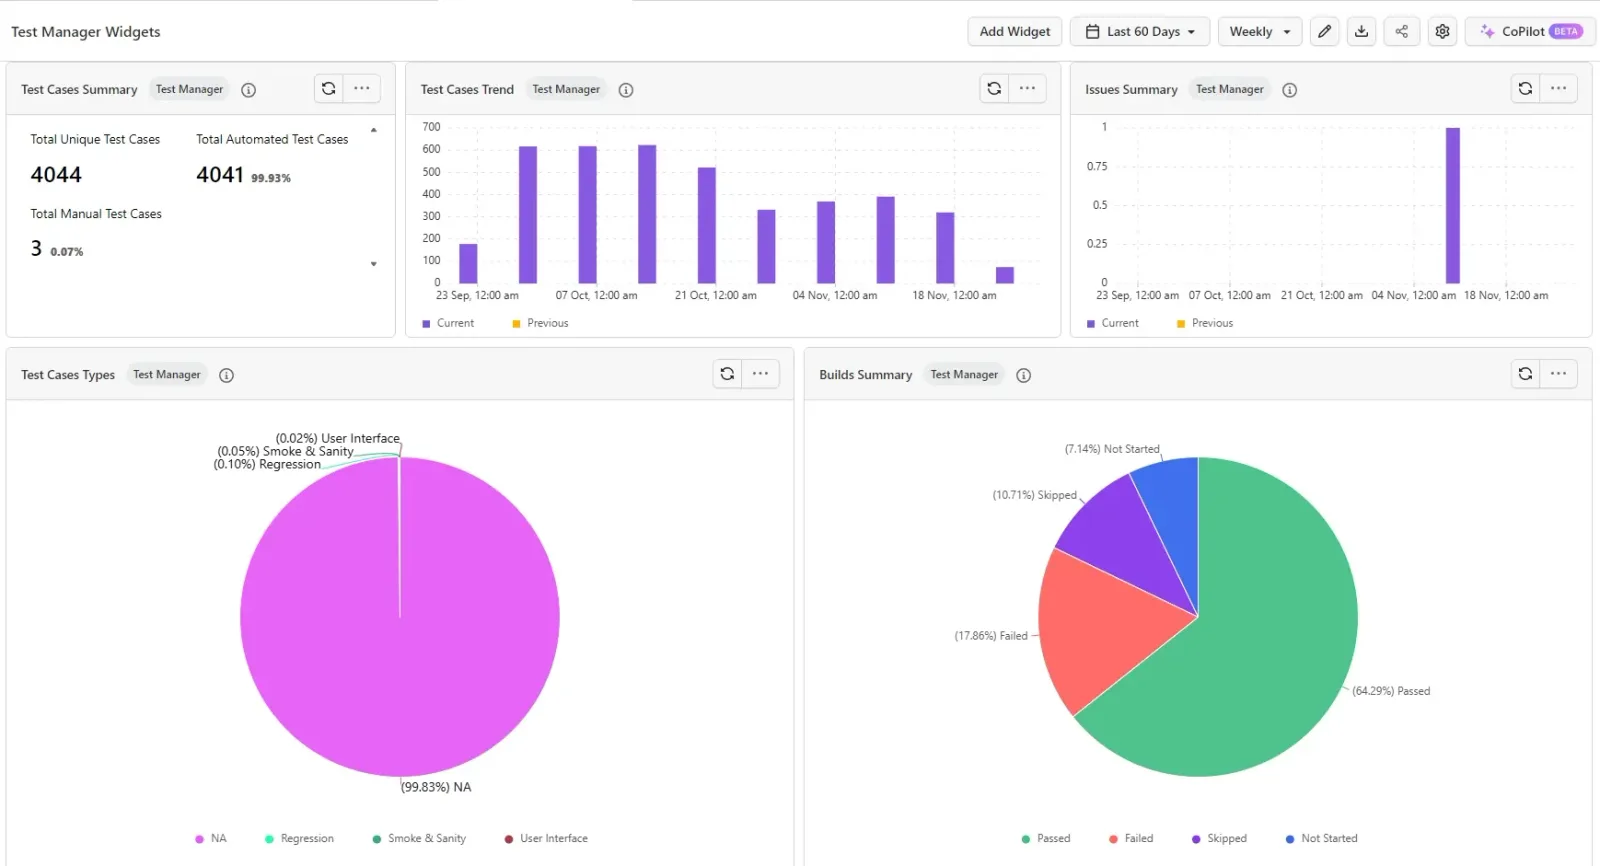
- Defects by Severity: All linked defects grouped by severity (Critical, High, Medium, Low), each showing its status, age, and a direct Jira link, so you can quickly spot the critical bugs.
- Tester Assignment: Each tester's assigned test runs broken down by execution status, so you can compare workload and progress across your team at a glance.
- Execution status breakdown: Track Passed, Failed, In Progress, Blocked, and Not Executed runs per tester.
- Shared filters: Both widgets honor the dashboard date range and filters you already have set.
Both are sitting in the widget library, ready to drop onto your Test Manager dashboard.
Insights: RCA API Parity, a Redesigned Weekly Report, and Better Failure Categorization
The Insights updates are all about one thing: what you see in the dashboard and what you get from the data should match, and both should be easy to act on.
RCA APIs Now Return What the UI Shows
The Root Cause Analysis APIs now return the same RCA version you see in the dashboard. Previously the APIs surfaced an older RCA that was not in parity with the frontend.
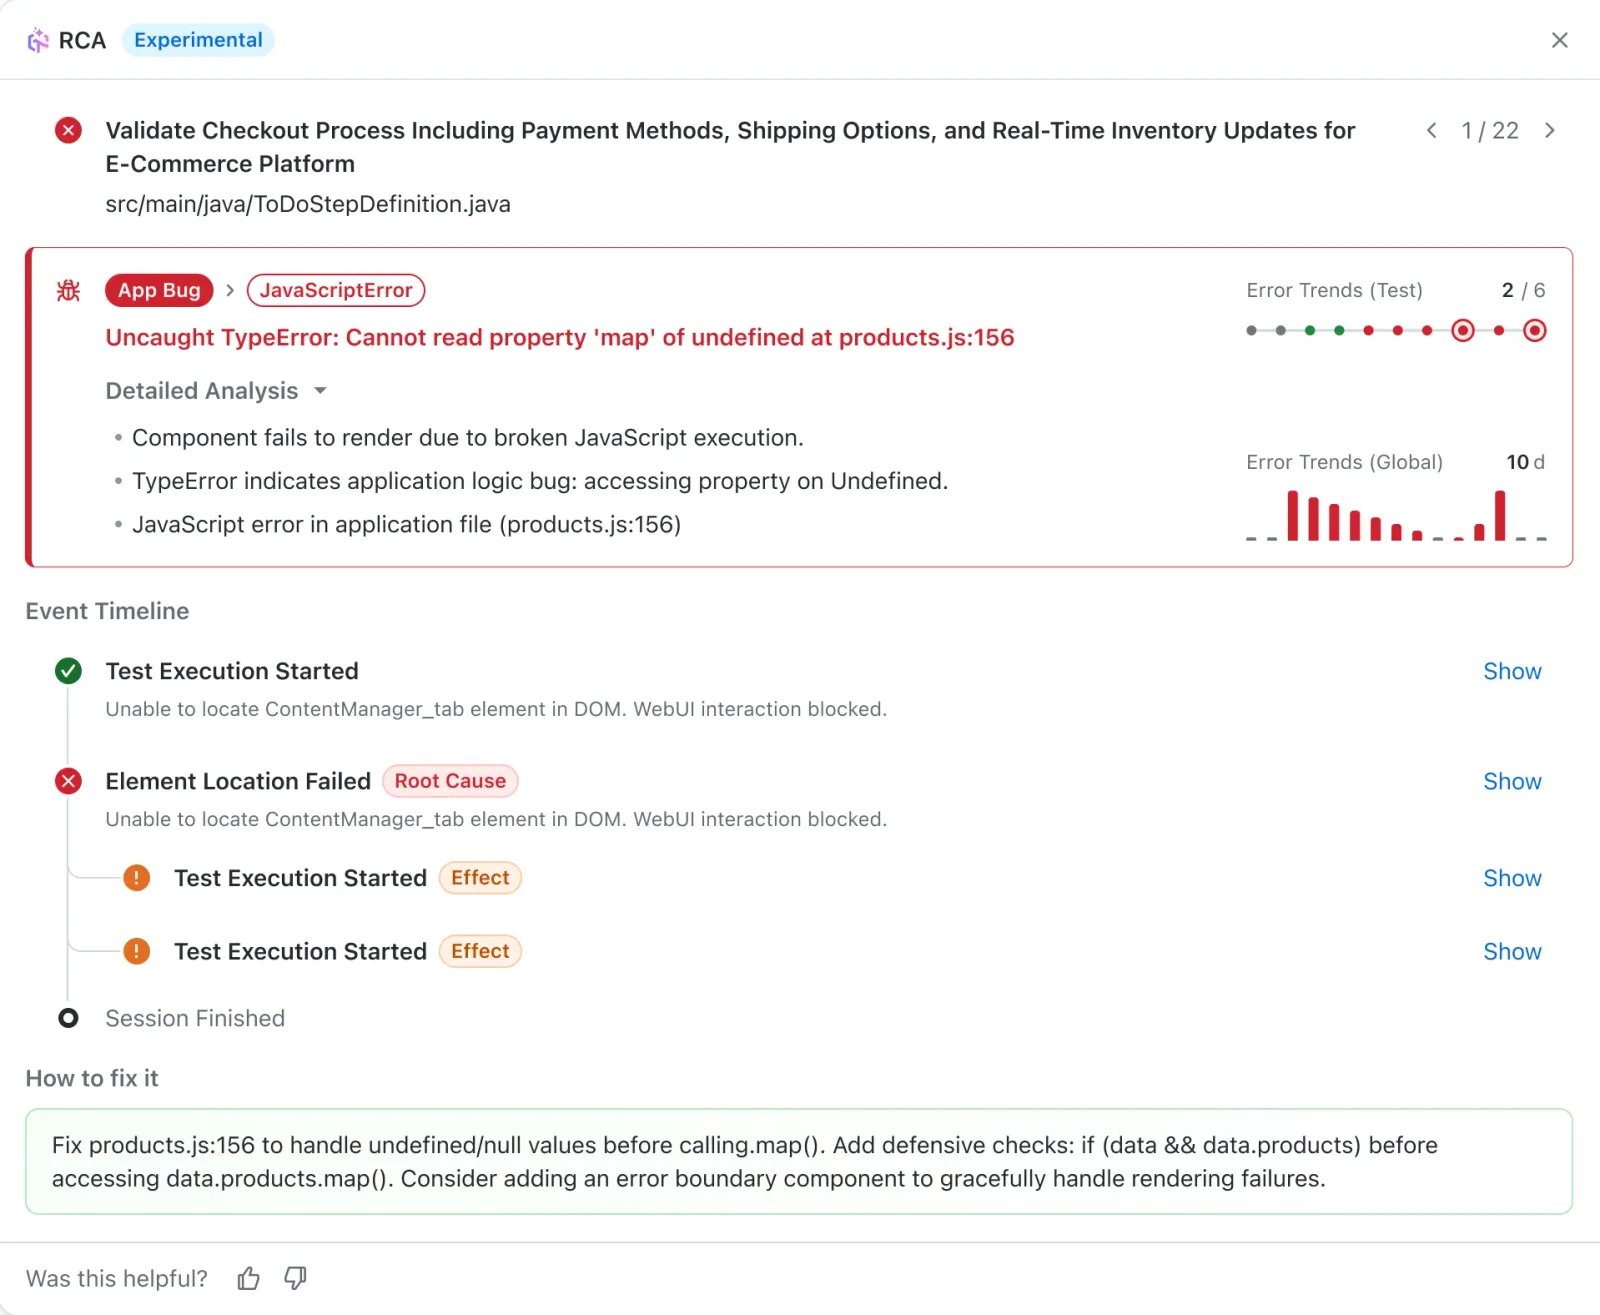
- UI parity: API responses match the RCA displayed in the dashboard, so automated workflows and the UI stay in sync.
- Trigger and fetch: Use the updated endpoints to trigger an AI-powered RCA for a test failure and retrieve the result programmatically.
You can trigger and fetch an AI-powered root cause analysis directly through the API.
Get a Redesigned Weekly Insights Report
The weekly Insights report has been revamped with an all-new format and more in-depth details. You will receive it every Monday so you can review the previous week at a glance.
- Clearer hierarchy: Get a verdict at a glance instead of scanning rows of stats.
- Week-over-week deltas: See changes on every metric with correct color logic, so dropping failures show as green.
- Per-product breakdown: View Passed, Completed, and Failed splits per product, plus a new web and mobile OS coverage section.
You can find more details on how to use the weekly Insights report effectively.
Jump From the Daily Test Summary Straight to Your Tests
The Automation Daily Test Summary report from Insights now includes clickable links. You can drill straight from a status in the report into the underlying tests, instead of searching for them manually in the dashboard.
- Drill-down links: Click any status in the report to open the matching tests directly.
- Faster triage: Move from the daily summary into the exact passing or failing tests in one click.
For more on Insights reporting, explore the Test case insights widgets for detail Test Summary.
Categorize Playwright Failures From Command Logs
Failure categorization now uses command logs for HyperExecute Playwright tests. The existing command log fallback, already available for Selenium, Appium, and non-HyperExecute Playwright, now covers HyperExecute Playwright as well.
- Command log fallback: When no remark is present, the failure category is derived from the last failing Playwright command log.
- Framework parity: Get consistent failure categorization across Selenium, Appium, and Playwright, including HyperExecute runs.
Ever wondered how a failure lands in one bucket over another? That's test failure classification at work.
Day 0 Platform Support: iOS 27 and macOS Golden Gate
When Apple ships, so do we. Both iOS 27 and macOS Golden Gate went live on TestMu AI on Day 0, in line with Apple's release, so you can test on what your users are upgrading to right away.
iOS 27 Is Now Available on TestMu AI Real Device Cloud
iOS 27 (Beta) is available on TestMu AI Real Device Cloud on Day 0, in line with Apple's release. You can start testing your mobile apps on real iOS 27 devices right away.
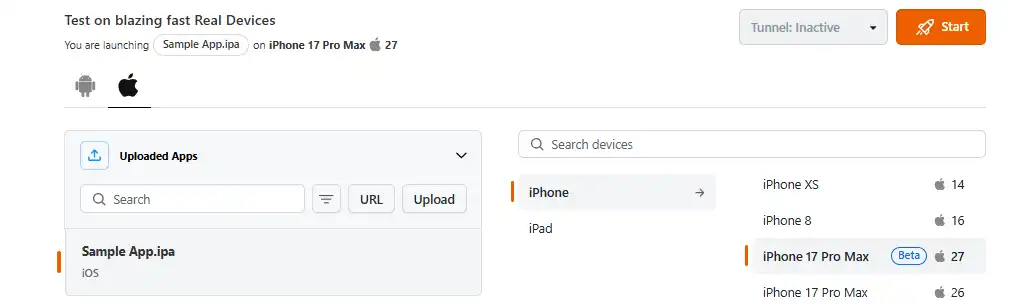
- Manual and automated testing: Run manual sessions or automate with Appium, XCUITest, Espresso, and Detox on real iOS 27 hardware.
- Network throttling: Simulate conditions from 2G to 5G and test geolocation across 170+ countries.
- Biometric flows: Test Face ID and Touch ID authentication on supported iOS 27 devices.
- Full debugging: Access device logs, network logs, video recordings, and Safari Web Inspector for complete visibility into your test runs.
macOS Golden Gate Is Now Available on Real Time Testing
macOS Golden Gate (Beta) is available on TestMu AI Real Time Testing on Day 0, in line with Apple's release. You can test on macOS Golden Gate right away, running live interactive tests of your websites and web apps on the real OS.
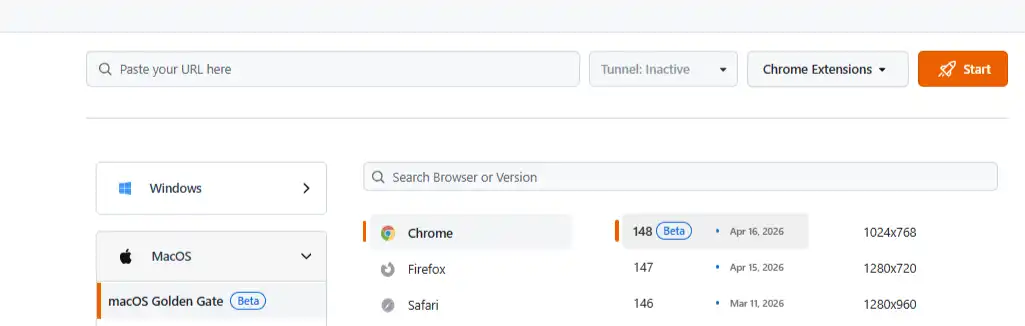
- Live cross-browser testing: Test across Safari, Chrome, Firefox, and Edge on macOS Golden Gate in a live interactive session.
- Built-in DevTools: Access DevTools and Safari Web Inspector directly inside every session without any extra setup.
- Geolocation and network simulation: Test across 170+ countries and simulate different network conditions within the same session.
- One-click bug reporting: Instantly log bugs to Jira, Slack, Azure DevOps, and other integrated tools without leaving your session.
Summing Up!
June's theme is simple: test on what's new, and understand what happened when you do.
iOS 27 and macOS Golden Gate mean you're never waiting to test the platforms your users just moved to, and KaneAI's instance view turns a failed run into a step-by-step story you can actually debug.
SmartUI stops flagging differences that were never regressions, real devices reproduce the conditions that break mobile apps, and App Automation hands you builds and logs straight through the API.
Keep your defects and tester workload visible in Test Manager, and trust that your Insights reports, dashboards, and APIs finally tell the same story.
Author
Saniya Gazala
Blogs: 49


Saniya Gazala is a Product Marketing Manager and Community Evangelist at TestMu AI with 2+ years of experience in software QA, manual testing, and automation adoption. She holds a B.Tech in Computer Science Engineering. At TestMu AI, she leads content strategy, community growth, and test automation initiatives, having managed a 5-member team and contributed to certification programs using Selenium, Cypress, Playwright, Appium, and KaneAI. Saniya has authored 15+ articles on QA and holds certifications in Automation Testing, Six Sigma Yellow Belt, Microsoft Power BI, and multiple automation tools. She also crafted hands-on problem statements for Appium and Espresso. Her work blends detailed execution with a strategic focus on impact, learning, and long-term community value.
Reviewer
Salman Khan
Reviewer
Salman is a Test Automation Evangelist and Community Contributor at TestMu AI, with over 6 years of hands-on experience in software testing and automation. He has completed his Master of Technology in Computer Science and Engineering, demonstrating strong technical expertise in software development, testing, AI agents and LLMs. He is certified in KaneAI, Automation Testing, Selenium, Cypress, Playwright, and Appium, with deep experience in CI/CD pipelines, cross-browser testing, AI in testing, and mobile automation. Salman works closely with engineering teams to convert complex testing concepts into actionable, developer-first content. Salman has authored 120+ technical tutorials, guides, and documentation on test automation, web development, and related domains, making him a strong voice in the QA and testing community.


Did you find this page helpful?
More Related Blogs
TestMu AI forEnterprise
Get access to solutions built on Enterprise
grade security, privacy, & compliance
- Advanced access controls
- Advanced data retention rules
- Advanced Local Testing
- Premium Support options
- Early access to beta features
- Private Slack Channel
- Unlimited Manual Accessibility DevTools Tests