
Run End-to-End Tests from Your Terminal with Kane CLI
Author and Run Tests Right from the Terminal in Natural Language, with an Evidence-Backed Pass or Fail from a Real Browser.
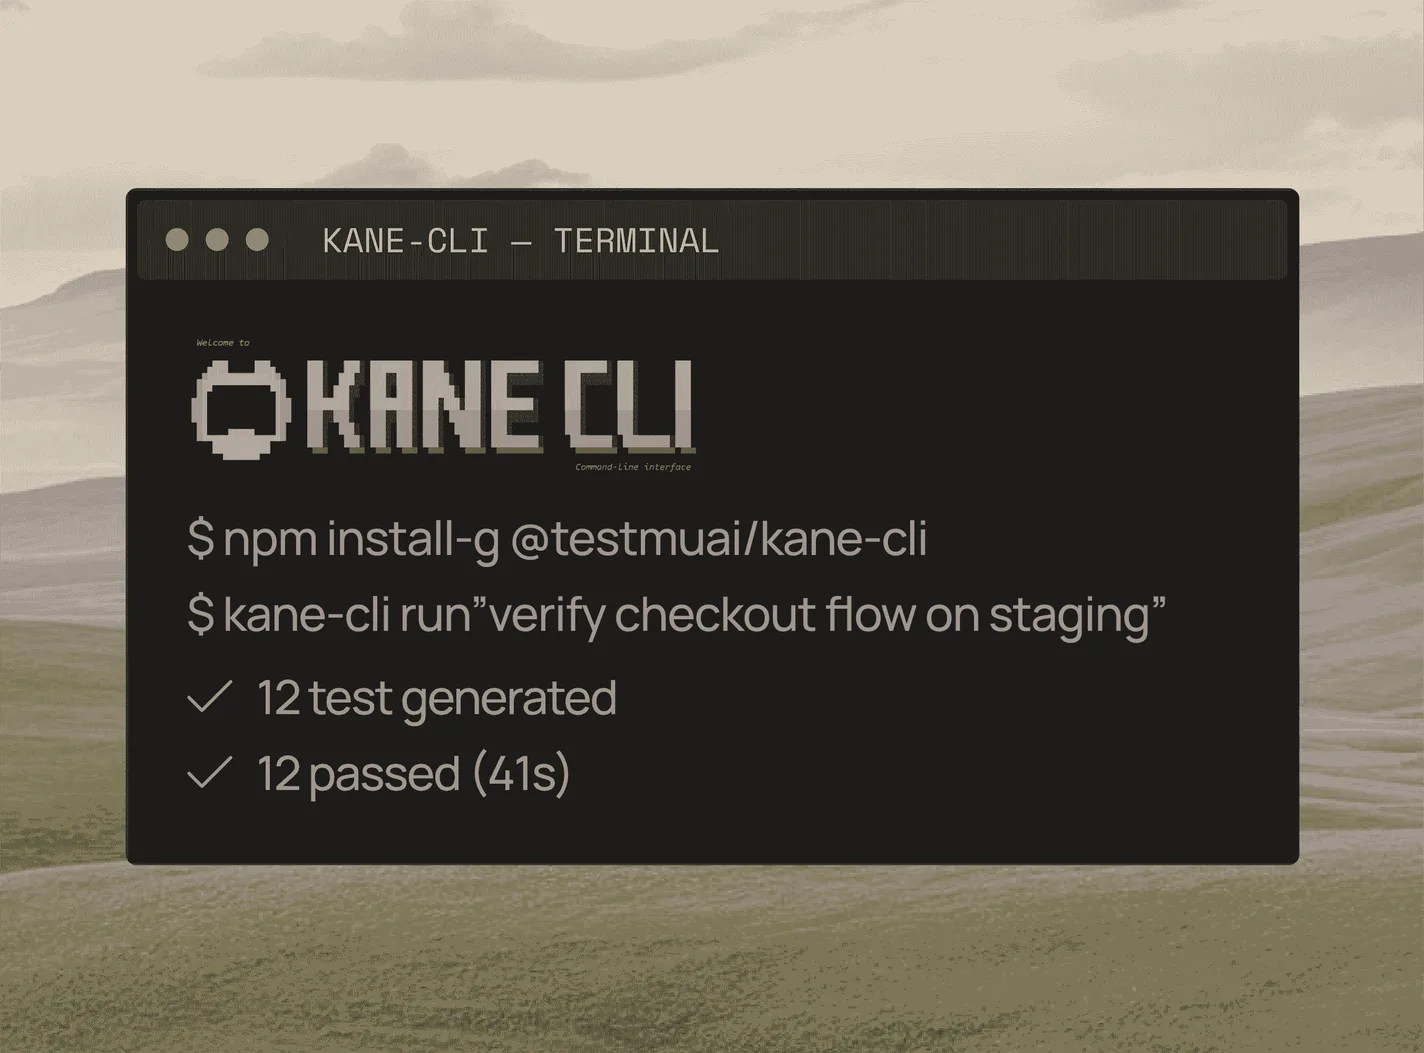
npm install -g @testmuai/kane-cli
Playwright Trace Viewer: How to Find Why a Test Failed
Playwright trace viewer guide: record traces on retry, open trace.zip, read each panel, and sort a failure into a test bug or an app bug in five checks.
Published on:
The Playwright trace viewer replays the recorded test run action by action, with DOM snapshots, network requests, console logs and errors. Record the traces on the first retry in CI, open the trace.zip with npx playwright show-trace, and then run five checks to determine whether it's the test that's broken or the app that's broken.
TL;DR
The Playwright trace viewer is a GUI that replays a recorded test run from its trace.zip file, one action at a time, with DOM snapshots, the action log, network requests, console output and errors. Open a trace with npx playwright show-trace, or from the HTML report, to see why a test failed after the run ended.
Playwright Trace in CI
- Playwright on-first-retry: Records a trace only on the first retry of a failed test, so passing runs carry no tracing cost. Requires retries: yes. Pair it with retries above zero in CI and upload the HTML report as a build artifact.
- Playwright retain-on-failure: Records a trace for every run but keeps it only for runs that failed. Requires retries: no, so it suits suites that run without retries, at the cost of tracing every test.
- trace.playwright.dev: The hosted Playwright trace viewer loads a trace.zip entirely in your browser. Uploads trace data: no, so a trace downloaded from a CI artifact can be opened there without sending it anywhere.
Debug Failed Playwright Tests
- Playwright test bug: A missing element in the trace's DOM snapshot, or repeated actionability waits in the Log panel, points to the test itself, such as an outdated locator or a timing assumption.
- Playwright app bug: A failed API response in the trace's Network panel, or an uncaught JavaScript error in the Console panel, points to the environment or the app, so the test should stay red.
Confirm an App Bug Outside the Test
- Kane CLI: Kane CLI by TestMu AI replays the same user journey from a plain-English objective in a real Chrome browser and saves an evidence pack, which confirms an app bug outside your Playwright test code.
What Does the Playwright Trace Viewer Show?
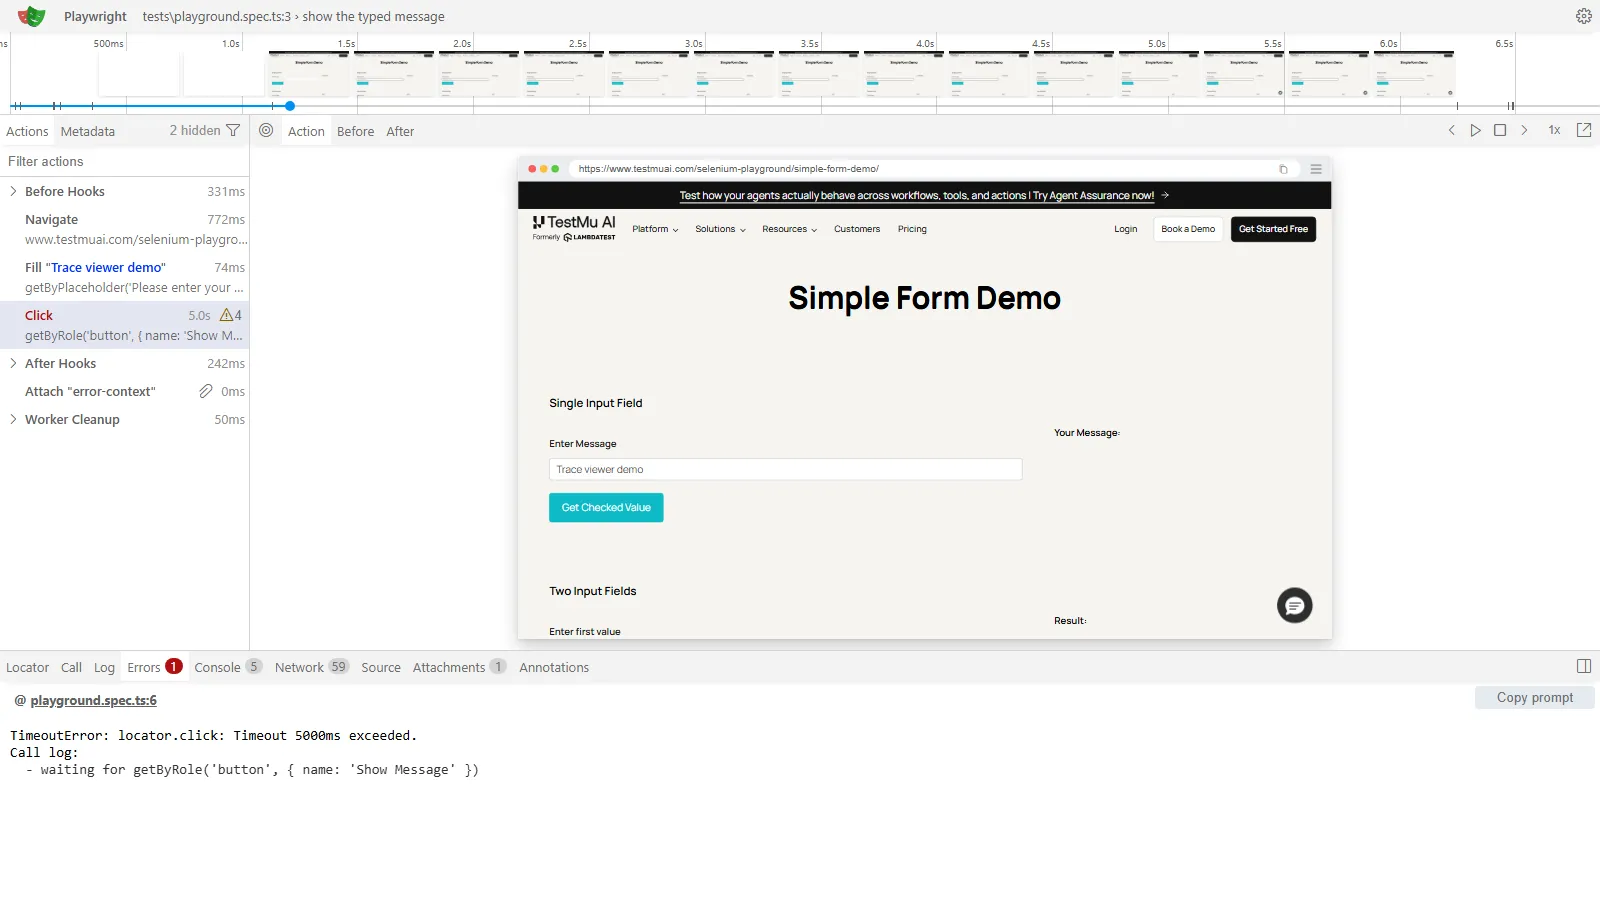
A Playwright trace is a trace.zip file that gets generated as your test runs. The trace viewer opens that up and allows you to step through every action afterward. It's by far the most useful tool when you've got a failure that you can't reproduce on your machine (e.g., a test that only fails in CI).
The Playwright trace viewer docs describe these panels:
| Panel | What it shows | What it answers |
|---|---|---|
| Actions | Each action, the locator it used, and how long it took | Which step failed, and how long it waited? |
| Metadata | Browser, viewport size, test duration | Did CI run a different browser or viewport than you? |
| Call | Duration, locator, strict mode, key used | What exactly did Playwright try to do? |
| Log | Playwright's internal steps, such as scrolling into view and waiting for stability | Was the element visible, stable and enabled? |
| Errors | Error messages, with a red line on the timeline where the error happened | What was the first error, not the last? |
| Console | Browser and test console logs | Did the page throw a JavaScript error? |
| Network | Requests, sortable and inspectable | Did an API call fail, slow down, or return the wrong data? |
| Source | The line of test code for the selected action | Which line do I fix? |
| Attachments | Visual comparison screenshots and image diffs | What changed on screen? |
| Screenshots | A film strip of the page over time, with a timeline you can filter actions by | When did the page change? |
| Snapshots | DOM snapshots of the page for the selected action | What did the page look like at that step? |
This is even more pertinent now that Playwright agents are capable of fixing failing tests. According to the Playwright docs, the "healer" will re-play the failing steps, inspect the current UI and propose a fix (e.g., a locator update, a wait adjustment or a data fix). Someone still has to verify that the proposed patch actually matches what the trace shows.
How Do You Record a Playwright Trace?
Playwright records traces via the trace option. The trace viewer intro suggests you record on the first retry, so your pass runs will stay fast:
// playwright.config.ts
import { defineConfig } from '@playwright/test';

export default defineConfig({
  retries: process.env.CI ? 2 : 0,
  use: {
    trace: 'on-first-retry',
  },
});
The trace option reference lists seven modes:
| Mode | What it records and keeps | When to use it |
|---|---|---|
'on-first-retry' | Only the first retry of a test | Default for CI |
'on-all-retries' | Every retry | Flaky tests that fail differently each time |
'retain-on-failure' | Every run, kept only for runs that failed (kept even if a later retry passes) | Suites without retries |
'retain-on-first-failure' | Only a test's first run (not retries), kept only if it failed | Lowest cost while still catching the first failure |
'retain-on-failure-and-retries' | Every run, kept for any failed run or retry | Investigating a flaky test in depth |
'on' | Every run | Short local sessions; the trace viewer docs call it performance heavy |
'off' | Nothing | When you don't need traces |
To force tracing for one local run, use npx playwright test --trace on. Outside the test runner, the library API records a trace around any block:
await context.tracing.start({ screenshots: true, snapshots: true });
// ... the steps you want to record ...
await context.tracing.stop({ path: 'trace.zip' });
How Do You Open a trace.zip File?
There are three ways to open a trace:
- From the HTML report: run
npx playwright show-report, then click on the trace icon next to the test or open the Traces tab in its detail view. - From the command line:
npx playwright show-trace path/to/trace.zip - From a URL:
npx playwright show-trace https://example.com/trace.zipwill open up a remote trace directly, which is very useful when your CI is storing its artifacts behind a link.
The docs also state that the browser-based viewer at trace.playwright.dev loads the entire trace into your browser and doesn't send anything anywhere.

When the trace says the app is broken, prove it in one command.
Note: Kane CLI runs the same user journey (starting with a plain English objective) in a real Chrome browser and saves the steps, screenshots, logs, and verdict into an evidence pack which you can attach to the bug. Install it via npm install -g @testmuai/kane-cli. Get started with Kane CLI.
How Do You Read a Trace to Find the Cause? (The 5-Check Trace Triage)
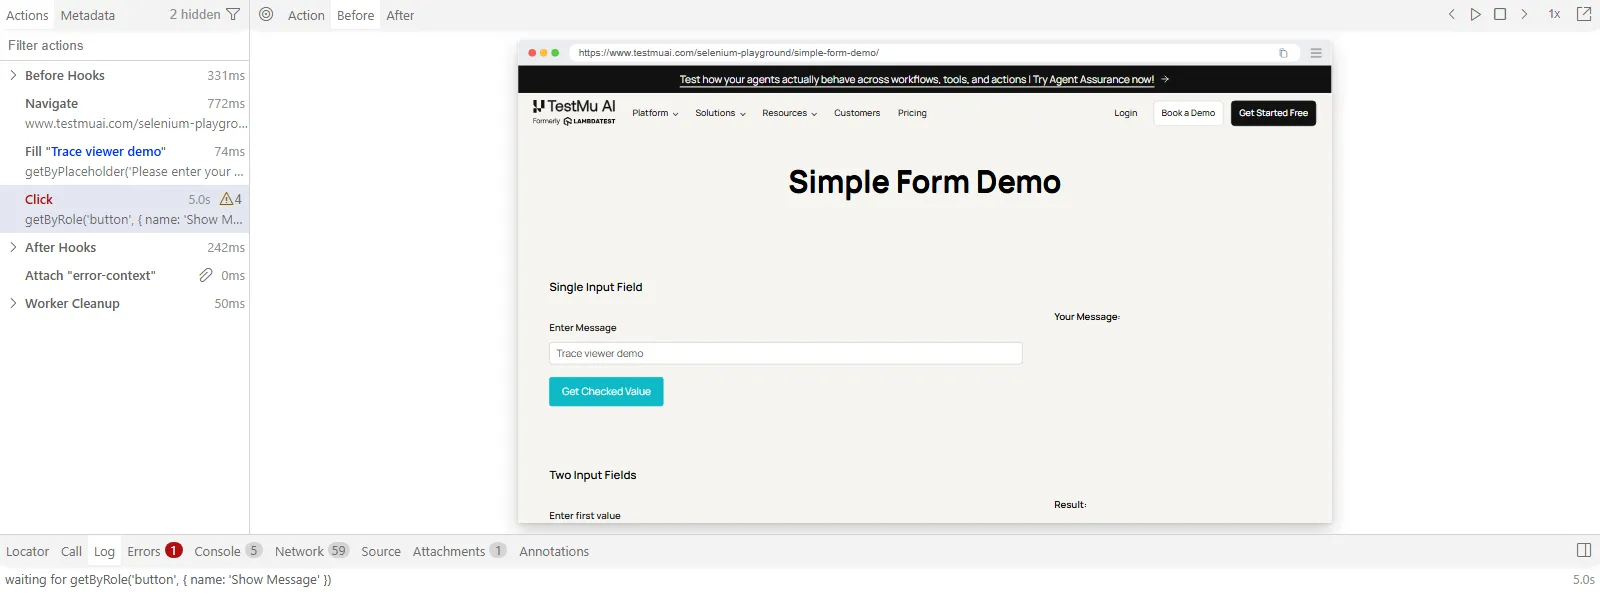
The vast majority of failures fall into 5 categories. Run the checks in order and stop at the first one that explains the failure. That's the 5-check trace triage.
| # | Check | Panels | What to look for | Usually means | Fix in |
|---|---|---|---|---|---|
| 1 | Find the first error | Errors + Source | The first red mark on the timeline, not the final assertion | Later errors are often side effects | Start at this step |
| 2 | Was the element there? | Actions + Snapshots | The "before" snapshot has no matching element, or a different label | Locator out of date | Test |
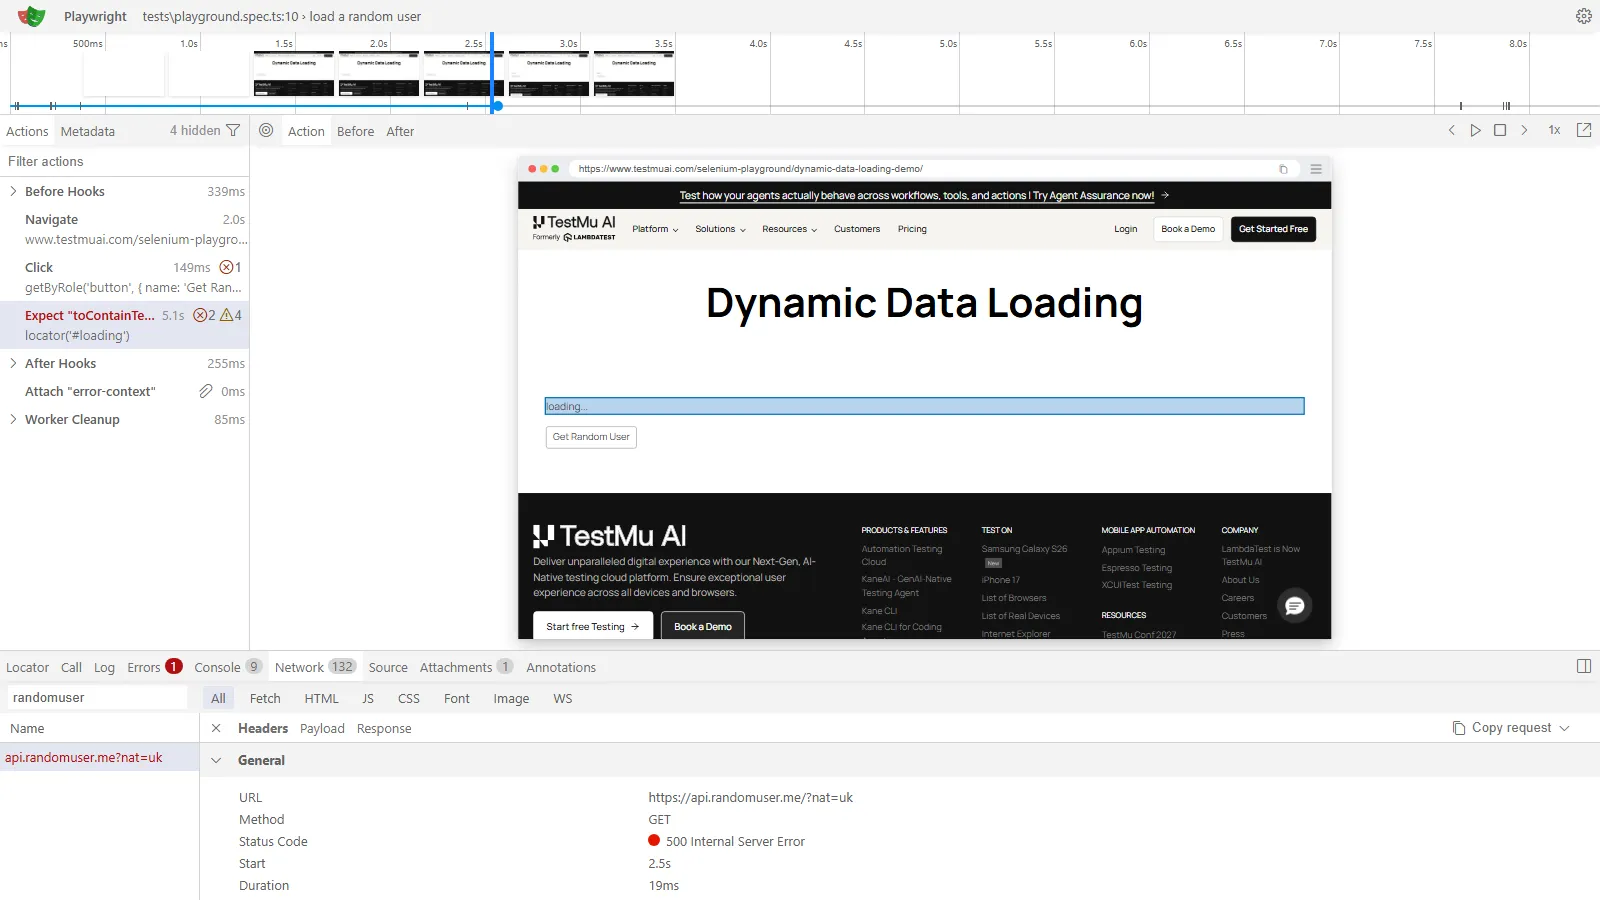
| 3 | Was it ready? | Log + Call | Repeated waits for visible, stable, or enabled, then a timeout | Timing or actionability | Test (wait on a state, not a delay) |
| 4 | Did the data arrive? | Network | A failed, slow, or unexpected API response before the step | Backend, test data or environment | Environment or app |
| 5 | Did the page break? | Console | An uncaught JavaScript error near the failed step | App bug | App |
Two rules keep this honest:
- Compare against a passing trace. If the test passes locally, then record a trace of the passing run with
--trace onand compare the same step side by side. The difference is usually in the Network or Metadata panel. - Don't fix the test to make it match a broken app. If checks 4 or 5 are going to explain the failure, then the test has done its job. Fixing the locator or adding a wait would simply be hiding the bug.
Playwright's healer agent works on the same principle. You add the agent definitions via npx playwright init-agents --loop=vscode (the Playwright test agents docs will show you that command and list VS Code, Claude Code, Codex and OpenCode as the loops). The docs state that the healer's output is a passing test or a skipped test if the healer determines the functionality is broken.
For a quick visual walkthrough of this concept, watch the video below from TestMu AI.

Subscribe to the TestMu AI YouTube channel for more tutorials on testing and automation.
How Do You Confirm an App Bug Prior to Logging It?
When the trace points at the app (checks 4 and 5), the next question is whether the user actually hits that problem or whether it's just the test that does. Re-run the user journey outside of your test code. That's what Kane CLI / TestMu AI's terminal testing agent does, starting from a plain English objective.
npm install -g @testmuai/kane-cli
kane-cli login
kane-cli run "Add the first product to the cart, open checkout, and verify the order summary shows a total" \
  --url https://staging.example.com
The command follows the kane-cli run "<objective>" [options] format in the Kane CLI reference, where --url sets the start URL. Each run saves an evidence pack with the steps, screenshots, logs, and verdict, which the Kane CLI product page says uploads to Test Manager by default. Per the Kane CLI CI/CD docs, kane-cli run exits with 0 for pass, 1 for fail, 2 if the run didn't start, and 3 for a timeout or cancellation.
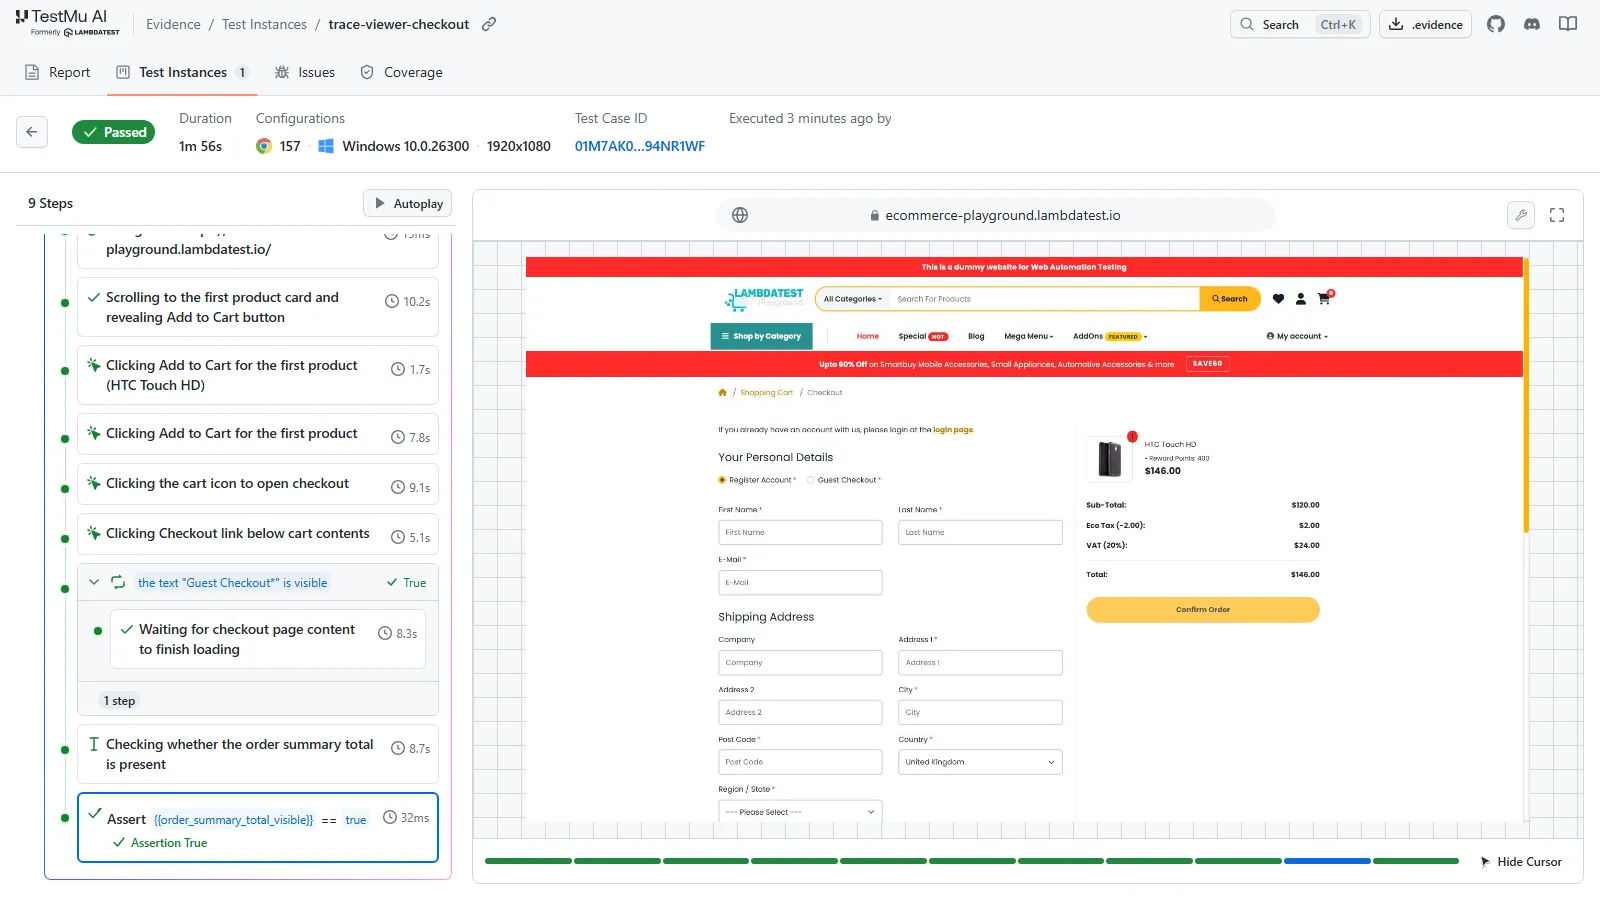
- Kane CLI fails at the same step (the app is broken for users). File the bug with the trace and the evidence pack, and keep the test failing.
- Kane CLI passes: the user journey works, so the failure is in the test (its data or its environment). Go back to checks 2 to 4.
The Kane CLI product page also states that its healing will never change the acceptance criteria and that wrong results are reported as bugs rather than being healed into a pass. That's the property you want from a second opinion.
How Do You Use Traces in CI?
The trace viewer docs state that traces should run in CI on the first retry of a failed test. In practice:
- Set retries to something above zero in CI and
trace: 'on-first-retry'. - Upload the HTML report as a build artifact so that the traces survive the job.
- Download the artifact, extract it, and run
npx playwright show-reporton that folder, then open the trace for the failed test. - Run the 5-check trace triage before you re-run anything. A green re-run with no diagnosis is just hiding a flaky test.
The upload step from Playwright's CI guide for GitHub Actions:
- uses: actions/upload-artifact@v5
  if: ${{ !cancelled() }}
  with:
    name: playwright-report
    path: playwright-report/
    retention-days: 30
The guide says the downloaded report requires a web server, so you need to open it via npx playwright show-report rather than just double-clicking the HTML file. If a test fails in CI but passes locally, then refer to TestMu AI's guide to Playwright flaky tests for the usual suspects.
Keep in mind that 'on' will record every test, and the docs refer to it as performance-heavy. Use 'retain-on-failure' if you're running without retries.
Trace Viewer vs Inspector vs HTML Report: Which Do You Need?
| Tool | How to open it | Use it for |
|---|---|---|
| Trace viewer | npx playwright show-trace trace.zip | Reviewing a finished run, especially a CI failure |
| Inspector | page.pause() or debug mode | Stepping through a test live on your machine |
| HTML report | npx playwright show-report | Seeing all results, then opening a test's trace |
For the live debugging side of things, TestMu AI's guide to the Playwright Inspector covers breakpoints and live locator editing.
The Trace-First Debugging Checklist
- CI sets retries to be above zero and
trace: 'on-first-retry'. - Trace files are saved as CI artifacts on all failed runs.
- You start at the first error on the timeline rather than the last assertion.
- You check the Snapshots tab prior to touching a locator.
- You check the network and the console before you add a wait.
- You're comparing with a passing trace when the test passes locally.
- App bugs are confirmed outside of the test code and are then filed with evidence. The test remains red.
- Any healer or AI fix is reviewed against the trace prior to merge.
Conclusion
Open the trace from your most recent CI failure and run the five checks. If it's pointing at the app, then confirm the journey with the Kane CLI before you touch a line of test code. Install the Kane CLI and keep the trace and the evidence side by side in the bug.
If your suite records no traces yet, add trace: 'on-first-retry' and retries above zero to playwright.config.ts first, so the next red build leaves a trace.zip to open.
Testing from the terminal? Kane CLI by TestMu AI lets SDETs and developers plan, write, run and debug tests from the command line.
Author

Sri Harsha
Blogs: 10

Sri Harsha is Engineering Manager of the Open Source Program Office at TestMu AI, where he leads open-source engineering behind the Selenium and Appium automation grid and builds agentic AI systems for quality engineering. He is a member of the Selenium Technical Leadership Committee and a committer to WebdriverIO and Appium, and was recognized with the LambdaTest Delta Award 2023 for Best Contributor in open-source testing. He brings over 10 years of experience in software testing and automation, with earlier roles at EPAM Systems and ZenQ. Sri Harsha holds a B.Tech in Computer Science from Jawaharlal Nehru Technological University.
Reviewer

Mayank Bhola
Reviewer
Mayank Bhola is Co-Founder and Head of Products at TestMu AI, where he leads the entire product portfolio across KaneAI, Kane CLI, HyperExecute, SmartUI, the Real Device Cloud, Accessibility, and other software testing product lines. As an early Lead Architect he designed and built the company's flagship Tunnel technology from scratch, created the React-based automation platform, and architected the data-intensive pipelines and FAAS services that scale it. He brings more than 10 years of experience in software development and product engineering, with earlier roles as Head of Technology at Juggernaut Books and Senior Software Engineer at PressPlay TV and Zomato. Mayank holds a B.Tech in Computer Engineering from JIIT Noida.


Playwright Trace Viewer FAQs
Did you find this page helpful?
More Related Blogs

TestMu AI forEnterprise
Get access to solutions built on Enterprise
grade security, privacy, & compliance
- Advanced access controls
- Advanced data retention rules
- Advanced Local Testing
- Premium Support options
- Early access to beta features
- Private Slack Channel
- Unlimited Manual Accessibility DevTools Tests