

Power Your Software Testing with AI Agents and Cloud
The Native AI-Agentic Cloud Platform to Supercharge Quality Engineering. Test Intelligently and Ship Faster.


- TestMu AI (Formerly LambdaTest)
- /
- Learning Hub
- /
- Reliability Testing: Methods, Metrics, and Examples
Reliability Testing: Methods, Metrics, and Examples
Learn reliability testing across software, hardware, and research: types, MTBF and MTTF formulas, test plans, reports, growth models, and tools.
Last Updated on:
On This Page
- Overview
- What Is Reliability Testing
- Reliability Domains
- Why It Matters
- Types
- Example
- Reliability Test Plan
- How To Perform
- Metrics And Formulas
- Reliability Test Report
- Growth Models
- In The Development Process
- Hardware Reliability Testing
- Form Factor Standards
- Research And Psychometrics
- Testing Tools
- Best Practices
- Where To Start
- Frequently Asked Questions (FAQs)
OVERVIEW
Overview
Reliability testing measures whether a system keeps performing its intended function, without failure, over a defined period under defined conditions. In software it combines load, stress, endurance, and recovery testing, then quantifies the result with metrics such as MTBF, MTTF, and availability so teams can predict failure before users meet it.
Which Reliability Testing Applies to Your Work?
- Software reliability: Proves an application keeps serving correct responses under sustained load and recovers cleanly after a fault. Measured with MTBF, availability, error rate, and response-time percentiles collected across a long-running test.
- Hardware reliability: Proves a physical product survives heat, vibration, and moisture across its expected life. Measured through accelerated stress methods such as HALT and ALT, which force failures early so a design can be strengthened before production.
- Psychometric reliability: Proves a test or questionnaire produces consistent scores across time, raters, and items. Measured with test-retest, interrater, parallel forms, and internal consistency coefficients such as Cronbach's Alpha.
How Do You Measure Software Reliability?
Run a representative journey in a loop, record latency and failures on every pass, then convert the run into MTBF, error rate, and R(t). Keeping the environment constant across runs is what makes the numbers comparable, which is why endurance loops are usually executed on a cloud grid such as TestMu AI rather than on a developer laptop.
Reliability testing is the part of the software development process that answers a question functional testing cannot: not whether a feature works once, but whether it keeps working. It incorporates results from functional and non-functional testing to expose the design weaknesses that only appear under sustained use.
The term carries three distinct meanings across software engineering, hardware engineering, and research methodology. This guide covers all three, starting with software, and gives you the formulas, the plan template, and the report structure for each.
What Is Reliability Testing?
Reliability testing is a method for evaluating the ability of a system or product to perform its intended functions under stated conditions for a stated period. It identifies the failures likely to occur across the product's lifespan and estimates how probable each one is.
In software, that means running the system long enough and hard enough for time-dependent defects to surface: memory leaks, connection-pool exhaustion, log-file growth, certificate expiry, and race conditions that a five-minute functional suite never reaches. It draws on production testing, functional testing, security testing, and stress testing to build a picture no single test type provides.
What Are the Three Domains of Reliability Testing?
The three domains are software, hardware and physical products, and research and psychometrics. Each uses the word reliability for a different quantity, each has its own methods and standards, and each reports a different headline metric.
| Domain | What It Validates | Representative Methods | Headline Metric |
|---|---|---|---|
| Software | Whether an application performs consistently under load, stress, and time without failures | Load testing, stress testing, endurance testing, recovery testing | MTBF, availability, error rate |
| Hardware and physical products | Whether equipment survives thermal, vibration, humidity, and mechanical stress across its lifespan | HALT, ALT, MEOST, thermal cycling, vibration testing, IP rating checks | MTTF, failure rate |
| Research and psychometrics | Whether a test or measurement produces consistent scores across time, raters, and items | Test-retest, interrater, parallel forms, internal consistency | Cronbach's Alpha, correlation coefficient |
Why Does Reliability Testing Matter?
It matters because reliability defects need time or volume to express themselves, so no functional test catches them. Without a dedicated reliability run, the first thing to exercise a memory leak or an untested failover path is production traffic.
- Time-dependent defects surface before release rather than during a peak-traffic incident. A memory leak that takes nine hours to exhaust a heap is invisible to a CI suite that finishes in eleven minutes.
- Failure behavior becomes predictable, so teams can set an error budget and an availability target that the data actually supports instead of a number picked in a planning meeting.
- Recovery paths get exercised. Failover, retry, and reconnect logic is usually written once and never tested, and reliability runs are where it either works or is proven not to.
- Repair cost drops because the fix lands in development rather than in a hotfix under incident pressure, with the rollback and customer-communication overhead that implies.
- Regulated industries get evidence. Medical, automotive, and aerospace programs must show documented reliability figures, and the test report is that evidence.
What Are the Types of Reliability Testing?
The main types are load, stress, endurance, recovery, fault injection, regression, and performance testing, plus statistical analysis for forecasting. Each attacks a different failure mode, and a serious reliability effort runs several of them against the same build.
- Load testing holds the system at expected peak concurrency and checks that throughput and response time stay within target. It answers whether the system copes with the traffic you plan for.
- Stress testing pushes past that peak until something breaks, to find the breaking point and confirm the system degrades gracefully rather than corrupting data on the way down.
- Endurance testing, also called soak testing, holds a moderate load for hours or days. This is the run that catches memory leaks, connection-pool exhaustion, and unbounded log growth.
- Recovery testing kills a dependency, a node, or the process itself, then measures whether the system returns to normal service and how long it takes. The output feeds directly into MTTR.
- Fault injection deliberately introduces faults such as network latency, packet loss, or a failing disk, to verify the system detects and handles them. Applied systematically to distributed systems this becomes chaos testing.
- Regression testing confirms a reliability fix did not reintroduce an old failure, and that new features have not degraded a previously stable path.
- Performance testing profiles response time and resource use under varying conditions, supplying the latency percentiles a reliability verdict is judged against. The two overlap heavily: a reliability run is largely a performance run held for far longer and judged on failures rather than on speed.
- Statistical analysis models failure data from previous runs and field usage to forecast future reliability, rather than measuring it directly.
What Is an Example of Reliability Testing?
A typical example repeats one representative user journey against a fixed build for a set duration, recording latency and failures on every pass, then converts the run into an error rate and a latency percentile. On mobile the equivalent drives the app's core journeys for 24 hours while memory, battery, and crash counts are sampled.
On the web the journey usually mirrors whatever web performance testing already covers, with one change: instead of measuring a single page load, the same journey is repeated until time-dependent faults have a chance to appear.
What We Measured on a Real 25-Iteration Run
We ran this loop ourselves while writing this guide, so the numbers below are measured rather than illustrative. We pointed a test tool loop at the Simple Form Demo on the Selenium Playground, driving it 25 times through a real Chrome browser on the TestMu AI cloud grid. Each pass loaded the page, typed a message, submitted it, and waited for the rendered result before recording its latency.
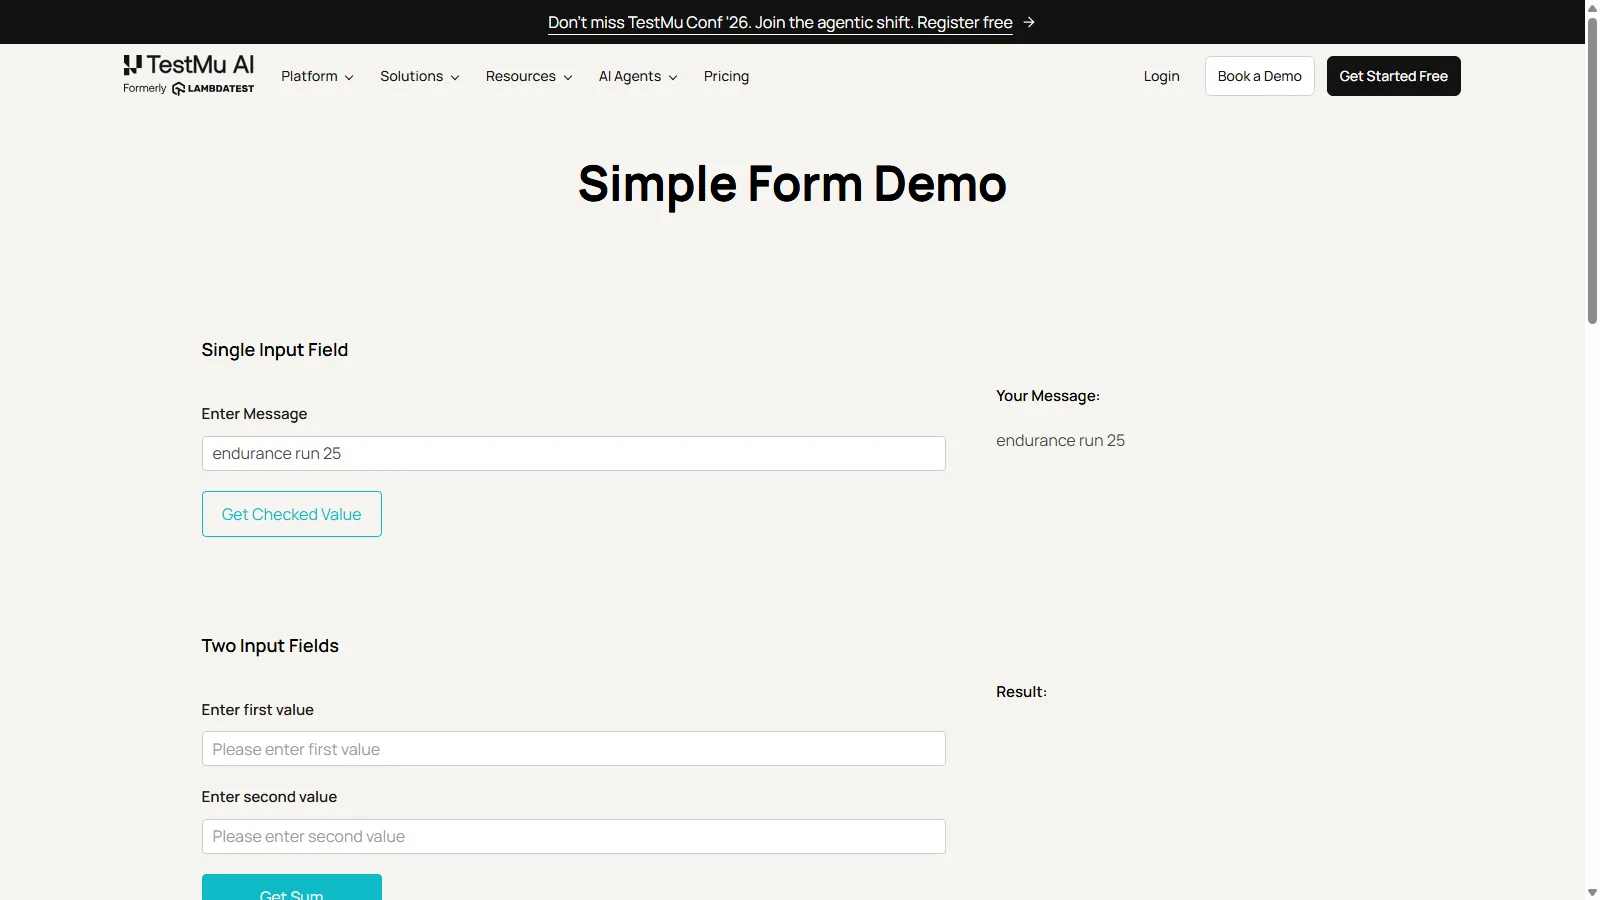
That screenshot is iteration 25 of the run, captured on the grid: the message was typed into the input and echoed back under Your Message, which is the assertion each pass waited on. Here is the loop that produced it.
import { chromium } from 'playwright-core';

const caps = {
  browserName: 'Chrome',
  browserVersion: 'latest',
  'LT:Options': {
    platform: 'Windows 11',
    build: 'Reliability Testing Hub - Endurance Loop',
    name: 'Endurance loop - 25 iterations',
    user: process.env.LT_USERNAME,
    accessKey: process.env.LT_ACCESS_KEY,
    console: true,
    network: true
  }
};

const browser = await chromium.connect(
  'wss://cdp.lambdatest.com/playwright?capabilities=' +
  encodeURIComponent(JSON.stringify(caps))
);
const page = await browser.newPage();

const latencies = [];
let failures = 0;

for (let i = 1; i <= 25; i++) {
  const started = Date.now();
  try {
    await page.goto('https://www.testmuai.com/selenium-playground/simple-form-demo/',
      { waitUntil: 'domcontentloaded', timeout: 30000 });
    await page.fill('#user-message', 'endurance run ' + i);
    await page.click('#showInput');
    await page.waitForSelector('#message', { timeout: 10000 });
    latencies.push(Date.now() - started);
  } catch (err) {
    failures++;
  }
}

latencies.sort((a, b) => a - b);
const avg = Math.round(latencies.reduce((a, b) => a + b, 0) / latencies.length);
const p95 = latencies[Math.ceil(latencies.length * 0.95) - 1];

console.log('passed=' + latencies.length + ' failed=' + failures);
console.log('error rate = ' + ((failures / 25) * 100).toFixed(1) + '%');
console.log('latency ms: min=' + latencies[0] + ' avg=' + avg + ' p95=' + p95);

await browser.close();
The run printed this:
---- RESULTS ----
iterations=25  passed=25  failed=0
error rate = 0.0%
latency ms: min=874  avg=987  p95=1273  max=1696
total wall clock = 25s
The result taught us the limit of a short run as much as anything about the system. A 0.0% error rate across 25 iterations passes the error-rate criterion and gives a usable latency baseline, 987 ms average against a 1273 ms p95. It says nothing about MTBF, because no failure occurred to measure a time between. Getting a meaningful MTBF out of a journey this stable would have meant running it for hours, not 25 seconds, which is exactly why endurance runs are scheduled overnight rather than in a pull-request pipeline.
Test website responsiveness on different pre-installed mobile device viewports. Try LT Browser 2.0 Now!
How Do You Create a Reliability Test Plan?
Start by writing a numeric reliability target, then work outward to scope, test types, workload, environment, and exit criteria. That target is what separates a reliability test plan from a functional one, because without it there is no criterion the run can pass or fail against.
- Define the scope. Name the exact build, the components in and out of scope, and the user journeys that will be driven. A reliability figure is only valid for the configuration that produced it.
- State the reliability target as a number. For example, 99.9% availability over 30 days, or an MTBF of at least 400 operating hours, or an error rate under 0.1% across a 12-hour soak.
- Choose the test types that attack your risk. A stateless read API needs load and endurance runs; a payment service needs recovery and fault-injection runs as well.
- Specify the workload profile. Concurrency, think time, data volume, and the mix of journeys, since a soak at the wrong mix measures a system nobody uses.
- Fix the environment. Record the test environment topology, instance sizes, and the test data set, because a reliability number from an environment you cannot reproduce is not evidence.
- Schedule the duration and set the exit criteria. Decide in advance what result stops the run and what result ships the build.
- Anticipate failure modes. List the failures you expect, the signal each would produce, and the instrumentation that would capture it, so an unattended overnight run is not wasted.
How Do You Perform Reliability Testing?
Instrument first, baseline at low load, execute against a frozen build, record every failure with a timestamp, compute the metrics, then judge the run against the target. Skipping the instrumentation step is the most common way a long run produces no usable answer.
- Instrument first. Enable console and network log capture, application metrics, and resource sampling before the run starts. A failure at hour seven with no logs is an unrepeatable anecdote.
- Establish a baseline with a short run at low load, so you can tell a genuine degradation from normal variance later.
- Execute the run against the fixed build. Follow the test execution schedule from the plan and change nothing mid-run, since a configuration change invalidates every measurement taken before it.
- Monitor while it runs and record every failure with a timestamp, the request in flight, and the system state, rather than only the final tally.
- Compute the metrics from the raw data. Convert the failure log and latency series into MTBF, MTTR, availability, error rate, and percentiles using the formulas in the next section.
- Compare against the target and report. Judge the run against the number set in the plan, then feed each failure into the defect backlog with its measured frequency attached. Sound test design makes this attribution possible.
What Are the Reliability Testing Metrics?
The core metrics are MTBF, MTTF, MTTR, availability, failure rate, and the reliability function R(t). Together they turn a run log into a single number a release decision can be made against.
| Metric | Formula | What it tells you |
|---|---|---|
| MTBF (Mean Time Between Failures) | Total operating time / Number of failures | Average uptime between failures on a repairable system. Higher is better. |
| MTTF (Mean Time To Failure) | 1 / lambda | Average life of a non-repairable component that is replaced rather than fixed. |
| MTTR (Mean Time To Repair) | Total repair time / Number of repairs | How fast service is restored. Lower is better, and it is the metric ops teams control. |
| Availability | MTBF / (MTBF + MTTR) | Proportion of time the system is fit to serve. This is what an SLA percentage expresses. |
| Failure rate (lambda) | Number of failures / Total operating time | Failures per unit time. The reciprocal of MTBF for a constant-rate system. |
| Reliability function R(t) | e^(-lambda x t) | Probability the system survives to time t without failure. |
The reliability function assumes a constant failure rate. The NIST/SEMATECH e-Handbook of Statistical Methods gives the exponential model as R(t) = e^(-lambda t) with MTTF = 1/lambda, and notes that the exponential is the only distribution with a constant failure rate, which is why it models the flat middle of the bathtub curve where most systems spend their working life.
Worked example. A service logs 3 failures across 1,200 hours of operation, and each restoration takes an average of 2 hours.
- MTBF = 1,200 / 3 = 400 hours between failures.
- Failure rate lambda = 3 / 1,200 = 0.0025 failures per hour.
- Availability = 400 / (400 + 2) = 0.9950, or 99.50% uptime.
- R(24) = e^(-0.0025 x 24) = e^(-0.06) = 0.9418, so roughly a 94.2% chance of running a full day without failure.
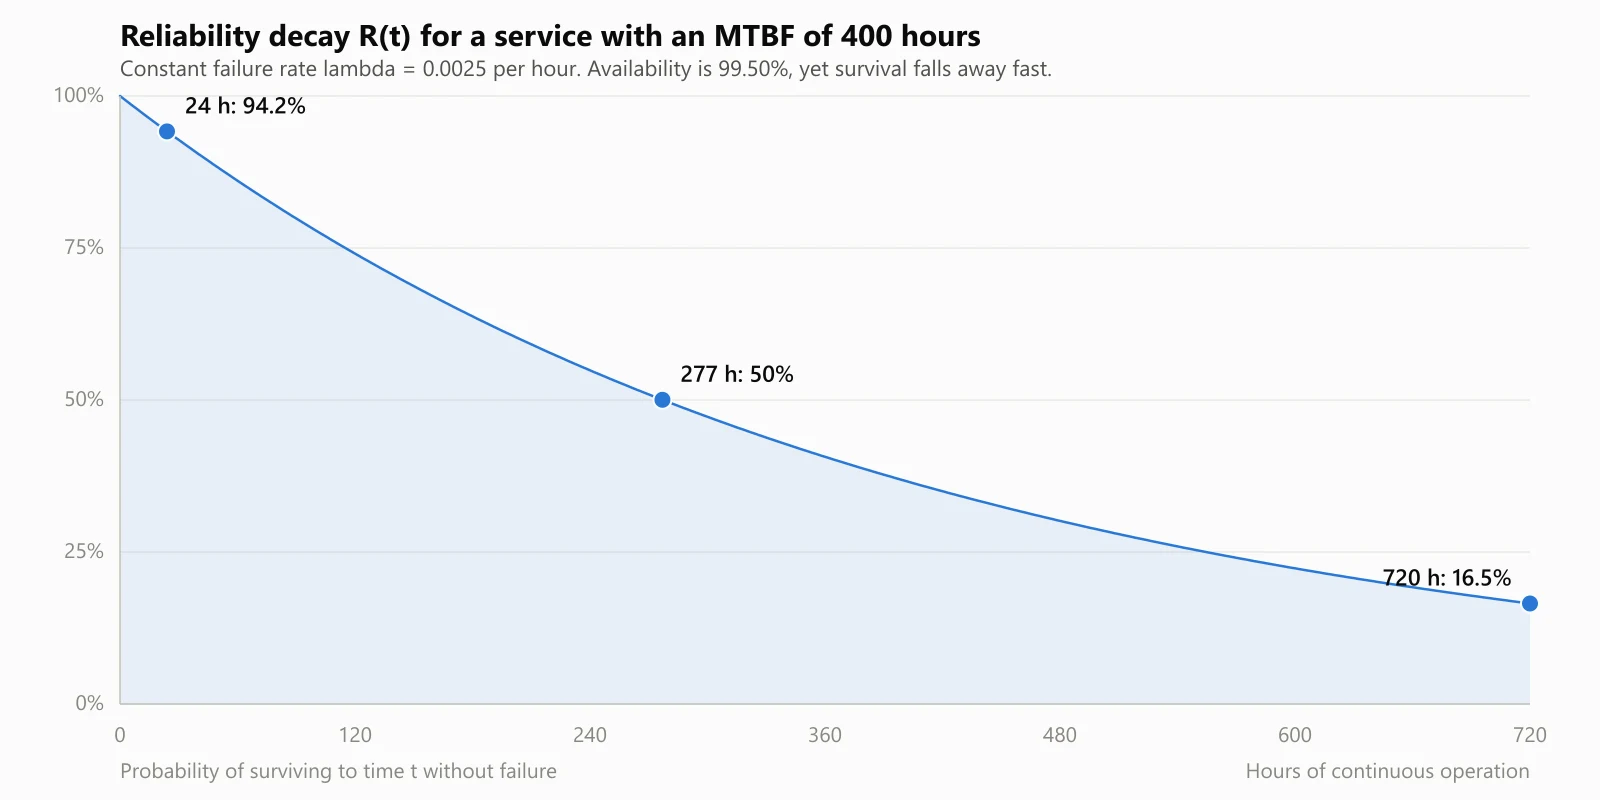
Plotting R(t) for that same service shows why availability alone is a weak release gate. The 99.50% headline holds, yet the chance of surviving without a failure falls to a coin flip by hour 277 and to 16.5% across a 30-day month. A service can report an impressive availability figure and still be near-certain to fail inside the window a customer actually cares about, so quote R(t) over that window rather than the headline percentage.

Note: Reliability defects show up as a pattern across runs, not in a single red build. TestMu AI Test Insights ranks consistently-failing tests by how often they fail, clusters similar errors into categories, and reports a stability score across the whole history so the flakiness backlog is built from data instead of from whichever failure was loudest. Start free!
What Should a Reliability Test Report Contain?
Eight sections: objective and target, build and environment, workload and duration, measured metrics, failure log, trend comparison, verdict, and prioritized actions. A run that produces no reproducible document has produced nothing an auditor, a release manager, or the next engineer can use.
- Objective and reliability target, quoted verbatim from the test plan so the verdict is judged against the criterion agreed before the run.
- Build and environment, naming the exact version under test, topology, instance sizes, and dataset.
- Workload profile and duration, covering concurrency, journey mix, think time, and the total operating hours the metrics are computed from.
- Measured metrics, giving MTBF, MTTF where applicable, MTTR, availability, error rate, and response-time percentiles rather than an average alone.
- Failure log, listing every failure with its timestamp, the operation in flight, the observed symptom, and the suspected cause.
- Trend comparison against the previous run on the same journey, since a single reliability number carries far less information than its direction of travel.
- Verdict, stating pass or fail against the target explicitly, with the shortfall quantified when it fails.
- Prioritized actions, ranking each defect by measured failure frequency and estimated impact so the backlog order follows the data.
The trend section is the one most often skipped and the one that matters most. TestMu AI's Test Insights assembles that view automatically from records the platform already holds, plotting pass/fail and duration trends across builds and surfacing consistently-failing tests through failure-frequency analysis. Its agentic Root Cause Analysis correlates network, console, and framework logs to localize a likely cause for a specific failure, which is a strong lead to verify rather than a verdict to act on blindly. The Insights Dashboard documentation covers the available widgets and filters.
What Is a Reliability Growth Model?
A reliability growth model fits observed failure data to a curve and extrapolates it, describing the trajectory across builds rather than the state of one. It answers whether a program will hit its reliability target before the ship date or needs more test-fix cycles.
The NIST/SEMATECH handbook documents the Non-Homogeneous Poisson Process power law model, noting that it is also called the Duane model and the AMSAA model, and that it can represent either improving or worsening reliability depending on its shape parameter. During a test-fix-test program the improving case is the one you want to see, and the fitted curve is the evidence that the fixes are working rather than merely being shipped.
Where failures arrive at a steady rate instead, the simpler Homogeneous Poisson Process applies, in which the expected number of failures by time T is simply lambda multiplied by T. A steady rate across successive builds is itself a finding, because it means the defects being fixed are not the ones causing the failures.
Machine learning is increasingly applied to the same problem, training on historical run data and field telemetry to flag which components are likely to fail next. The same shift is visible in AI in performance testing, where models forecast degradation instead of waiting for a threshold to trip. Treat those predictions the way you treat any model output: as a prioritization signal for where to point the next endurance run, not as a substitute for running it.
The same idea applies to the workload itself. Rather than holding one fixed concurrency for the whole run, AI performance testing and load management adjusts the load profile as the run proceeds, which surfaces failure modes a flat soak never reaches.
Where Does Reliability Testing Fit in Development?
At four points: design verification, prototyping, pre-release, and in-field monitoring. The cost of a defect found rises sharply at each one, which is the argument for spending effort at the first two.
- Design verification checks the architecture against the reliability requirement before code exists, through failure-mode analysis and review of redundancy, timeout, and retry decisions. Changes here cost a discussion.
- Prototyping runs short endurance and fault-injection tests against an early build to catch structural problems such as a missing connection-pool limit while the design is still fluid.
- Pre-release runs the full-duration soak against the release candidate in a production-like environment. This is where the numbers that go in the report are produced.
- In-field monitoring compares real-world failure rates against the tested prediction. A large gap means the workload profile in the test plan did not match reality, and the plan gets corrected for the next cycle.
Reliability testing on mobile has an extra variable: the hardware itself. The same build can be stable on a flagship and crash on a three-year-old mid-range device with less memory and a slower network, which is the case for testing on real devices rather than emulators. Sustained runs on that hardware are where mobile performance testing and reliability testing converge, since battery drain, thermal throttling, and memory pressure only show up after the app has been running for hours.
What Is Hardware Reliability Testing?
Hardware reliability testing deliberately pushes a physical product past its normal operating envelope, using heat, cold, vibration, and moisture, to expose design weaknesses before they reach customers. Three accelerated stress methods dominate the domain: HALT, ALT, and MEOST.
Highly Accelerated Life Testing (HALT)
Highly Accelerated Life Testing (HALT) applies escalating stresses, such as rapid thermal cycling, vibration, and combined thermal-plus-vibration steps, to find the operating and destruct limits of a design. Because HALT runs during development, it surfaces weak solder joints, marginal components, and design flaws quickly, so engineers can strengthen the product before production begins.
Accelerated Life Testing (ALT)
Accelerated Life Testing (ALT) estimates how long a product will last by running it under elevated stress levels, then using a statistical model to extrapolate real-world lifespan. Where HALT hunts for failure limits, ALT quantifies expected life and feeds the MTTF and failure-rate figures defined earlier. The extrapolation depends on an acceleration model, most commonly the Arrhenius relationship for temperature-driven failure mechanisms.
Multiple Environmental Over Stress Testing (MEOST)
Multiple Environmental Over Stress Testing (MEOST) applies several environmental stresses at once, and at levels beyond normal ratings, to reproduce the combined conditions a product meets in the field. Applying thermal, vibration, and humidity stress together often reveals interaction failures that single-stress tests miss.
Across all three methods, thermal cycling swings a product between temperature extremes to stress expansion and contraction, vibration testing simulates the shaking of transport and daily use, and humidity chambers check moisture ingress and corrosion. Together they turn a design's hidden weaknesses into visible, fixable failures.
Which Reliability Standards Apply to Phone Form Factors?
Two families apply: mechanical stress tests covering drop, micro-drop, three-point bend, and tumble, and environmental sealing graded by IEC 60529 IP ratings. Before a new iPhone form factor or Android flagship ships, manufacturers run both to decide whether the device survives pockets, drops, spills, and travel.
Mechanical Stress Tests
Mechanical reliability for phones centers on a few repeatable tests. Drop tests release the device from set heights onto hard surfaces to check the frame, glass, and internals. Micro-drop tests repeat very short falls thousands of times to model the constant small knocks of everyday use. Three-point bend tests press on the middle of the chassis to measure structural rigidity, and tumble tests rotate the device inside a rotating drum to combine many low-height impacts in one run.
Ingress Protection (IP) Ratings
Environmental sealing is graded with Ingress Protection (IP) ratings, defined by the IEC 60529 standard and written as IP followed by two digits. The first digit rates protection against solids such as dust, and the second rates protection against water. A rating of IP68, common on flagship phones, means the highest dust protection class and survival during continuous immersion under conditions the manufacturer states, since IEC 60529 leaves the depth and duration for that class to the manufacturer. Reliability testing verifies these IP ratings with dust chambers and water immersion rigs.
Physical stress and IP standards prove the hardware, but the software running on that hardware needs the same scrutiny across a fragmented device market. TestMu AI (Formerly LambdaTest) is a Full Stack Agentic AI Quality Engineering platform with AI agents to plan, author, execute, and analyze tests across web, mobile, and enterprise applications. Its Real Device Cloud gives teams instant access to 10,000+ real Android and iOS devices under real network conditions from 2G to 5G, so an app can be validated for stability on the exact hardware customers hold, without maintaining an in-house device lab.
What Does Reliability Mean in Research and Psychometrics?
Here reliability means how consistently a test measures what it claims to measure, which is a different quantity from software reliability: the consistency of scores, not the survival of a running system. Researchers recognize four types, and the fourth splits into its own measures.
- Test-retest reliability administers the same instrument to the same people on two occasions and correlates the results, checking consistency across time.
- Interrater reliability has multiple observers score the same subject, checking consistency across raters rather than across time.
- Parallel forms reliability administers two equivalent versions of a test and correlates them, checking that the versions are genuinely interchangeable.
- Internal consistency checks whether the individual items within a single test all measure the same underlying construct.
Split-Half Reliability
Split-Half reliability estimates internal consistency by dividing a test into two halves, for example odd-numbered and even-numbered items, scoring each half, and measuring the correlation between the two scores. A strong correlation indicates that both halves measure the same construct, so the test holds together as a coherent instrument.
Cronbach's Alpha
Cronbach's Alpha extends that idea across every possible way of splitting a test, producing a single coefficient between 0 and 1 that summarizes how closely related the items are as a group. Values around 0.70 or higher are commonly treated as acceptable internal consistency in social science research, though the threshold is a convention rather than a rule and depends on the instrument's purpose.
Statistical tools support these estimates without replacing them. ANOVA (Analysis of Variance) compares variation within and between groups and underpins the intraclass correlation used for interrater reliability, but ANOVA is not itself a reliability test. Reliability is the consistency that a coefficient reports, while ANOVA is one of the methods used to compute or check it.
What Tools Do You Need for Reliability Testing?
Four categories, not one tool: a load and endurance generator, fault-injection or chaos tooling, the unit and integration frameworks the loop calls, and an execution grid with analytics over it. A gap in any one of them turns a long run into an unrepeatable anecdote.
Load and Endurance Generators
Apache JMeter and k6 drive sustained concurrency and hold it for hours, which is what separates an endurance run from a load spike. Browser-level tools such as Selenium and Playwright drive real user journeys instead of raw HTTP, so the run exercises rendering and client-side state as well as the backend, as in the loop earlier in this guide. Orchestrating those long runs is its own problem, which is what performance testing with HyperExecute handles by distributing the workload rather than queueing it behind one machine.
Fault Injection and Chaos Tooling
Chaos Toolkit, Chaos Mesh, and the fault-injection primitives built into Kubernetes and most service meshes introduce latency, packet loss, and node termination on demand. These tools test the recovery paths that a load generator never touches, and they are the only practical way to measure MTTR before a real incident supplies the number.
Unit and Integration Frameworks
JUnit, pytest, and similar unit testing frameworks are not reliability tools by themselves, but they are what a reliability loop calls. Wrapping an existing suite in a repeat-until-failure harness is the cheapest way to start measuring reliability without writing new tests.
Execution Grid and Analytics
The last category is the one teams most often improvise, and it is where reliability runs quietly go wrong: a grid that keeps the environment constant across runs, plus analytics that compare the runs to each other. TestMu AI covers both, running suites across 3,000+ browser/OS combinations and 10,000+ real devices, with flaky test detection built on failure-frequency analysis rather than on a single red build. Because the platform holds the execution record from every run, a reliability trend across builds is available without exporting anything into a spreadsheet.
Which layer you instrument decides what the run can tell you. This walkthrough covers building a strategy across both the backend and the frontend, which matters for reliability because a soak that watches only server metrics misses the client-side leaks and rendering faults that surface after hours in a real browser.

Subscribe to our TestMu AI YouTube Channel to get the latest updates on tutorials around Selenium testing, Cypress testing, and more.
Run endurance and recovery suites across 3,000+ browser/OS combinations and 10,000+ real devices. Start Free Testing
What Are the Reliability Testing Best Practices?
Set the target before the run, report percentiles rather than averages, hold the environment constant, run long enough for the failure mode you are hunting, instrument up front, investigate every failure, and track the trend rather than the single number.
- Set the numeric target before the run, not after. A target chosen once the results are in is a description of what happened, not a test.
- Report percentiles, never averages alone. An average latency of 987 ms with a p95 of 1273 ms describes a healthy system; the same average with a p95 of 8 seconds describes a broken one, and the average cannot tell them apart.
- Hold the environment constant across runs, since comparing a soak on a shared staging box against one on dedicated infrastructure measures the infrastructure rather than the build.
- Run long enough for the failure mode you are hunting. A leak that takes nine hours to express itself will pass a four-hour soak every time.
- Instrument before starting rather than after the first failure, because the run that finally reproduces the bug is the one you cannot afford to have logged nothing.
- Investigate every failure, including the ones that look like infrastructure noise. Dismissing failures as flakiness is how a genuine intermittent defect reaches production wearing a disguise.
- Track the trend across builds, not the single number, because reliability improving from 99.0% to 99.4% is a working program and a flat 99.4% for six sprints is a stalled one.
Where Should You Start?
Start by writing one number into your test plan: the availability or MTBF figure the next release has to clear. Then take your existing regression suite, wrap it in the endurance loop from the example section, and run it against a fixed build for long enough to compute an error rate and a p95. That single run gives you a baseline, and everything else in this guide is a refinement of it.
For the execution side, TestMu AI runs those loops on a constant environment across 3,000+ browser/OS combinations and 10,000+ real devices, and its cloud testing setup removes the test infrastructure maintenance that makes long runs expensive to repeat. Pair it with parallel testing to shorten the wall-clock cost of a wide reliability matrix, and read the Insights Dashboard documentation linked above to set up the trend view before your first long run rather than after it.
Author

Veethee Dixit
Blogs: 9


Veethee Dixit is a seasoned content strategist and freelance technical writer specializing in SaaS platforms and AI-driven testing technologies. She has over 8 years of hands-on experience writing SEO focused technical content, simplifying complex topics in software testing, and collaborating with product marketing teams to develop high converting blogs, documentation, whitepapers, and tutorials. She holds a Bachelor of Engineering in Computer Science and has authored 50+ learning hub articles in the software testing domain. Her work has been featured in leading software testing newsletters and cited by top technology publications. Veethee has played a key role in translating complex testing workflows into actionable guides, helping audiences implement automation strategies with clarity and confidence.
Reviewer

Rohit Mehta
Reviewer
Rohit Mehta is the Quality Engineering and Testing Practice Head at Pratham Software (PSI), with 15+ years of experience across enterprise and SaaS platforms. He builds AI-driven QA practices that enable faster releases, lower risk, and predictable quality at scale, leading QA strategy, AI adoption, and governance across programs. His expertise includes intelligent test generation, self-healing automation, regression optimization, predictive analytics, and CI/CD-integrated quality practices. He wrote the book Software Testing Revolution Using AI: The Future of Quality Engineering, and on TestMu AI (formerly LambdaTest) he published a guide on conversational AI testing. He holds an MS in Software Systems from BITS Pilani.


Reliability Testing FAQs
Did you find this page helpful?
More Related Learning Hubs
TestMu AI forEnterprise
Get access to solutions built on Enterprise
grade security, privacy, & compliance
- Advanced access controls
- Advanced data retention rules
- Advanced Local Testing
- Premium Support options
- Early access to beta features
- Private Slack Channel
- Unlimited Manual Accessibility DevTools Tests