
Run JMeter and Gatling Load Tests in the Cloud
Test How Your Website Handles Heavy Traffic. Simulate Up to 8,000 Users at Once and See Response Times and Errors Live.

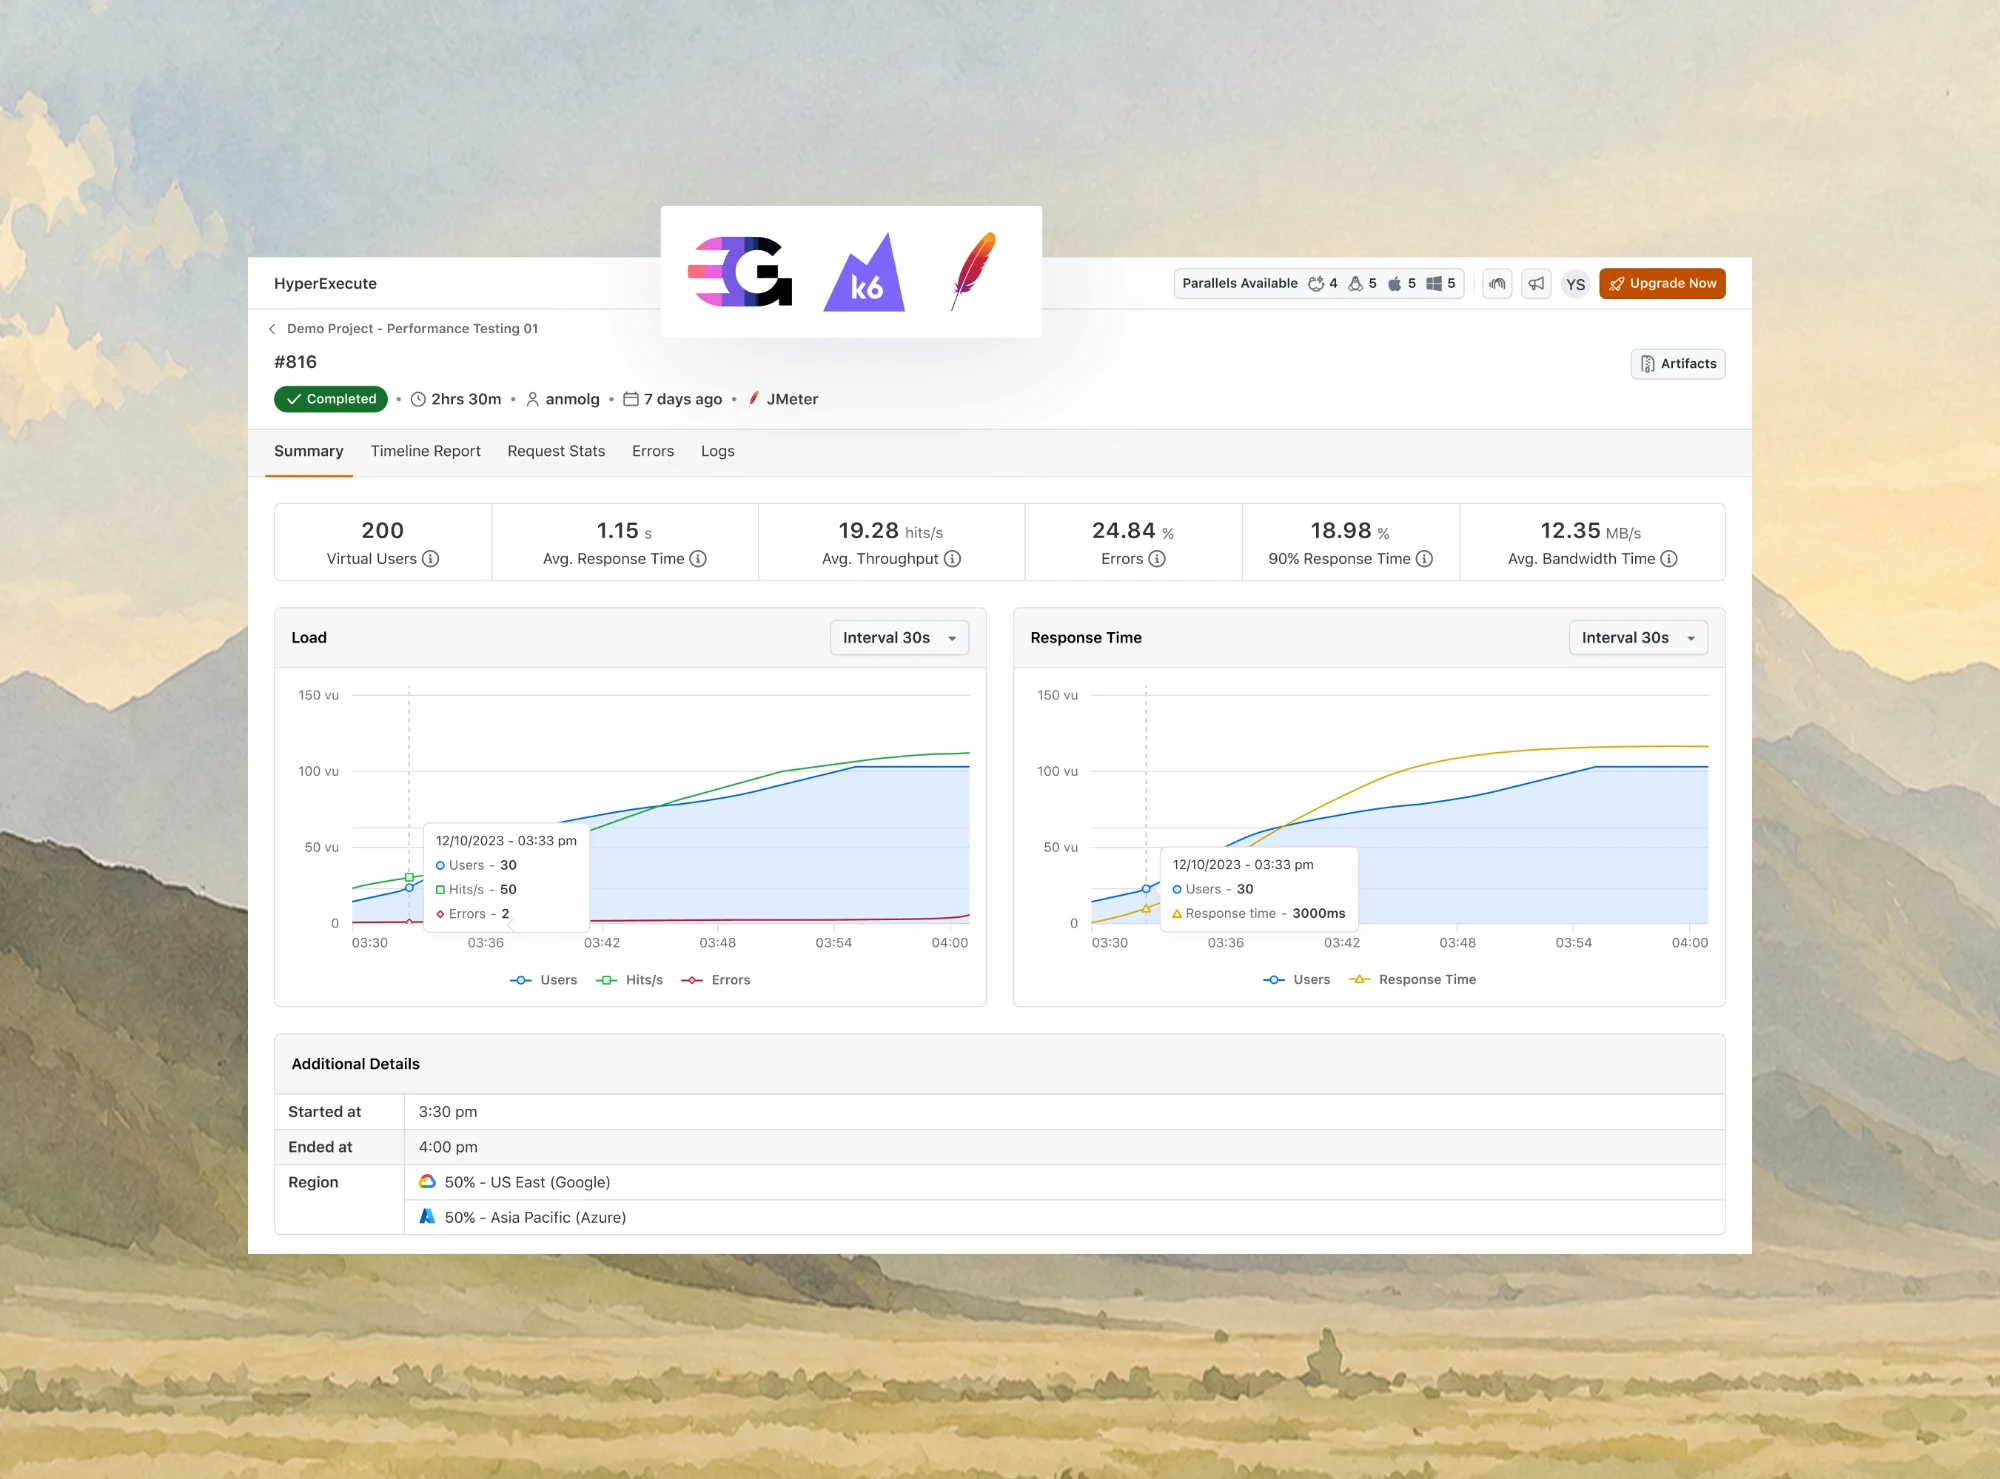
- TestMu AI (Formerly LambdaTest)
- /
- Use Cases
- /
- Run JMeter, k6 and Gatling Scripts with HyperExecute's Performance Testing
Run JMeter, k6 and Gatling Scripts with HyperExecute's Performance Testing
Distributed load testing on TestMu AI HyperExecute: run JMeter, k6 and Gatling scripts across machines, merge their results, and fail CI on a broken threshold.
Published on:
A single JMeter client on a recent 2-3 GHz CPU can handle 1000-2000 threads, depending on the type of test, according to the Apache JMeter distributed testing guide.
Past that point, distributed testing usually means one controller and several workers. The same guide asks for the same JMeter and Java versions on every machine and for all machines on one subnet, because RMI cannot communicate across subnets without a proxy.
HyperExecute, the TestMu AI test orchestration cloud, removes that fleet: every task runs on a fresh virtual machine created for the job and wiped after it. I ran one small test through k6 and Gatling on two HyperExecute machines each and checked the matching JMeter plan locally, and this guide shows the route each tool takes, the files that ran, and the results.
Overview
Running JMeter, k6 and Gatling scripts on TestMu AI HyperExecute is distributed load testing without a controller or a worker fleet. Each machine is a virtual machine created for the job. JMeter plans run from the HyperExecute Projects dashboard, which splits the users across machines, while k6 and Gatling run from a hyperexecute.yaml job file.
Which Route Does Each Tool Take on HyperExecute?
- JMeter: Upload the .jmx plan to a HyperExecute project, set Total Users and Machine count in the run form, and HyperExecute divides the users across machines and regions. Needs a hyperexecute.yaml file: No.
- k6: Install k6 as a runtime addon in hyperexecute.yaml and give each matrix machine its own execution segment, so two machines split one test's virtual users instead of each running all of them. Needs a hyperexecute.yaml file: Yes.
- Gatling: Run the Gatling Maven plugin from hyperexecute.yaml with the users per machine passed as a system property. Each machine writes its own HTML report and checks its own assertions. Needs a hyperexecute.yaml file: Yes.
How Do You Read Results From Several Machines?
- Merged percentile: Compute the p95 of a multi-machine load test from every machine's raw samples together. In a two-machine k6 job on HyperExecute, the machines reported p95 values of 48.07 ms and 40.79 ms, and the p95 of all 238 merged samples was 44.49 ms.
- CI exit code: When a k6 threshold fails on any machine, the HyperExecute job ends FAILED and the HyperExecute CLI exits with code 1, which fails the CI step that started it.
How Each Tool Runs on HyperExecute
Each tool has its own documented route onto HyperExecute, and the route decides who divides the load between machines: HyperExecute itself for a JMeter dashboard run, or your job file for k6 and Gatling.
| Tool | How a run starts | Who splits the load | What comes back |
|---|---|---|---|
| JMeter | Upload a .jmx file to a dashboard project and click Run, as the JMeter guide for HyperExecute describes | HyperExecute, from Total Users, the region split and Machine count | Summary, Timeline Report, Request Stats, Errors and Logs tabs |
| k6 | A hyperexecute.yaml file with a k6 runtime addon, run by the CLI, as the k6 guide for HyperExecute describes | You, with one execution segment per machine | A k6 summary per machine, plus any files you upload as artifacts |
| Gatling | A hyperexecute.yaml file that runs the Maven plugin, run by the CLI, as the Gatling guide for HyperExecute describes | You, with a users-per-machine property | A Gatling HTML report per machine, as an artifact |
Gatling also has a dashboard upload route with Capacity, Stress and Soak load profiles. The run performance tests at scale use case walks through that form screen by screen, together with the load distribution settings that decide how many users each machine runs.
The Test Scenario
Every HyperExecute run used the same scenario: four virtual users in total, two on each of two HyperExecute machines, for 60 seconds.
- Target - The index page and the Simple Form Demo page of the TestMu AI Selenium Playground, each requested once per iteration with a one-second pause after it.
- Pass criteria - A p95 response time under 1,000 ms and failed requests under 1%, written as k6 thresholds and Gatling assertions. The JMeter plan asserts a 200 status on every response.
- Versions - HyperExecute CLI 0.2.363, k6 v2.3.0 and Gatling 3.16.0 with gatling-maven-plugin 4.21.12 on HyperExecute, and JMeter 5.6.3 locally for the plan check, all run on November 3, 2026.
- Load size - Deliberately small, because the target is a shared demo site whose pages came back from the CDN cache. The routes and files are the point of this guide; the latency numbers say nothing about which tool is faster.
Run a JMeter Test Plan From the Dashboard
JMeter load testing on TestMu AI runs through the HyperExecute Projects dashboard rather than a job file. The JMeter guide documents these steps:
- Open the HyperExecute Projects dashboard, create a new project, and upload the .jmx file along with any CSV files it reads.
- Select the .jmx file, click Run, and set Total Users, Duration and Ramp-up Time.
- Choose the regions, the share of users in each region, and the Machine count.
- Pick the Java version, where Java 11 is the default and Java 25 is also available, then click Run Test.
The plan reads its thread count, ramp-up and duration through JMeter properties, the __P() form the JMeter guide requires for any value HyperExecute overrides:
<stringProp name="ThreadGroup.num_threads">${__P(threads,2)}</stringProp>
<stringProp name="ThreadGroup.ramp_time">${__P(rampup,0)}</stringProp>
<boolProp name="ThreadGroup.scheduler">true</boolProp>
<stringProp name="ThreadGroup.duration">${__P(duration,60)}</stringProp>
For recurring JMeter runs, release 3.1.5 added Workflows for JMeter projects. A HyperExecute workflow starts runs on a schedule, either once at a set date and time or on chosen weekdays at a set time. If you are writing the plan from scratch, the JMeter load testing tutorial covers a first plan in CLI mode.
Run a k6 Script Across Two Machines
k6 can split the load of one test across several k6 instances with its execution-segment option, and the k6 guide to running large tests shows the exact two-machine split used here: segments 0:1/2 and 1/2:1 with the sequence 0,1/2,1.
The script is an ordinary k6 test. Part 1 of 2 of playground.js sets four virtual users for the whole test and the two pass criteria, and P95_MS lets the CI example later tighten the threshold without editing the file:
import http from 'k6/http';
import { check, sleep } from 'k6';

const BASE = 'https://www.testmuai.com/selenium-playground';
const P95_MS = __ENV.P95_MS || '1000';

export const options = {
  vus: 4,
  duration: '60s',
  thresholds: {
    http_req_duration: ['p(95)<' + P95_MS],
    http_req_failed: ['rate<0.01'],
  },
};
Part 2 of 2 is one visitor's loop:
export default function () {
  const home = http.get(BASE + '/', { tags: { name: 'home' } });
  check(home, { 'home is 200': (r) => r.status === 200 });
  sleep(1);
  const form = http.get(BASE + '/simple-form-demo/', {
    tags: { name: 'form' },
  });
  check(form, { 'form is 200': (r) => r.status === 200 });
  sleep(1);
}
The job file installs k6 v2.3.0 as a runtime addon and lists two matrix values. The matrix multiplexing strategy turns each value into its own task on its own virtual machine. Part 1 of 2 of hyperexecute.yaml:
version: "0.1"
runson: linux
concurrency: 2
scenarioCommandStatusOnly: true

runtime:
  addons:
    - name: k6
      version: "v2.3.0"

matrix:
  segment: ["0:1/2", "1/2:1"]
Part 2 of 2 hands each machine its segment through $segment, writes every request to a CSV file, and uploads the results folder:
pre:
  - k6 version
  - mkdir -p results

testSuites:
  - >-
    k6 run --execution-segment "$segment"
    --execution-segment-sequence "0,1/2,1"
    --out csv=results/raw.csv playground.js

uploadArtefacts:
  - name: k6Results
    path:
      - results/**

jobLabel: [k6, performance, distributed-load-testing]
With the sequence 0, 1/2, 1, the segment 0:1/2 runs the first half of the virtual users and 1/2:1 runs the second half, so each machine ran 2 of the 4. With my TestMu AI username and access key exported as LT_USERNAME and LT_ACCESS_KEY, I started the job with ./hyperexecute --config hyperexecute.yaml --download-artifacts --download-artifacts-path dl --download-logs, and the CLI printed this plan:
Execution Plan
Mode:    matrix
Runson:    linux
Concurrency:    2
Report:    disabled
Artefacts:
    k6Results:    results/**
It ended with this summary for job 1db104ba:
 COMPLETED

    Test Execution Time:                  1m4s
    Job Duration Time:                    1m16s
    Total Tasks:                          2
    Cumulative Time Consumed:             2m28s
Total Stages: 4- Machine 1 - 118 requests, a p95 of 48.07 ms, and no failed requests, with k6 reporting 2 virtual users.
- Machine 2 - 120 requests, a p95 of 40.79 ms, and no failed requests, also with 2 virtual users.
- Job time - 1m16s from start to finish and 2m28s of machine time across both tasks, because both machines ran at the same time.
If you are new to k6 scripts, the k6 testing tutorial starts from installation and a first local run.

Austin Siewert
Co-Founder, Steadfast Systems
Discovered @TestMu AI yesterday. Best browser testing tool I've found for my use case. Great pricing model for the limited testing I do 👏
3M+ Devs and QAs rely on TestMu AI
Deliver immersive digital experiences with Next-Generation Mobile Apps and Cross Browser Testing Cloud

Run a Gatling Simulation From hyperexecute.yaml
Gatling load testing on TestMu AI has a documented job file route that runs the Gatling Maven plugin on each machine. The simulation reads its user count from a system property, so the job file decides how many users each machine runs. Part 1 of 2 of PlaygroundSimulation.java defines the requests:
package example;

import static io.gatling.javaapi.core.CoreDsl.*;
import static io.gatling.javaapi.http.HttpDsl.*;

import io.gatling.javaapi.core.*;
import io.gatling.javaapi.http.*;
import java.time.Duration;

public class PlaygroundSimulation extends Simulation {

  int users = Integer.getInteger("users", 2);
  int p95Ms = Integer.getInteger("p95Ms", 1000);

  HttpProtocolBuilder protocol = http
      .baseUrl("https://www.testmuai.com/selenium-playground");
Part 2 of 2 keeps that many users active for 60 seconds and adds the two assertions:
  ScenarioBuilder visit = scenario("Playground visit")
      .exec(http("home").get("/").check(status().is(200)))
      .pause(1)
      .exec(http("form").get("/simple-form-demo/")
          .check(status().is(200)))
      .pause(1);

  {
    setUp(visit.injectClosed(
            constantConcurrentUsers(users).during(Duration.ofSeconds(60))))
        .protocols(protocol)
        .assertions(
            global().responseTime().percentile(95.0).lt(p95Ms),
            global().failedRequests().percent().lt(1.0));
  }
}
One pom.xml detail matters on HyperExecute. My first job failed in 3 seconds with "Source option 5 is no longer supported", because without a parent POM, Maven on the machine fell back to maven-compiler-plugin 3.1, which ignores maven.compiler.release. Pinning the compiler plugin fixed it.
The rest of pom.xml is a plain Maven project with maven.compiler.release set to 17 and one test-scoped dependency, io.gatling.highcharts:gatling-charts-highcharts 3.16.0. Its build section:
  <build>
    <plugins>
      <plugin>
        <groupId>org.apache.maven.plugins</groupId>
        <artifactId>maven-compiler-plugin</artifactId>
        <version>3.16.0</version>
      </plugin>
      <plugin>
        <groupId>io.gatling</groupId>
        <artifactId>gatling-maven-plugin</artifactId>
        <version>4.21.12</version>
      </plugin>
    </plugins>
  </build>
Part 1 of 2 of the job file asks for Java 17 and two machines:
version: "0.1"
runson: linux
concurrency: 2
scenarioCommandStatusOnly: true

runtime:
  - language: java
    version: "17"

matrix:
  machine: ["1", "2"]
Part 2 of 2 resolves dependencies, gives each machine 2 users and a report label, and uploads the reports:
pre:
  - mvn -B -q dependency:resolve

testSuites:
  - mvn -B gatling:test -Dusers=2 -Dgatling.runDescription=machine-$machine

uploadArtefacts:
  - name: GatlingReport
    path:
      - target/gatling/**

jobLabel: [Gatling, performance, distributed-load-testing]
Job db3f6750 completed in 1m46s. Machine 1's log ended with its assertion results:
Global: 95th percentile of response time is less than 1000.0 : true (actual : 120.0)
Global: percentage of failed events is less than 1.0 : true (actual : 0.0)
[INFO] ------------------------------------------------------------------------
[INFO] BUILD SUCCESS
[INFO] ------------------------------------------------------------------------
[INFO] Total time:  01:10 min
[INFO] Finished at: 2026-11-03T13:00:54Z
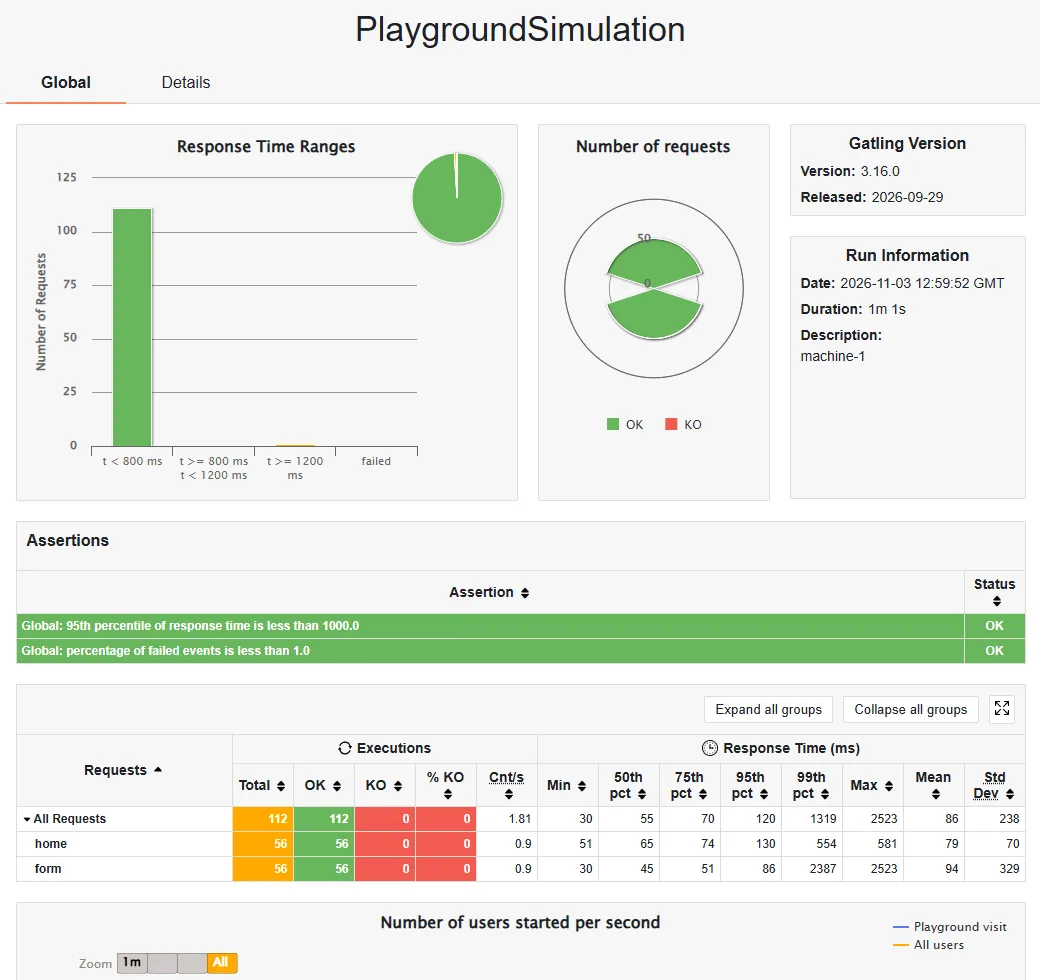
[INFO] ------------------------------------------------------------------------- Machine 1 - 112 requests and a p95 of 120 ms, with both assertions passing.
- Machine 2 - 114 requests and a p95 of 145 ms, with both assertions passing.
- Setup cost - Resolving Maven dependencies took about 20 seconds on each machine before any load started, because every task starts on a fresh virtual machine.
The downloaded report for machine 1 shows the machine-1 label from gatling.runDescription under Run Information:
Merge Results From Several Machines
The same k6 guide notes that k6 reports metrics individually for each instance, so some metrics have to be aggregated before they are correct. A percentile from one machine describes only that machine's requests, and the average of two p95 values is not the p95 of the whole run.
HyperExecute downloads artifacts into one folder per task, so a short script can read every machine's raw k6 samples and compute one percentile with the interpolation k6 itself uses. Part 1 of 3 of merge-k6.mjs is the percentile:
// merge-k6.mjs: merge raw k6 CSV output from every HyperExecute task
import fs from 'node:fs';

// k6's own percentile method: linear interpolation at p * (n - 1)
function p95(values) {
  const v = [...values].sort((a, b) => a - b);
  const i = 0.95 * (v.length - 1);
  const lo = v[Math.floor(i)];
  return lo + (v[Math.ceil(i)] - lo) * (i - Math.floor(i));
}
Part 2 of 3 reads the request durations out of one task's CSV file:
function durations(file) {
  const text = fs.readFileSync(file, 'utf8').trim();
  const [head, ...rows] = text.split('\n');
  const cols = head.split(',');
  const name = cols.indexOf('metric_name');
  const val = cols.indexOf('metric_value');
  return rows.map((row) => row.split(','))
    .filter((cell) => cell[name] === 'http_req_duration')
    .map((cell) => Number(cell[val]));
}
Part 3 of 3 prints each machine, then the merged set:
const root = process.argv[2] || 'dl/k6Results';
const all = [];
for (const task of fs.readdirSync(root)) {
  const d = durations(root + '/' + task + '/results/raw.csv');
  console.log('task ' + task + ': ' + d.length + ' requests, p95 '
    + p95(d).toFixed(2) + ' ms');
  all.push(...d);
}
console.log('merged: ' + all.length + ' requests, p95 '
  + p95(all).toFixed(2) + ' ms');
Run with Node.js against the artifacts of job 1db104ba, it printed:
task 1: 118 requests, p95 48.07 ms
task 2: 120 requests, p95 40.79 ms
merged: 238 requests, p95 44.49 ms
The per-machine lines match what k6 printed on each machine, which checks the method. The merged p95 is 44.49 ms, while the average of the two machine values is 44.43 ms. The two land close here because both machines saw similar latency; quote the merged figure, since it is the one that describes every request.
Gatling needs a different approach. In Gatling 3.16, the simulation.log in each report folder is a binary file, so merging Gatling machines means reading that format rather than a text log. For a release decision, compare the per-machine reports side by side: the p95 of the merged requests cannot be higher than the slowest machine's p95, so that figure is a safe upper bound.

Note: Run the JMeter, k6 and Gatling scripts you already maintain on HyperExecute, on machines created for each job, with no load generators to keep running between tests. Try TestMu AI free.
Fail the Build When a Threshold Breaks
A CI step reads the CLI's exit code, so the gate test is the same job with a threshold the site cannot meet. The red run used the same files with one change to the test command, plus a gate entry in jobLabel:
testSuites:
  - >-
    k6 run -e P95_MS=20 --execution-segment "$segment"
    --execution-segment-sequence "0,1/2,1"
    --out csv=results/raw.csv playground.js
Both machines crossed the 20 ms threshold, and each k6 process judged it against its own requests. Machine 1's log:
  █ THRESHOLDS

    http_req_duration
    ✗ 'p(95)<20' p(95)=65.83ms

    http_req_failed
    ✓ 'rate<0.01' rate=0.00%
HyperExecute marked both tasks as failed with the remark "Job failed as encountered a Test level failure", ended job 1893a20d as FAILED, and the CLI finished with exit code 1:
2026-11-03T18:45:24+05:30    error    Exiting with error: Failed tasks found.
Job Link: https://hyperexecute.lambdatest.com/hyperexecute/task?jobId=1893a20d-a267-4dcb-b140-6e038d39454f

Error: Failed tasks found.- Thresholds run per machine - The k6 guide to running large tests says each k6 instance evaluates thresholds independently of the others. Machine 1 measured a p95 of 65.83 ms and machine 2 measured 63.51 ms, each against its own 118 requests, so one slow machine fails the whole job even when the merged p95 is under the limit.
- Task status follows the exit code - Both job files set
scenarioCommandStatusOnly: true, the same key the Gatling guide uses, so each task passes or fails on its command's exit status. - Gatling assertions - A failed Gatling assertion ends the Maven build with BUILD FAILURE. The Gatling job in the load testing tools comparison ended FAILED that way when its p95 assertion broke.
Limits of This Setup
- No combined report on the job file route - k6 and Gatling write one result set per machine. The merged number is yours to compute, as in the merge section above.
- k6 has no coordinating instance - The k6 guide to running large tests calls the distributed execution mode "not entirely functional", because k6 has no primary instance to coordinate the machines. Each machine starts its segment when its own task starts.
- No job file route for JMeter - The JMeter guide covers dashboard uploads only, so a JMeter suite starts from the dashboard or a workflow schedule, and there is no CLI exit code to gate a pipeline on.
- Region follows the CLI - For job file runs, HyperExecute picks the infrastructure region based on where the CLI is triggered. The JMeter dashboard instead lets you split users across six documented regions, including East US, Central India and Brazil South.
- Browser-mode k6 needs extra settings - The k6 guide's sample sets K6_BROWSER_ENABLED, K6_BROWSER_HEADLESS and HE_CONTEXT_K6_SETUP_DEFAULT_BROWSER_PATH for browser tests. The protocol-level script in this guide ran without them.
Get Started
Start with the tool your team already maintains: upload a .jmx file to a HyperExecute project, or copy the k6 or Gatling job file above, swap in your script, and run it with ./hyperexecute --config hyperexecute.yaml. The HyperExecute CLI guide lists every flag, including the artifact and log downloads used here.
Performance Testing by HyperExecute is the product behind all three routes in this guide.
Author

Japneet Singh Chawla
Blogs: 4

Japneet Singh Chawla is an Engineering Manager at TestMu AI, where he leads a team driving HyperExecute, the AI-native Test Orchestration Cloud Platform, and integrations with Cypress, Provar, Tosca, and Selenium, improving test execution efficiency and driving adoption across 500+ enterprise clients. He also spearheaded zero-downtime deployments that cut release-related downtime by 90%, and mentors new engineers into productive contributors. He brings 9+ years of experience building and scaling distributed systems, SaaS platforms, and developer tools, with deep hands-on backend engineering across Golang, Python, Node.js, Kafka, and Redis. Earlier at Sumo Logic he built award-winning developer tools, including a VS Code Parser Linter, and at Indus Valley Partners he was a founding member of the Sentiment Analyzer team, building ML-powered solutions for financial clients. Japneet holds an MCA in Computer Science from GGSIPU.
Reviewer

Anmol Gupta
Reviewer
Anmol Gupta is Vice President of Product Management at TestMu AI, driving HyperExecute, the test orchestration cloud that runs and accelerates automated test execution. He led the development of the Unified Test Execution Cloud Platform and now leads a 30-member cross-functional product organization across product lines contributing $7M+ in revenue. He brings over nine years of experience and previously co-founded the SaaS company Timble as CTO, where he grew the team from 5 to 40 and launched an AI KYC platform that processed 600K+ applications in five months while cutting verification time from 12 minutes to under 30 seconds. Anmol holds an MTech and BTech from IIT Delhi.


Distributed Load Testing FAQs
Did you find this page helpful?

TestMu AI forEnterprise
Get access to solutions built on Enterprise
grade security, privacy, & compliance
- Advanced access controls
- Advanced data retention rules
- Advanced Local Testing
- Premium Support options
- Early access to beta features
- Private Slack Channel
- Unlimited Manual Accessibility DevTools Tests