
Run JMeter and Gatling Load Tests in the Cloud
Test How Your Website Handles Heavy Traffic. Simulate Up to 8,000 Users at Once and See Response Times and Errors Live.

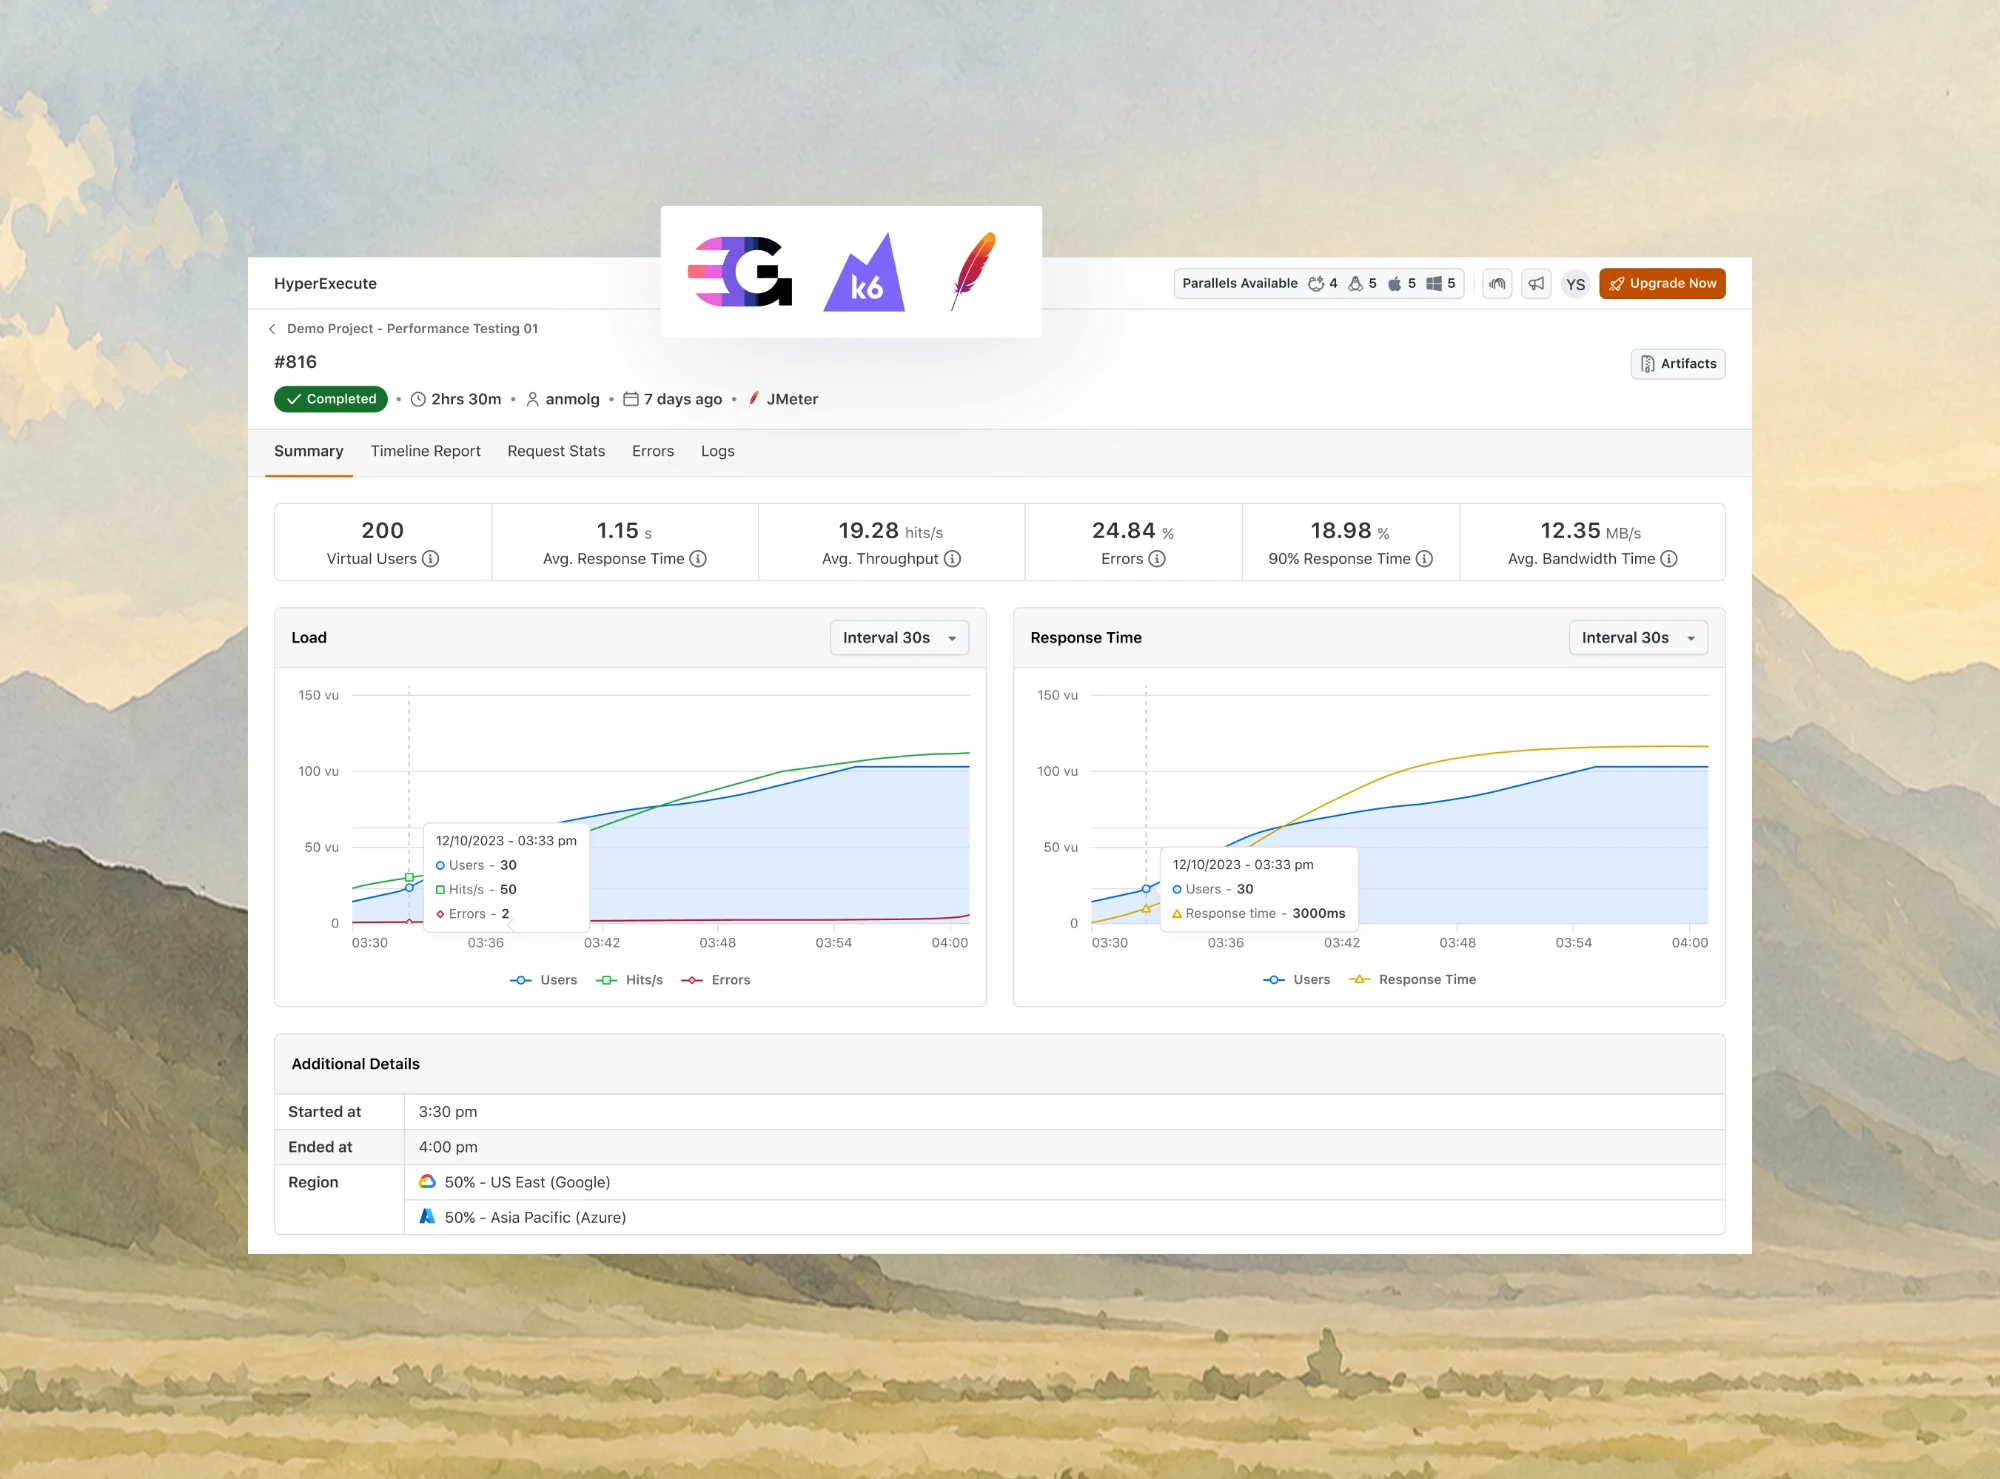
k6 vs JMeter: Which Load Testing Tool Fits Your Team? (2026)
k6 vs JMeter compared on scripting, protocols, distributed runs, CI pass or fail gates and cost, with versions checked on Nov 14, 2026: k6 2.4.0, JMeter 5.6.3.
Published on:
Grafana released k6 v2.4.0 on November 12, 2026, while Apache JMeter's newest release is still 5.6.3, which the JMeter download page lists with "Requires Java 8+". Release pace is the first difference in k6 vs JMeter; the larger ones are in how each tool expects your team to write, run and gate load tests.
k6 vs JMeter is a choice between load tests written as JavaScript files and test plans built in a desktop GUI and saved as .jmx XML. Both are open source, both generate protocol-level load, and both run in CI, but they differ on protocols, distributed runs, pass or fail gates and what you pay for at scale.
TestMu AI's HyperExecute runs JMeter plans as a project type and documents k6 runs as well, so this comparison has no favorite. Every version, limit and feature below was read on November 14, 2026 from the projects' own docs, release pages and source. If load testing itself is new to you, start with this guide to load testing.
TL;DR
In k6 vs JMeter, pick k6 for code-first API load tests that gate a CI pipeline and JMeter for protocol breadth. k6 runs JavaScript or TypeScript files from one Go binary and fails a CI job through thresholds; JMeter builds .jmx plans in a GUI, runs on Java and covers JDBC, JMS, LDAP and FTP as well as HTTP.
Should You Use k6 or JMeter?
- k6: k6 fits developers who review load tests as code. Scripts are JavaScript or TypeScript files, a threshold such as p(95)<500 turns into exit code 99 when it fails, and the 2.x line gets a release every month or two. Requires Java: no. Open source: yes, AGPL-3.0.
- JMeter: JMeter fits teams that load test databases, message queues, LDAP, FTP or mail servers next to HTTP, or that already maintain a library of .jmx plans. Version 5.6.3 runs from a GUI or the command line. Requires Java: yes, 8 or newer. Open source: yes, Apache License 2.0.
- TestMu AI HyperExecute: HyperExecute runs existing .jmx plans as a JMeter project across six documented load regions, and its docs also show k6 scripts running through a hyperexecute.yaml runtime add-on, so both k6 and JMeter tests run on the same platform.
Is k6 Faster Than JMeter?
- No shared benchmark: neither k6 nor JMeter publishes a head-to-head benchmark, so a claim that one is faster needs your own test on your own hardware.
- k6 per instance: the k6 docs say one instance can run 30,000 to 40,000 virtual users, with simple tests using about 1 to 5 MB of memory per virtual user.
- JMeter per machine: the JMeter docs give no fixed thread count and say hardware and test plan design both decide how many threads one machine can run.
k6 vs JMeter at a Glance (November 2026)
k6 is a command-line load generator scripted in JavaScript, and JMeter is a Java application that builds test plans from samplers, controllers and listeners. Versions and dates are as GitHub and Maven Central published them, read on November 14, 2026.
| Aspect | k6 | JMeter |
|---|---|---|
| Latest release | v2.4.0, November 12, 2026; the v1.8 line still gets patches (v1.8.3, November 13, 2026) | 5.6.3, January 2024 |
| Written in | Go, shipped as a standalone binary or the grafana/k6 Docker image | Java; 5.6.x needs Java 8 or newer, recommends Java 17, and the next major release will require Java 17 |
| License | AGPL-3.0 | Apache License 2.0 |
| How tests are written | JavaScript, or TypeScript run directly since k6 v0.57 | GUI-built .jmx plans; custom logic in JSR223 elements with Groovy |
| Protocols out of the box | HTTP/1.1, HTTP/2, WebSockets, gRPC, plus a browser module for Chromium | HTTP(S), SOAP and REST, FTP, JDBC, LDAP, JMS, SMTP, POP3, IMAP, TCP, Java objects, shell commands |
| Load shaping | Six executors, including constant and ramping arrival rates | Thread Groups with threads and ramp-up; an experimental Open Model Thread Group for arrival schedules |
| Distributed runs | Execution segments split one test across instances; the k6 Operator does it on Kubernetes | Remote servers over RMI; each server runs the full plan |
| CI pass or fail | Thresholds in the script; a failed threshold exits with code 99 | No threshold option; a separate step reads the results file |
| Built-in report | End-of-test summary in the terminal, plus CSV, JSON and streaming outputs | HTML dashboard with APDEX, statistics, errors and over-time graphs |
| Managed cloud | Grafana Cloud k6; free tier of 500 virtual user hours a month | None from Apache; third-party clouds run .jmx plans |
How the Versions Were Checked
Release lines decide what a team can install, so the version rows come from a script rather than from memory. It reads the GitHub API for both repositories and Maven Central for the JMeter core artifact, and it ran with Node.js 25.5.0 at 12:38 UTC on November 14, 2026:
// check-tools.mjs: read GitHub and Maven Central (Node 18+)
const gh = async (p) =>
  (await fetch("https://api.github.com/repos/" + p)).json();

for (const repo of ["grafana/k6", "apache/jmeter"]) {
  const r = await gh(repo);
  console.log(repo.padEnd(14), r.language.padEnd(5),
    r.license.spdx_id);
}

const k6 = await gh("grafana/k6/releases?per_page=20");
const lines = {};
for (const rel of k6) {
  const major = rel.tag_name.split(".")[0];
  if (!rel.prerelease && !lines[major]) {
    lines[major] = rel;
    console.log("k6", rel.tag_name.padEnd(8),
      rel.published_at.slice(0, 10));
  }
}

const q = "https://search.maven.org/solrsearch/select" +
  "?q=g:org.apache.jmeter+AND+a:ApacheJMeter_core" +
  "&core=gav&rows=1&wt=json";
const doc = (await (await fetch(q)).json()).response.docs[0];
console.log("jmeter", doc.v.padEnd(8),
  new Date(doc.timestamp).toISOString().slice(0, 10));
Its output, unedited. The JMeter date is the Maven Central upload; the 5.6.3 release on GitHub is dated a week later, January 9, 2024:
grafana/k6     Go    AGPL-3.0
apache/jmeter  Java  Apache-2.0
k6 v1.8.3   2026-11-13
k6 v2.4.0   2026-11-12
jmeter 5.6.3 2024-01-02- Two k6 lines - k6 2.x is the current major version, and Grafana still ships 1.8 patch releases, so a team pinned to v1 is not stranded on an unpatched build.
- One JMeter line - 5.6.3 is the newest JMeter on the download page and on Maven Central, so every JMeter fact below applies to it.
- Feature claims - the remaining rows come from the k6 docs on grafana.com, the k6 source on GitHub and the JMeter user manual on jmeter.apache.org.
Scripting: JavaScript Files vs .jmx Test Plans
A k6 test is a JavaScript module with an options object for load and pass criteria and a default function for what each virtual user does. Per the k6 docs on JavaScript and TypeScript compatibility, k6 runs .ts files directly since v0.57, stripping the types without checking them, and its require() loads built-in k6 modules, local files and remote scripts, not packages found through the Node.js module resolution algorithm.
// checkout-load.js (k6)
import http from "k6/http";
import { check, sleep } from "k6";

const BASE = __ENV.BASE_URL; // a staging host you own

export const options = {
  stages: [
    { duration: "2m", target: 50 },
    { duration: "5m", target: 50 },
    { duration: "1m", target: 0 },
  ],
  thresholds: {
    http_req_failed: ["rate<0.01"],
    http_req_duration: ["p(95)<500"],
  },
};

export default function () {
  const res = http.get(BASE + "/products");
  check(res, { "status is 200": (r) => r.status === 200 });
  sleep(1);
}
A JMeter test is a tree of elements: a Thread Group holds samplers that send requests, assertions that check responses, timers that pause and listeners that collect results. You build it in the GUI and save it as a .jmx file, an XML document, so a code review of a JMeter change is a review of generated XML. For scripted logic, the JMeter best practices page advises JSR223 elements with Groovy, which it recommends over BeanShell since JMeter 3.1.
- Diffs - a k6 change is a few lines of JavaScript in a pull request; a JMeter change rewrites XML elements the GUI generated, which is easier to check by opening the plan in the GUI than by reading the diff.
- Recording - JMeter's HTTP(S) Test Script Recorder captures browser traffic into samplers, which helps testers who do not write code; a k6 script is written by hand or generated from a recording with separate tools.
- Parameters - k6 reads
__ENVvariables passed with-eor the environment; JMeter reads properties passed with-Jthrough the__P()function inside the plan. - Learning path - for a full walkthrough of each, follow this k6 testing tutorial or this JMeter load testing tutorial.
Protocol Coverage in k6 and JMeter
Protocol breadth is where JMeter leads. The Apache JMeter home page lists web (HTTP and HTTPS), SOAP and REST web services, FTP, databases via JDBC, LDAP, message-oriented middleware via JMS, mail over SMTP, POP3 and IMAP, native commands or shell scripts, TCP and Java objects. The same page states that "JMeter is not a browser, it works at protocol level" and does not execute JavaScript found in HTML pages.
The k6 page on supported protocols lists HTTP/1.1, HTTP/2, WebSockets and gRPC out of the box, with k6 upgrading a connection to HTTP/2 when the server supports it. For anything else it points to xk6, a separate tool that builds a custom k6 binary, and names community extensions for SQL, Kafka, ZeroMQ and Redis.
- Databases, queues and mail - JMeter covers JDBC, JMS, LDAP, SMTP, POP3 and IMAP without add-ons; in k6 each needs an extension and a custom build.
- WebSockets and gRPC - k6 supports both natively; the JMeter 5.6.3 component reference lists no WebSocket or gRPC sampler, so those need add-ons outside the core distribution.
- Browser-level load - the k6 browser module drives Chromium-based browsers inside a k6 test, so one script can mix protocol load with page-level checks; JMeter does not render pages.
- Extension builds - per the k6 install docs, a test that uses extensions needs a k6 binary built with them, which is one more artifact to version in CI.
Load Generation: Virtual Users and Distributed Runs
How a tool schedules virtual users decides whether your test measures the arrival rate you planned or one that drops as the system slows. How it spreads load across machines decides how much setup a large test needs.
Load Models and Machine Size
The k6 page on open and closed models explains that in a closed model each iteration waits for the previous one, so a slow response lowers the arrival rate, a problem it links to coordinated omission. Its constant-arrival-rate and ramping-arrival-rate executors start iterations on a schedule instead, independent of response time.
A standard JMeter Thread Group runs each thread through the plan in sequence, so a slow response delays that thread's next request, the closed-model behavior described above. The Open Model Thread Group generates users on a schedule such as rate(1/sec) random_arrivals(2 min), but the JMeter component reference labels it experimental, and the Precise Throughput Timer only adds pauses to hold throughput near a target.
On machine size, the k6 guide to running large tests says one instance can run 30,000 to 40,000 virtual users and that simple tests use about 1 to 5 MB per virtual user.
- k6 sizing - the same guide suggests running 100 VUs on a development machine, multiplying the memory by the target VU count, and keeping at least 20% CPU idle on the load generator.
- k6 memory saver -
discardResponseBodiesstops k6 from keeping response bodies in memory, which matters at high VU counts. - JMeter sizing - the JMeter best practices page gives no fixed thread count; hardware and test plan design both set the limit, and it warns that wrong thread sizing can cause coordinated omission.
- JMeter memory saver - run load tests in CLI mode with as few listeners as possible, and keep View Results Tree out of load runs.
Distributed Runs
JMeter distributes a test by starting jmeter-server on each load machine and running the controller with -r or -R. The JMeter remote testing guide is explicit that "JMeter does not distribute the load between servers, each runs the full test plan": 1,000 threads on 6 servers inject 6,000 threads.
- Same versions everywhere - every node must run exactly the same JMeter version, and mixing Java versions is discouraged.
- RMI over SSL - each node needs the keystore that bin/create-rmi-keystore generates, or SSL must be turned off.
- Test data - the controller sends the plan but not the data files, so CSV files must already exist on every server.
- Controller limits - with many servers, the controller and its network link can become the bottleneck.
For one test across several machines, the k6 guide to running distributed tests uses the k6 Operator on Kubernetes: a TestRun resource names the script and a parallelism value, and the operator splits the workload between pods with execution segments, so 4 pods share one test instead of each repeating it.
- Without Kubernetes - the k6 options
--execution-segmentand--execution-segment-sequencegive each k6 instance its own slice of one test, so two machines can each run half of the virtual users. - Merged results - each instance reports only its own slice, so compute percentiles such as p95 from the merged raw samples rather than averaging each machine's p95.
Both approaches leave the machines, versions and network setup to your team. The TestMu AI section below covers how HyperExecute handles machine count and regional split for JMeter plans.
Running k6 and JMeter in CI/CD
A load test in CI is only useful if a bad result stops the pipeline. In k6 the pass criteria live in the script: a threshold such as http_req_duration: ["p(95)<500"] that is false at the end of the run fails it, and the k6 exit code list maps a failed threshold to exit code 99, which fails any CI step that runs it.
On GitHub Actions, Grafana's run-k6-action wraps k6 run with glob paths, parallel runs and fail-fast, while setup-k6-action installs k6:
# .github/workflows/load-test.yml
name: load-test
on: [push]
jobs:
  k6:
    runs-on: ubuntu-latest
    steps:
      - uses: actions/checkout@v4
      - uses: grafana/setup-k6-action@v1
      - uses: grafana/run-k6-action@v1
        env:
          BASE_URL: ${{ vars.STAGING_URL }}
        with:
          path: tests/checkout-load.js
JMeter in CI runs in CLI mode, which the JMeter getting started guide requires for load tests ("Don't run load test using GUI mode !"). Its full list of command-line options includes no pass or fail threshold, so the job runs the plan, writes results.jtl and the HTML report, and needs one more step to decide the build:
# JMeter 5.6.3 in CLI mode (Java 8 or newer)
jmeter -n -t checkout.jmx -l results.jtl \
  -Jusers=50 -Jrampup=120 \
  -e -o report/
<!-- Thread Group in checkout.jmx: read the -Jusers property -->
<stringProp name="ThreadGroup.num_threads">${__P(users,10)}</stringProp>- The gate step - the JMeter CSV log format writes a true or false success value for every sample, so a short script that counts false values and exits non-zero above your error budget turns the run into a pass or fail.
- Runner setup - the JMeter job needs Java 8 or newer and a JMeter install on the runner; the k6 job needs one binary or the grafana/k6 image.
- Load in the pipeline - keep the CI run small and short, and schedule the full-size test separately, because a 30-minute soak test blocks every merge behind it.

Results, Reports and Metrics Output
JMeter turns a results file into an HTML dashboard with -e -o at the end of a run, or later with -g results.jtl -o folder. Per the JMeter dashboard guide, it includes an APDEX table, a statistics table with 3 configurable percentiles, an errors table, the top 5 errors by sampler and graphs of response times, active threads, throughput and latency over time.
k6 prints an end-of-test summary in the terminal, in compact mode by default, and streams metrics to other systems while the test runs.
- Files - k6 writes raw metrics to CSV or JSON.
- Streaming outputs - the k6 docs list Amazon CloudWatch, Apache Kafka, Datadog, Dynatrace, Elasticsearch, Grafana Cloud Prometheus, InfluxDB, Netdata, New Relic, OpenTelemetry, Prometheus remote write, TimescaleDB and StatsD.
- Coming change - k6 2.4.0 deprecated the built-in InfluxDB and Prometheus remote-write outputs ahead of k6 v3 and recommends the OpenTelemetry output instead.
- Dashboards - k6 streams results into Grafana or another metrics store for dashboards, while JMeter's HTML report is a self-contained folder you can attach to a release ticket.
Cost: Licenses, Load Generators and Cloud Plans
Neither tool charges for the software. The bill comes from the machines that generate load and the time someone spends keeping them ready. On the managed side, Grafana's pricing page lists a free k6 tier "Limited to 500 virtual user hours per month", with usage above that billed pay as you go per virtual user hour.
| Cost item | k6 | JMeter |
|---|---|---|
| License | AGPL-3.0, free to run | Apache License 2.0, free to run and modify |
| Self-hosted generators | One binary per machine; a Kubernetes cluster for the k6 Operator at scale | Java and the same JMeter version on every machine, plus RMI and keystore setup |
| Vendor cloud | Grafana Cloud k6: 500 free virtual user hours a month, then pay as you go per virtual user hour | No Apache-run cloud; .jmx plans run on third-party load testing clouds |
| People time | Lower for developers who already write JavaScript | Lower for testers who build plans in a GUI and reuse existing .jmx files |
- Virtual user hours - managed clouds meter load in virtual user hours: 200 virtual users for 30 minutes is 100, and the same test every night uses about 3,000 a month.
- Compare like for like - set that monthly figure against each plan's allowance before you pick a tool on license terms alone.
Running JMeter and k6 Tests on TestMu AI
TestMu AI's JMeter cloud load testing on HyperExecute takes the plan your team already maintains: create a JMeter project, upload the .jmx file or a whole folder with its CSV data, pick the plan and run it.
- Load settings - Total Users, Duration, Ramp-up Time, Machine count, Split CSV, Job Labels, Java Version (Java 11 by default, or Java 25) and Total Load Distribution across regions.
- Regions - six documented load regions: East US (the default), West US 2, Central India, Southeast Asia, Brazil South and Mexico Central; multi-region load is an Enterprise plan entitlement.
- Plan variables - values written as
${__P(name,default)}in the .jmx, such as thread count, ramp-up or host, can be overridden per run without editing the plan. - Reports - a Summary Report, Timeline Report, Request Stats, Errors and Logs for every job, plus Task Metrics that show load generator CPU and memory.
- Private endpoints - instead of a tunnel, which would add a network hop to the response times you measure, the docs say to whitelist HyperExecute's static outbound IPs.
- Free plan - up to 100 concurrent virtual users, 100 virtual user hours a month as an introductory offer, 1 load generator and a 40-minute maximum test, with paid tiers on the TestMu AI pricing page.
Check the user math before the first large run. By default TestMu AI HyperExecute replicates the thread count in the .jmx onto every machine in every region, so a 250-user plan on 3 machines in each of 2 regions generates 1,500 virtual users. The guide to JMeter performance testing with HyperExecute walks through that example and shows how the Total Load Distribution overrides divide the users instead.
k6 runs as a regular HyperExecute job. The page on k6 tests on HyperExecute installs k6 through a runtime add-on in hyperexecute.yaml and starts the job with the HyperExecute CLI, so the same command works from a laptop or a CI runner:
# hyperexecute.yaml: the runtime block from the k6 docs
runtime:
  addons:
    - name: k6
      version: "v0.52.0"
The docs example pins k6 v0.52.0, a June 2024 release, and its sample is a k6 browser test. TestMu AI's guide to running JMeter, k6 and Gatling scripts on HyperExecute pinned k6 v2.3.0 instead and split one protocol-level test across two machines with execution segments.

Note: Run the .jmx plans your team already maintains on TestMu AI, with load generators provisioned for each run and five reports per job. Start free
Moving a JMeter Plan to k6
Plan on rewriting each JMeter plan as a k6 script rather than converting the .jmx file. Most JMeter elements have a direct k6 counterpart, and the rewrite is a good moment to drop requests that no report uses.
| JMeter element | k6 counterpart |
|---|---|
| Thread Group (threads, ramp-up) | stages or a scenario with the ramping-vus executor |
| Open Model Thread Group or Precise Throughput Timer | A constant-arrival-rate or ramping-arrival-rate scenario |
| HTTP Request sampler | http.get(), http.post() and the rest of the k6/http module |
| Response Assertion | check(), which records a pass rate; pair it with a threshold on the checks metric to fail the run |
| Duration Assertion or an SLA in a report | A threshold on http_req_duration, which fails the run |
| CSV Data Set Config | SharedArray loaded with open() in the init context |
| Constant Timer | sleep() |
| Listeners | The end-of-test summary and --out outputs |
For test data, the k6 docs say a SharedArray must be built in the init context and keeps one copy in memory for all virtual users:
// Replaces a CSV Data Set Config: one copy for all VUs
import { SharedArray } from "k6/data";

const users = new SharedArray("users", function () {
  return JSON.parse(open("./users.json"));
});

export default function () {
  const user = users[Math.floor(Math.random() * users.length)];
  // log in as user.email ...
}- Move in slices - rewrite one user journey at a time and run both versions against the same build until their response times agree.
- Keep JMeter where k6 is weak - plans that test JDBC, JMS, LDAP or mail can stay in JMeter; nothing forces one tool for every protocol.
- Target k6 2.x - per the k6 v2.0.0 release notes, v2 removed the externally-controlled executor and the
k6 logincommand and moved the Go module path, so extensions built for v1 must be rebuilt.
k6 vs JMeter: Which Should You Choose?
Both tools generate credible protocol-level load, so match the tool to who writes the tests, which protocols you test and where the results must go.
- Choose k6 - when developers own load tests, tests live in the application repository, a CI job must fail on a latency or error threshold, or you test WebSocket and gRPC services.
- Choose JMeter - when testers build plans without writing code, you test JDBC, JMS, LDAP, FTP or mail servers, or a library of .jmx plans already works.
- Run both - when new API tests go to k6 and protocol-heavy plans stay in JMeter; both results can feed one release decision.
- Skip self-hosting - when the team would rather not run generator fleets, use a managed cloud that accepts your format, such as Grafana Cloud k6 for k6 or HyperExecute for .jmx plans.
- Compare more tools - for Gatling, Locust and commercial options, see these performance testing tools scored on the same criteria.
Conclusion
Start the k6 vs JMeter decision by listing the protocols your next three load tests need and who will maintain them. If they are HTTP, WebSocket or gRPC tests owned by developers, write the first one in k6 with a threshold and wire it into CI; if they touch databases, queues or mail, or reuse existing plans, stay on JMeter and add a results gate.
To run existing .jmx plans without managing generators, set up a JMeter project on HyperExecute and follow the run form in the JMeter docs linked above.
Author

Garvit Sukhija
Blogs: 7

Garvit Sukhija is a Technical Product Manager at TestMu AI, where he leads the HyperExecute GUI, having spearheaded its development and pilot rollout to early adopters by integrating user insights and metric analysis into the go-to-market strategy. Before TestMu AI he owned the zero-to-one build of an enterprise SaaS platform for Earth Observation at Pixxel, where he designed billing, subscription, and IAM systems and led AI/ML model onboarding for over 10 solutions. Garvit holds a degree in manufacturing engineering and chemistry from BITS Pilani.
Reviewer

Japneet Singh Chawla
Reviewer
Japneet Singh Chawla is an Engineering Manager at TestMu AI, where he leads a team driving HyperExecute, the AI-native Test Orchestration Cloud Platform, and integrations with Cypress, Provar, Tosca, and Selenium, improving test execution efficiency and driving adoption across 500+ enterprise clients. He also spearheaded zero-downtime deployments that cut release-related downtime by 90%, and mentors new engineers into productive contributors. He brings 9+ years of experience building and scaling distributed systems, SaaS platforms, and developer tools, with deep hands-on backend engineering across Golang, Python, Node.js, Kafka, and Redis. Earlier at Sumo Logic he built award-winning developer tools, including a VS Code Parser Linter, and at Indus Valley Partners he was a founding member of the Sentiment Analyzer team, building ML-powered solutions for financial clients. Japneet holds an MCA in Computer Science from GGSIPU.


k6 vs JMeter FAQs
Did you find this page helpful?
More Related Blogs

TestMu AI forEnterprise
Get access to solutions built on Enterprise
grade security, privacy, & compliance
- Advanced access controls
- Advanced data retention rules
- Advanced Local Testing
- Premium Support options
- Early access to beta features
- Private Slack Channel
- Unlimited Manual Accessibility DevTools Tests