

Power Your Software Testing with AI Agents and Cloud
The Native AI-Agentic Cloud Platform to Supercharge Quality Engineering. Test Intelligently and Ship Faster.


- TestMu AI (Formerly LambdaTest)
- /
- Learning Hub
- /
- What is Non-Functional Testing? 9 Types, Metrics and Tools
What is Non-Functional Testing? 9 Types, Metrics and Tools
Non-functional testing checks how software performs, scales, and resists attack. Get the 9 types, the metric and threshold for each, and the tools.
Last Updated on:
Non-functional testing is software testing that measures how a system behaves rather than whether its features return the correct result. It covers performance, reliability, security, usability, compatibility, and scalability, and its defining discipline is turning each of those qualities into a metric with a threshold that a build can be tested against.
TL;DR
- Non-functional testing measures how fast, how securely, and on how many devices a system returns a correct result.
- Performance, load, stress, scalability, reliability, security, usability, compatibility, and visual regression testing are the nine types that cover most production risk.
- A requirement only gates a build when it names the attribute, the threshold, the measurement method, and the condition.
- Google's Core Web Vitals are assessed at the 75th percentile, so the slowest quarter of real sessions decides the verdict.
- Compatibility testing produces the most user-visible defects, and TestMu AI's automation cloud covers 3,000+ browser and operating system combinations.
- Testing AI systems adds inference latency, token cost, quality under concurrency, and non-determinism, which all need distribution-based thresholds.
What is Non-Functional Testing?
Non-functional testing is software testing that verifies how a system behaves rather than what it does. It measures quality attributes such as performance, reliability, security, usability, compatibility, and scalability, and expresses each as a number that a test can assert against. Functional testing checks correctness; non functional testing checks everything else that decides whether users stay.
The clearest way to see the boundary is through a standard. ISO/IEC 25010:2023, the international product quality model for software, is composed of nine quality characteristics, and the standard is explicit about what they are for: they "provide a reference model for the quality of the products to be specified, measured and evaluated." That last phrase is the whole discipline. A quality attribute that has not been given a number is not a requirement, it is an opinion.
This is where most non-functional testing fails in practice. Teams agree the application should be "fast" and "secure", ship it, and discover in production that nobody defined what either word meant. Compare the two statements below:
- Not testable - "The checkout page should load quickly for most users."
- Testable - "Checkout Largest Contentful Paint stays under 2.5 seconds at the 75th percentile, measured on a 4G profile on a mid-range Android device."
Both describe the same intent. Only the second can fail a build. Every section below follows that pattern: the attribute, the metric, the threshold, and the tool that produces the number.
You will also see this written as non-functional software testing; the two names describe the same practice. Either way it is almost always performed as black box testing, because it observes external behavior such as response time or error rate rather than the internal structure of the code. That makes it a technique question rather than a category question, which is why the same test can be described as both.
How Does Non-Functional Testing Differ From Functional Testing?
Functional testing verifies that the product returns the correct output. Non-functional testing verifies how well it returns it: how fast, under how much load, how securely, and on how many devices. Functional results are pass or fail against expected output; non-functional results are measurements compared against a threshold.
| Question | Functional Testing | Non-Functional Testing |
|---|---|---|
| What does it verify? | The output is correct for a given input. | The behavior stays within a threshold under a given condition. |
| What does a result look like? | Pass or fail against expected output. | A measurement compared against a number, usually a percentile. |
| What breaks in production without it? | Features return wrong results. | Features return right results too slowly, insecurely, or on too few devices. |
A checkout flow that calculates the correct total in nine seconds passes every functional assertion and still loses the sale. For a full side-by-side breakdown of the two approaches, including where each fits in the delivery cycle, read the dedicated guide on the differences between functional and non-functional testing.
Why Is Non-Functional Testing Important?
Non-functional testing is important because a build can pass every functional test and still fail its users. Correct output delivered too slowly, on too few devices, or through an exploitable endpoint is still a defect, and these defects surface at peak traffic rather than in the test suite.
Part of that quality bar is now measured externally and published. Google's Core Web Vitals define three thresholds for a good experience: Largest Contentful Paint within 2.5 seconds, Interaction to Next Paint of 200 milliseconds or less, and Cumulative Layout Shift of 0.1 or less, each assessed at the 75th percentile of page loads.
The percentile is the part teams underestimate. Measuring at the 75th percentile means the slowest quarter of real sessions decides the verdict, so an average taken on a fast connection tells you almost nothing about whether you pass. That gap between average-on-WiFi and percentile-on-mobile is where most non-functional defects live.
The second reason is that non-functional defects are expensive to fix late. A wrong tax calculation is a code change. A response time that only degrades past 400 concurrent users is usually an architecture change, and architecture changes discovered after launch are the ones that slip release dates.
What Are the Types of Non-Functional Testing?
The nine types of non functional testing that cover most production risk are performance, load, stress, scalability, reliability, security, usability, compatibility, and visual regression testing. Each measures a different quality attribute, and each has its own metric, threshold, and tooling.
The table below pairs every type with the metric that makes it testable and the tools that produce that number, so it doubles as a starting checklist.
| Type | Primary Metric | Example Threshold | Common Tools |
|---|---|---|---|
| Performance | Response time, throughput | LCP under 2.5s at p75 | Lighthouse, k6, JMeter |
| Load | Latency at expected concurrency | p95 under 800 ms at 500 users | JMeter, k6, Locust |
| Stress | Breaking point and recovery time | Recovers within 60s after overload | JMeter, Gatling |
| Scalability | Throughput gain per added resource | 2x nodes yields at least 1.8x throughput | k6, Gatling |
| Reliability | Error rate over sustained runs | Under 0.1% errors across a 24h soak | JMeter, Grafana |
| Security | Findings per OWASP scenario | Zero high-severity findings | OWASP ZAP, Burp Suite |
| Usability | Task completion, WCAG conformance | Zero WCAG 2.2 Level AA violations | axe-core, WAVE |
| Compatibility | Consistent behavior per environment | Parity across the supported matrix | TestMu AI, Selenium |
| Visual regression | Rendered pixel or DOM difference | No unapproved diff above tolerance | SmartUI, BackstopJS |
1. Performance Testing
Performance testing measures how quickly a system responds for a single user path and how much resource that costs. The useful outputs are response time percentiles, throughput, and CPU or memory consumption during the run, not an average.
Start with the Core Web Vitals thresholds for anything user-facing on the web, then add server-side percentiles for the APIs behind it. Lighthouse produces the browser-side numbers, while k6 and Apache JMeter produce the server-side ones. Deeper practice is covered in the performance testing guide.
2. Load Testing
Load testing holds the system at the concurrency you actually expect and watches whether latency percentiles stay inside the threshold. The mistake is testing at average traffic; size the test against your peak, such as a sale hour or a payroll run, because that is when the system fails.
A workable first threshold is a p95 response time under 800 ms at expected peak concurrency, with an error rate under 1%. JMeter, k6, and Locust all express this as a pass or fail assertion that a pipeline can gate on. See the load testing guide for scenario design.
3. Stress Testing
Stress testing deliberately pushes past capacity to answer two questions: where does the system break, and does it break safely. Safe failure means rejecting requests cleanly and recovering, rather than corrupting data or hanging until a manual restart.
Record the breaking point as a number and the recovery time as a second number, because the recovery time is what your incident response actually depends on. The stress testing guide covers ramp profiles and failure criteria.
4. Scalability Testing
Scalability testing checks whether adding resources actually adds capacity. The metric is the ratio between resources added and throughput gained, and the failure signal is a curve that flattens: doubling the nodes yields only 20% more throughput, which usually means a shared database or lock is the real ceiling.
Run the same scenario at several capacity levels rather than one, since a single data point cannot show a curve. More detail is in the scalability testing guide.
5. Reliability Testing
Reliability testing runs a representative workload for an extended period and measures whether the error rate stays flat. Failures that only appear after hours, such as memory leaks, connection pool exhaustion, and log disks filling, are invisible to a ten-minute test run.
A 24-hour soak with an error rate under 0.1% and no upward memory trend is a reasonable starting bar. The reliability testing guide covers measurement windows.
6. Security Testing
Security testing probes authentication, authorization, session handling, encryption, and input validation. Work from a published catalog rather than improvising: the OWASP Web Security Testing Guide assigns every scenario an identifier in the form WSTG-category-number, such as WSTG-INFO-02 for the second information-gathering test. OWASP notes that identifiers can change between versions and recommends citing the version too, as in WSTG-v42-INFO-02, so a finding stays unambiguous across audits.
OWASP ZAP and Burp Suite automate the repeatable scans; the judgment-heavy scenarios stay manual. Gate the build on severity rather than count, since one high-severity authorization flaw outranks fifty informational findings. The security testing guide expands on scope.
7. Usability Testing
Usability testing measures whether people can complete tasks without help. Accessibility is the part of it that has an objective standard attached: WCAG 2.2 organizes requirements under four principles, perceivable, operable, understandable, and robust, across conformance levels A, AA, and AAA.
Level AA is the usual contractual target. Automated tooling such as axe-core catches a meaningful share of violations in CI, and TestMu AI's accessibility testing suite runs those checks across the browser matrix so a fix on Chrome does not regress on Safari. Task-completion research still needs real participants. See the usability testing guide.
8. Compatibility Testing
Compatibility testing confirms the application behaves consistently across browsers, operating systems, screen sizes, and devices. It is the type teams cut first when time is short, and the one that generates the most user-visible defects, because a rendering break on one popular device reaches thousands of people at once.
The constraint is infrastructure rather than technique. TestMu AI's test automation cloud covers 3,000+ browser and operating system combinations, and its real device fleet covers 10,000+ real Android and iOS devices, which removes the need to maintain an in-house lab for matrix coverage. The compatibility testing guide covers matrix selection.
9. Visual Regression Testing
Visual regression testing compares rendered output between builds and flags unintended differences. Functional assertions pass happily while a CSS change pushes a submit button off-screen, because the element still exists in the DOM and still responds to a click.
The metric is the size of the rendered difference against an approved baseline, with a tolerance that ignores anti-aliasing noise. TestMu AI's SmartUI visual testing handles the baseline management and diff review. Background is in the visual regression testing guide.
What Other Non-Functional Test Types Should You Know?
Endurance, volume, recovery, portability, interoperability, maintainability, compliance, and localization testing cover narrower risks. Most teams run them situationally rather than every release, triggered by the condition in the right-hand column below.
| Type | What It Verifies | Run It When |
|---|---|---|
| Endurance testing | The system survives sustained load without resource drift. | The service is long-running and rarely restarted. |
| Volume testing | Behavior holds as the data set grows, not just the user count. | Tables grow quickly or reporting queries scan history. |
| Recovery testing | The system restores correctly after a forced failure. | You have a recovery time or recovery point objective to meet. |
| Portability testing | The application runs on a different environment or host. | Migrating cloud providers, runtimes, or database engines. |
| Interoperability testing | Interfaces with external systems behave to contract. | Third-party APIs or partner integrations are involved. |
| Maintainability testing | The code can be changed safely at a predictable cost. | Onboarding is slow or change failure rate is rising. |
| Compliance testing | The build meets a regulatory or internal standard. | Operating under GDPR, HIPAA, PCI DSS, or SOC 2. |
| Localization testing | Language, currency, and date formats render correctly. | Shipping to a new locale or right-to-left language. |
How Do You Capture Non-Functional Requirements?
Capture non-functional requirements alongside functional ones at the start of the project, using a sentence pattern that forces a number into every requirement. Record each one in a user story, in acceptance criteria, or in a separate artifact, depending on whether it belongs to one feature or to the whole system.
Non-functional requirements are usually captured late, which is why they are usually unmet. The pattern that prevents it:
[Attribute] of [component] must be [operator] [value], measured by [method], under [condition].
Applied to a real requirement, that produces: "p95 response time of the checkout API must be under 800 ms, measured by k6 at 500 virtual users, on a 4G network profile." Every element is necessary. Drop the condition and two teams will measure on different networks and both claim to pass.
In agile delivery, non-functional requirements land in one of three places:
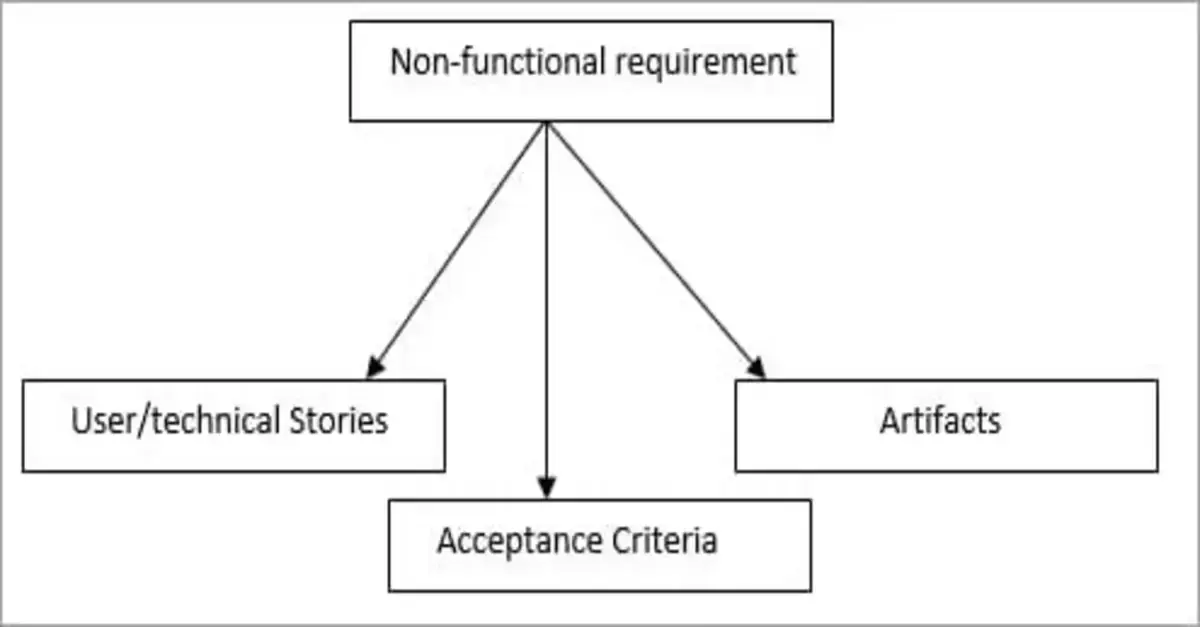
- User or technical stories - Best for attributes that belong to one feature, such as the response time of a specific endpoint. The story carries the threshold so it cannot be lost in handover.
- Acceptance criteria - Best when the attribute must hold before a feature is accepted in user acceptance testing. Not every requirement can be re-verified in every iteration, so attach it to the iteration where it is genuinely testable.
- A separate artifact - Best for system-wide attributes such as availability, data residency, or the supported browser matrix, which no single story owns. This artifact becomes the source for the regression suite.
How Do You Perform Non-Functional Testing?
Perform non functional testing in six steps: write the requirement with a threshold, pick the metric that expresses it, match the test environment to production, record the run state, assert the threshold in the pipeline, and re-baseline deliberately when infrastructure changes.
Steps three and four are the ones teams skip, and skipping them is why non-functional results are so often disputed.
- Write the requirement using the pattern above, so the threshold and the condition are explicit before any tooling is chosen.
- Pick the metric that expresses it, preferring a percentile over an average for anything latency-related.
- Match the environment to production, including data volume and network profile. A result measured on office WiFi against an empty database does not transfer.
- Record the run state with every result, whether normal, peak, or failure, so two runs remain comparable.
- Assert the threshold in the pipeline instead of eyeballing a dashboard, so a regression fails the build rather than being noticed a month later.
- Re-baseline deliberately when infrastructure changes, and record why the baseline moved.
Browser-side timings are the easiest place to start, because the browser already collects them through the Navigation Timing and Paint Timing APIs. The example below runs a real Chrome session on the TestMu AI cloud grid and reads those timings from the Selenium Playground:
const { chromium } = require("playwright");

const capabilities = {
  browserName: "Chrome",
  browserVersion: "latest",
  "LT:Options": {
    platform: "Windows 11",
    build: "Non-Functional Testing Hub",
    name: "Navigation timing baseline",
    user: process.env.LT_USERNAME,
    accessKey: process.env.LT_ACCESS_KEY,
  },
};

(async () => {
  const browser = await chromium.connect(
    `wss://cdp.lambdatest.com/playwright?capabilities=${encodeURIComponent(
      JSON.stringify(capabilities)
    )}`
  );
  const page = await browser.newPage();
  await page.goto("https://www.testmuai.com/selenium-playground/", {
    waitUntil: "load",
  });

  const timing = await page.evaluate(() => {
    const nav = performance.getEntriesByType("navigation")[0];
    const fcp = performance
      .getEntriesByType("paint")
      .find((p) => p.name === "first-contentful-paint");
    return {
      ttfbMs: Math.round(nav.responseStart - nav.requestStart),
      domContentLoadedMs: Math.round(nav.domContentLoadedEventEnd - nav.startTime),
      loadCompleteMs: Math.round(nav.loadEventEnd - nav.startTime),
      firstContentfulPaintMs: fcp ? Math.round(fcp.startTime) : null,
    };
  });

  console.log(timing);

  // Turn the measurement into a gate.
  if (timing.firstContentfulPaintMs > 1800) {
    throw new Error(`FCP regression: ${timing.firstContentfulPaintMs}ms`);
  }

  await browser.close();
})();
Running that script against Chrome on Windows 11 in the TestMu AI cloud produced the following output, from build 100368419:
{
  "ttfbMs": 13,
  "domContentLoadedMs": 339,
  "loadCompleteMs": 401,
  "firstContentfulPaintMs": 432
}
Those four numbers are the baseline. A second run of the same script returned 8 ms, 381 ms, 384 ms, and 376 ms, which is the point worth internalizing: single runs vary, so a threshold has to sit far enough above the noise to avoid flagging normal variance as a regression.
The final check in that script converts the baseline into a gate, so the next commit that pushes First Contentful Paint past 1800 ms fails the pipeline instead of reaching users. That single step is the difference between measuring non-functional quality and enforcing it.
Browser timings are only half the picture. The walkthrough below covers how to build a performance strategy that measures the backend and the frontend together, which is where most teams find the number that actually explains a slow page.

Note: Measure the same journey across 2G, 3G, 4G, and 5G profiles on real hardware instead of a developer laptop, and see where the thresholds actually break. Start testing free on TestMu AI
How Does Non-Functional Testing Change for AI Systems?
Non-functional testing of AI systems has to handle four attributes that conventional testing does not: inference latency varies per request, cost scales with token usage, output quality degrades under concurrent load, and identical inputs can return different outputs. Each needs a distribution-based threshold rather than a single pass or fail assertion.
A conventional API returns the same output in roughly the same time for the same input. An inference call does neither, which breaks the assumptions the six-step sequence above relies on:
- Latency distribution - Inference time varies with output length, so a single average hides the tail. Assert on p95 and p99 and set the threshold against the longest realistic response, not the demo prompt.
- Cost per request - Token consumption is a non-functional attribute that has no equivalent in conventional testing. A prompt change that improves answers while tripling token count is a regression that no functional test will catch.
- Quality under concurrency - Providers throttle. Response quality and latency can both degrade once concurrent inference requests queue, so load testing has to measure output quality at load, not just response time.
- Non-determinism - The same input can produce different outputs, which makes exact-match assertions useless. Assert on properties that must hold every time, such as schema validity, refusal behavior, and absence of leaked context.
Prompt injection also widens the security surface, because user input reaches an interpreter that was never designed to separate instructions from data. The OWASP scenarios still apply, with input validation carrying more weight than usual. TestMu AI's Agent Testing evaluates conversational and voice agents on response quality and consistency, which is the half of AI quality that conventional non-functional tooling does not reach.

What Are the Best Practices for Non-Functional Testing?
The core practices are to define thresholds before the build, measure percentiles instead of averages, match the test environment to production, test on real devices, prioritize attributes by production risk, and automate the assertion so a breach fails the build.
- Define thresholds before the build - A threshold agreed after seeing the result is not a threshold, it is a rationalization.
- Prefer percentiles to averages - An average response time hides the slow tail that decides whether users stay, and it is the tail that Core Web Vitals grades.
- Match the test environment to production - Same configuration, comparable data volume, and a realistic network profile. Results from a mismatched environment cannot be argued from.
- Test on real devices for anything user-facing - Emulators approximate the chipset, the radio stack, and the thermal behavior that determine real performance.
- Prioritize by production risk - Rank attributes by what actually costs money if it fails. A payments platform leads with security and reliability; a media site leads with performance and compatibility.
- Automate the assertion rather than the report, so a breach fails the build instead of arriving as a chart nobody opens.
- Record every run's state and configuration alongside the number, because a result without its conditions cannot be compared to the next one.
- Re-baseline when infrastructure changes, and write down why, so a future regression hunt does not start from a mystery.
Tracking those results over time is its own problem once several suites report separately. TestMu AI's test intelligence consolidates results across runs so a slow drift in a percentile is visible before it crosses the threshold, which is usually months before a user complains. Broader context on measuring quality attributes is in the software quality guide.
Where Should You Start With Non-Functional Testing?
Start by rewriting one vague quality statement from your current backlog into the requirement pattern from this guide, with a metric, a threshold, a measurement method, and a condition. One properly specified requirement that fails a build is worth more than a document full of aspirations that never gate anything.
Then pick the single attribute with the highest production risk for your product and measure it on real hardware under a realistic network profile before your next release. To run those checks at scale, TestMu AI's real device cloud provides network profiles from 2G through 5G, custom bandwidth and latency throttling, geolocation across 170+ countries, and per-session CPU, memory, and network logs to attach to each result. The HyperExecute documentation covers wiring those runs into a pipeline so the thresholds gate every build.
Author

Amrita Angappa
Blogs: 4


Amrita Angappa is a Community Contributor with 6.5+ years of experience in content creation, specializing in software testing, test automation, AI, Big Data, ML, and analytics. She has authored 100+ technical blogs, with her work featured on platforms like SAP, DZone, Thrive Global, HackerNoon, YourStory, and more. A JOSH Talks speaker and former TestMu AI content lead, Amrita is also the creator of the LinkedIn series #fresherdiaries, which has crossed 10M+ views. On LinkedIn, she is followed by 35,000+ professionals, including QA engineers, software testers, AI innovators, technologists, marketers, and industry leaders.
Reviewer

Shahzeb Hoda
Reviewer
Shahzeb Hoda is the Associate Director of Marketing and a Community Contributor at TestMu AI, leading strategic initiatives in developer marketing, content, and community growth. With 10+ years of experience in quality engineering, software testing, automation testing, and e-learning, he has authored and reviewed 70+ technical articles on software testing and automation. Shahzeb holds an M.Tech in Computer Science from BIT, Mesra, and is certified in Selenium, Cypress, Playwright, Appium, and KaneAI. He brings deep expertise in CI/CD pipeline automation, cross-browser testing, AI-driven testing practices, and framework documentation. On LinkedIn, he is followed by 3,700+ engineers, developers, DevOps professionals, tech leaders, and enthusiasts.


Non-Functional Testing FAQs
Did you find this page helpful?
More Related Learning Hubs
TestMu AI forEnterprise
Get access to solutions built on Enterprise
grade security, privacy, & compliance
- Advanced access controls
- Advanced data retention rules
- Advanced Local Testing
- Premium Support options
- Early access to beta features
- Private Slack Channel
- Unlimited Manual Accessibility DevTools Tests