

Power Your Software Testing with AI Agents and Cloud
The Native AI-Agentic Cloud Platform to Supercharge Quality Engineering. Test Intelligently and Ship Faster.


- TestMu AI (Formerly LambdaTest)
- /
- Learning Hub
- /
- Web Performance Testing: Complete Guide With E2E Examples
Web Performance Testing: Complete Guide With E2E Examples
Web performance testing is the key testing process of websites and web apps under varying loads to find performance-related issues. This tutorial discusses web performance testing in detail, including its concept, significance, and how to execute it.
Last Updated on:
On This Page
- What is Web Performance Testing?
- The Objective of Web Performance Testing
- Common Issues with Performance
- Why Web Performance Testing Matters
- When to Perform Web Performance Testing?
- What Web Performance Testing Measures
- Types of Web Performance Testing
- Chaos Testing and Resilience
- The 80/20 Rule (Pareto Principle)
- Performance vs Functional Testing
- Performance Testing Example
- Web Performance Test Cases Example
- Web Performance Testing Approaches
- Steps to Perform Web Performance Testing
- Web Performance Testing in the Cloud
- Checklist for Web Performance Testing
- Web Performance Testing Reports
- Tools to Execute Web Performance Testing
- JMeter vs k6
- Challenges of Web Performance Testing
- Best Practices
- Conclusion
OVERVIEW
Web performance testing checks how well an application holds up under real conditions: low bandwidth, high traffic, sustained load. It measures stability, scalability, speed, and responsiveness, because each of those fails differently and users notice all of them. Holding that sustained load long enough to measure failures rather than speed moves the exercise into reliability testing, which reports MTBF and availability instead of response times.
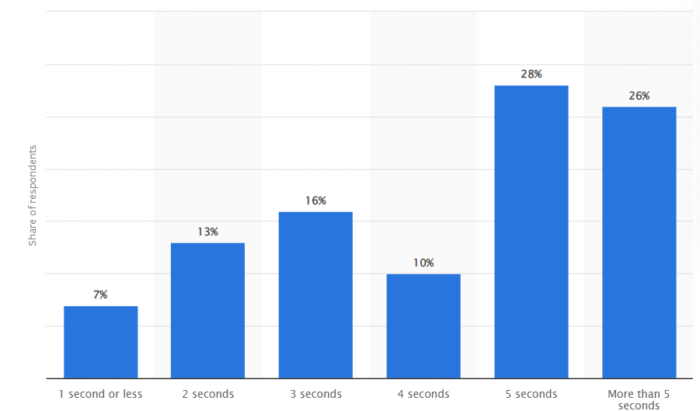
The stakes are well documented. Per this survey, 1 in 4 mobile users abandon websites that take longer than 4 seconds to load, and Statista puts the share of users willing to wait more than 5 seconds on mobile at just 26%. Performance is not a polish item; it decides whether users stay.
Static sites were once served whole and checked by hand with manual and exploratory testing. Today's applications assemble themselves in the browser from dozens of asynchronous calls, and the bottlenecks moved with them, which is why performance testing became a discipline of its own rather than a step at the end.
What is Web Performance Testing?
Web performance testing can be understood as the key testing process of websites and web apps under varying loads to find any performance-related issues. Those issues include network latency, inefficient database queries, server overloads, etc. Executing web performance testing aims to eliminate such performance bottlenecks that impact the overall user experience and efficiency of websites and web applications. It also allows testers to determine the software application's speed, scalability, and stability.
However, if we do not perform the web performance testing, it may show sluggish response time and poor interaction between the users and OS. Consequently, this results in poor user experience (UX). Performance testing for web applications is crucial for evaluating whether the developed software applications meet speed, responsiveness, and stability criteria when subjected to various workloads, ultimately ensuring a more positive UX.
Key performance indicators for web performance testing include:
- Browser, page, and network response times
- Server request processing times
- Acceptable concurrent user volumes
- Processor memory consumption
- Identification of error types and frequencies that may occur within the application
Organizations increasingly implement web performance testing to provide accurate insights into the preparedness of web applications. This involves testing the website and monitoring server-side applications. Web performance tests simulate loads similar to real conditions to evaluate whether the applications can handle the expected load. This approach helps the developers identify and resolve performance bottlenecks, enhancing overall system performance.
In summary, web performance testing:
- Ensures the application meets performance requirements
- Identifies computational bottlenecks within the application
- Validates the performance levels committed by the software vendor
- Evaluates the stability of the software/application under various concurrent user scenarios
The Objective of Web Performance Testing
Web performance testing aims to verify and ensure appropriate functionality and working of the web application and website in conditions like user traffic, diverse user interaction, and others. Here are some key objectives of web performance testing:
- Detecting software application’s bottleneck: The test process identifies and fixes any functionality of the applications that may lead to an impact on their overall performance. Some of the common issues include poor scalability, application crashes, etc.
- Ensure cross-platform stability: Web performance testing efficiently verifies the consistency of web applications across different platforms, browsers, and devices.
- Compliance with SLAs, Contracts, and Regulations: Validate that the web application meets the specified Service Level Agreements (SLAs), contractual obligations, and regulatory requirements, ensuring adherence to industry standards and legal guidelines.
- Prevention application degradation: Web performance testing checks that there is no decline in the performance of the web applications in case any major code change is made.
Common Issues with Performance
Almost every performance complaint reduces to one of four problems, and they are worth naming because each points at a different fix:
- Extended load time: How long the application takes to start. This is the first impression, and it is where most abandonment happens.
- Inadequate response time: The gap between a user's action and the application's answer. Long waits lose attention even when the page eventually works.
- Limited scalability: The application handles a test user fine but not the expected crowd. Load testing exists to find this ceiling before your users do.
- Bottlenecks: A single component throttling everything behind it, usually CPU, memory, network congestion, disk, or an OS limit. Bottlenecks are typically traceable to one faulty segment of code, which is what makes them worth hunting: the fix is often small and the payoff large.
Why Web Performance Testing Matters
Performance testing is one of the most crucial software testing categories, yet plenty of organizations skip regular performance tests, whether because the work looks optional or because the budget is tight. That is a false economy. The bottlenecks it would have caught do not disappear when you skip the test; they surface in production, in front of real users, at the worst possible moment. Here is what is actually at stake.
- Revenue and conversions: Speed influences sales directly. If a page does not load quickly, users leave and buy elsewhere, and the revenue goes to a competitor. The inverse holds too: the longer users stay, the likelier they are to register, subscribe, or check out. Catching bottlenecks in testing rather than in production is what keeps that traffic from leaking away during your next big promotion.
- User experience: According to Google, over half of all visitors abandon sites that take more than 3 seconds to load. Slow sites exhaust user patience and make people less likely to return, which damages reputation well beyond the single lost session.
- Confidence to ship: Performance testing is not a one-time activity. Running it regularly proves your application still holds up during high-traffic periods, and gives stakeholders a defensible answer when they ask whether the system can take the load.
- Insight into where it breaks: Testing localises the problem, pointing at the specific component that lags or fails rather than leaving you with a slow application and no suspect. That is what makes readiness for a predictable event, such as a sale or a launch, something you can plan instead of hope for.
When to Perform Web Performance Testing?
Executing performance tests becomes appropriate upon the completion of functional testing. An application's life cycle comprises two key phases for web and mobile applications: development and deployment. During testing, operational teams expose the application's components, such as web services, microservices, and APIs, to end users of the application architecture.
Development performance tests specifically target these components. The earlier these components undergo testing, the quicker any anomalies can be identified, resulting in lower rectification costs.
Developers have the option to compose performance tests, and they can also be integrated into the code review procedures. The scenarios for performance test cases are transferable across environments, from development teams conducting tests in a live environment to environments monitored by operations teams. Performance testing includes quantitative evaluation conducted in a laboratory or production environment.
However, as the application evolves, the scope of performance tests should expand. In certain instances, these tests may occur during deployment, mainly when replicating a production environment in the development lab proves challenging or expensive.
What Web Performance Testing Measures
Performance testing produces numbers, and the numbers only help if you know which one answers which question. These are also called key performance indicators (KPIs). They split cleanly into what the user feels and what the system is doing underneath, and you need both: the first tells you that something is wrong, the second tells you where.
What the User Experiences
- Load time: The total time for a page or app to load in the user's browser, counting every resource: HTML, CSS, JavaScript, and images. Track the average across runs rather than a single lucky one.
- Response time: The interval between a user's request and the system's response, including server processing and transmission. Watch the peak response time as well as the average, because the slowest requests are the ones users complain about.
- Time to First Byte (TTFB): How long the browser waits for the first byte of the server's response. It isolates network latency and server processing from rendering, which makes it the first place to look when a page feels slow before it shows anything.
- Page size: The combined weight of every resource needed to render the page. Smaller pages load faster, and on mobile networks this dominates almost everything else.
What the System Is Doing
- Throughput: The quantity of data units the system processes in a given time. This is the capacity number you scale against.
- Memory: The working storage available to the processor or workload. A figure that climbs steadily across a long run and never comes back down is the signature of a leak, which is what soak testing exists to expose.
- CPU interrupts per second: How frequently the process receives hardware interrupts, useful for separating a compute-bound bottleneck from an I/O-bound one.
- Bandwidth: The data volume per second moving between workloads, usually across the network.
- Concurrent sessions: The maximum number of active sessions the system sustains at once, which is the ceiling capacity testing is built to find.
Lab Data and Field Data: Lighthouse and CrUX
The metrics above describe what to measure. Two Google sources decide where the number came from, and confusing them is the most common way teams end up arguing about whose figure is right when both are.
- Lighthouse produces lab data: It is open source and built into Chrome DevTools, and it audits a page under simulated conditions, applying its own network and CPU throttling on one device in one run. Because the environment is controlled, results are reproducible and diagnostic: it tells you which resource blocked rendering and what to fix. Because the environment is synthetic, it is not evidence of what your users actually got.
- CrUX produces field data: The Chrome User Experience Report aggregates real measurements from opted-in Chrome users on real devices and real networks. It is what powers the field section of PageSpeed Insights and the Core Web Vitals report in Search Console. It will not tell you why a page is slow, but it is the record of what people genuinely experienced, which is also what Google assesses.
The practical split: use Lighthouse to diagnose and to gate changes in CI, where you need a stable comparison between two builds. Use CrUX to decide whether a problem is real and worth the effort. A page can score well in Lighthouse and still fail its users, because your test machine is not a mid-range phone on a congested mobile network.
Both report the Core Web Vitals: Largest Contentful Paint (LCP), which measures loading and should land at or under 2.5 seconds; Interaction to Next Paint (INP), which measures responsiveness and should stay at or under 200 milliseconds; and Cumulative Layout Shift (CLS), which measures visual stability and should stay at or under 0.1. INP replaced First Input Delay as a Core Web Vital in March 2024, so older guides naming FID are out of date.
Types of Web Performance Testing
Web performance testing includes several different types that work to evaluate the overall performance and working of the software applications. However, when you hear of web performance testing, you anticipate load and stress testing. Other different testing types fall under the category of web performance testing. Here are some of the common types of web performance testing.
Load Testing
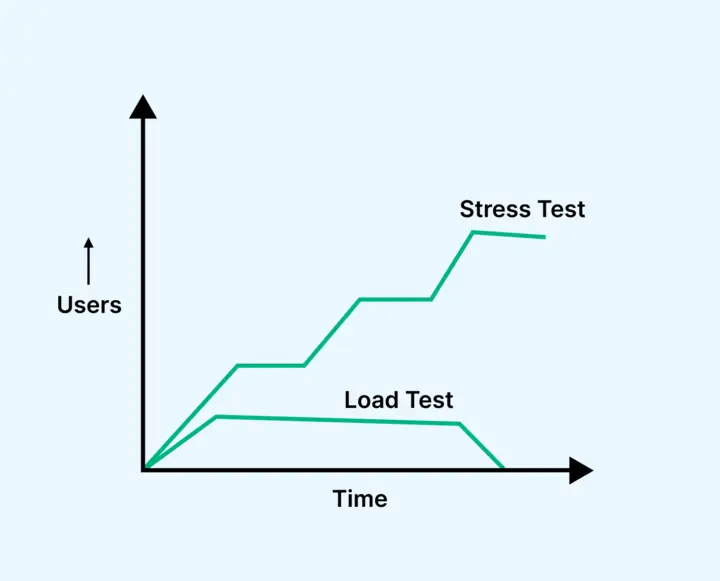
Load testing helps developers comprehend how software applications behave under a designated load value. Throughout the load testing procedure, an organization replicates the anticipated number of concurrent users and transactions over a specified timeframe to validate projected response times and pinpoint bottlenecks. This testing variant assists developers in measuring the application's user-handling capacity before its official launch. It aims to manage the load of the software applications within specific performance thresholds.
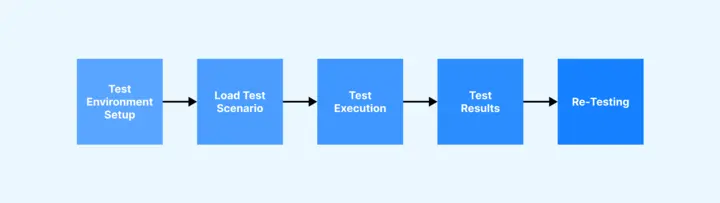
Moreover, developers can subject specific functionalities of software applications, like a web page's checkout cart, to load testing. Integrating load testing into a continuous integration process enables a team to promptly verify changes to a codebase using automation tools like Jenkins.
Stress Testing
Stress testing, also called fatigue testing, evaluates the software application's performance under abnormal user conditions. It validates how the software application responds beyond typical load scenarios and identifies the first failure components. The primary objective is to determine the software's breaking point and when it malfunctions.
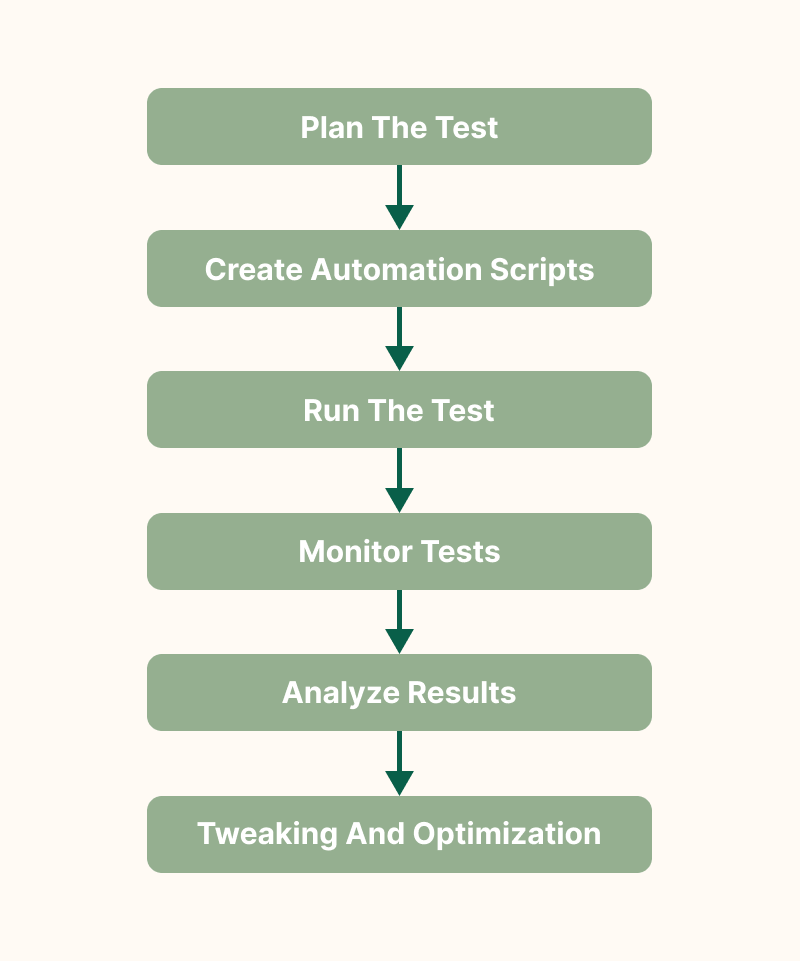
Furthermore, stress testing verifies the software application's proficiency in error management during challenging conditions. This evaluation measures the software application's data processing capabilities and responsiveness to high traffic volumes.
The significance of stress testing is underscored by several factors:
- Verification of the software application's functionality under abnormal conditions.
- Ensuring the display of appropriate error messages when the software application is under stress.
- Recognizing that software application failure under extreme conditions can lead to substantial revenue loss.
- Emphasizing the importance of preparedness for extreme conditions through the execution of Stress Testing.
While executing stress testing, there may be instances where massive data sets are employed, and there is a risk of data loss. Testers must prioritize preserving security-related data during stress testing to mitigate potential risks.
Stress testing includes two categories that allow software testers to better understand the workload's scalability.
- Soak Testing: Also called endurance testing, it holds a sustained load over hours or days to evaluate long-term viability. The engineer watches KPIs such as memory usage, because the defects this catches are the ones that need time to appear: memory leaks, connection pool exhaustion, and log volumes that fill a disk. A soak test asks whether throughput and response times after eight hours still match the first ten minutes, and the answer is often no.
- Spike Testing: Evaluates performance under a sudden, extreme surge of simulated users, and it is deliberately not a load test. Load testing ramps gradually; a spike test slams the system, because that is what a product launch, a flash sale, or a mention on a popular broadcast actually looks like. It answers two questions: does the system survive the surge, and does it recover afterwards, since a system that stays degraded once traffic returns to normal has failed even if it never crashed.
Capacity Testing
A capacity test measures the software application's ability to accommodate a specific number of concurrent users before experiencing a breakdown.
Capacity testing shares similarities with stress testing, as it evaluates traffic loads based on user numbers but diverges in the quantity evaluated. Typically linked to capacity planning, this test determines the software application's architecture, which includes different factors like server quantity, memory capacity, and server speed, aligned with business requirements.
A "capacity test" pertains to the maximum number of users an architecture can handle under regular operational circumstances. Resembling load tests, which often focus on more targeted user activities, a capacity test seeks to establish the overall user capacity that software applications can handle.
Scalability Testing
Scalability testing considers whether the software applications can effectively manage increasing loads consistently. In simpler terms, it evaluates performance by measuring the software application's capability to scale performance up and down. For instance, testers might perform a scalability test by gradually increasing the number of user requests. This involves systematically augmenting the load volume while observing the software application's response. Alternatively, the load can be maintained constantly while exploring variations in factors such as memory, bandwidth, and more.
Scalability testing is divided into two types:
- Upward scalability testing: The number of users is increased on a set scale until the application reaches its crash point, which is how you find its maximum capacity.
- Downward scalability testing: Run when a load test fails. Testers decrease the user count at set intervals until performance returns to acceptable, which locates the level the system can actually sustain.
Volume Testing
Volume testing, or flood testing, is a form of software testing designed to evaluate a software application's performance with a specified quantity of data. This quantity can pertain to the size of a database or the dimensions of an interface file being analyzed in the volume testing process. To execute volume tests, a sample file size is generated by including either a modest dataset or a more extensive volume, and the application's functionality and performance are subsequently tested against this file size. The primary objective of volume testing is to analyze how the software application’s response time and behavior are affected when the volume of data within the database is escalated.
Chaos Testing and Resilience
Every type above asks the same question: how does the system behave when demand rises? Chaos testing inverts it. Demand stays normal and the infrastructure breaks. You deliberately inject failure into a running system, killing an instance, adding latency to a database call, dropping a dependency, and observe whether the system degrades gracefully or takes everything down with it.
The reasoning behind chaos engineering is that distributed systems fail in ways no load test predicts. Your servers can have capacity to spare while a single slow dependency exhausts a connection pool and stalls the whole application. Load testing proves the system handles traffic; chaos testing proves it handles its own components misbehaving. The discipline was popularised by Netflix, whose Chaos Monkey terminated production instances at random on the theory that a failure you survive on a Tuesday afternoon, with the team watching, is enormously cheaper than the same failure at 3am on launch day.
It works like an experiment, not a smoke test. You state a hypothesis about steady-state behavior, such as checkout completing in under two seconds, inject one specific failure, and check whether the hypothesis still holds. Start in staging, keep the blast radius small, and have a documented way to stop.
A related technique is service virtualization, which stands in a simulated version of a dependency you cannot conveniently break or call: a payment gateway, a third-party API with rate limits, a mainframe. Rather than injecting a real failure, you script the dependency to return errors, time out, or respond slowly, which lets you test your own error handling without the risk or the bill. It pairs naturally with chaos testing: virtualization for the dependencies you do not control, chaos for the infrastructure you do.
The 80/20 Rule (Pareto Principle) in Performance Testing
You cannot performance test everything, and the teams that try usually ship late having tested the wrong things. The Pareto Principle, the observation that roughly 80% of effects come from 20% of causes, is the most useful planning heuristic in this discipline because it holds in two directions at once.
- 80% of the traffic hits 20% of the flows: On most applications a handful of journeys, typically login, search, product page, and checkout, account for the overwhelming majority of requests. Those flows are where your load test belongs. An admin report that three people run monthly does not need a thousand virtual users, however much easier it might be to script.
- 80% of the bottlenecks live in 20% of the code: Slowness is rarely spread evenly. It concentrates in a few places: an unindexed query, an N+1 call in a loop, a synchronous third-party call on the critical path. Once you find that 20%, fixing a small amount of code produces most of the available gain.
What this means in practice is that you rank before you script. Pull the real distribution from analytics or server logs rather than guessing, since the flows teams assume are hot are frequently not, and build your load profile to mirror it. If checkout is 40% of revenue-bearing traffic, checkout is 40% of your virtual users.
The rule has a limit worth naming. It tells you where to look first, not where to stop. The remaining 20% of traffic can still contain the flow that takes the system down, and low-traffic does not mean low-risk: a rarely used batch job that locks a table will ruin everyone's afternoon regardless of its request count. Use Pareto to sequence the work, then use risk to decide what else earns a test.
Difference Between Performance and Functional Testing
You might consider performance testing and functional testing to be quite similar when it comes to verification of the performance of the software application. It is crucial to note that performance and functional testing are not the same; there are subtle differences, but they are important at the same time.
Here are some of the key differences for better understanding the concept of web performance tests.
| Performance Testing | Functional Testing |
|---|---|
| Verifies the software's 'performance' | Validates the software's 'behavior' |
| Focuses on meeting user expectations | Concentrates on fulfilling user requirements |
| Requires automation for comprehensive coverage | Can be executed through automated or manual methods |
| Involves customer, tester, developer, DBA, and N/W Management team | Involves customer, tester, and developer only |
| Demands a close production test environment & H/W facility to simulate load | Production-sized test environments not mandatory; H/W requirements minimal in Functional testing |
Performance Testing Example
To understand performance testing better, let us take a specific example of web performance testing using Apache JMeter, focusing on scenarios with increasing user loads.
Scenario: Testing the Upward Scalability of an eCommerce Website
Objective: Evaluate the behavior of an eCommerce website under increasing user loads. Scenarios:
Desired Load: 1000 Users
- Goal Time: 2.7 seconds per request.
- Result: Pass
- Explanation: The test is successful since the actual load (1000 users) equals the desired load, and the response time meets the goal time of 2.7 seconds.
Increased Load: 1100 Users
- Goal Time: 3.5 seconds per request.
- Result: Pass (Stress Testing)
- Explanation: The test passes as the actual load (1100 users) exceeds the desired load (1000). This scenario is considered stress testing, and the system is expected to handle the increased load with a slightly higher response time of 3.5 seconds.
Further Increased Load: 1200 Users
- Goal Time: 3.5 seconds per request.
- Result: Fail
- Explanation: The test fails because the actual load (1200 users) is not less than or equal to the desired load (1000). This indicates that the system cannot handle the increased load, and the response time is higher than the specified goal time.
Even Higher Load: 1300 Users
- Goal Time: 4 seconds per request.
- Result: Fail
- Explanation: The test fails again as the actual load (1300 users) exceeds the desired load, and the response time (4 seconds) exceeds the specified goal time.
Maximum Load: 1400 Users
- Result: Crashed
- Explanation: The system crashes when the load reaches 1400 users, indicating that the application cannot handle this level of concurrent users, leading to a complete failure.
From the above example, it is understood that by executing the web performance testing, you can easily identify the capacity of the software applications to manage and withstand the loads. With this test, it also becomes possible to test the software applications to understand how they function under extreme test scenarios.
Web Performance Test Cases Example
Some web performance test cases are given below that will help you understand the key concepts of the actual test process.
- Test Scenario 01: Confirm that the website's response time does not exceed 4 seconds when 1000 users access it simultaneously.
- Test Scenario 02: Ensure that the response time of the Application Under Load falls within an acceptable range, specifically when the network connectivity is slow.
- Test Scenario 03: Determine the maximum number of users the application can handle before experiencing a crash.
- Test Scenario 04: Evaluate the execution time of the database when handling simultaneous read/write operations on 500 records.
- Test Scenario 05: Verify the CPU and memory usage of the application and the database server under peak load conditions.
- Test Scenario 06: Validate the response time of the application under varying load conditions, including low, normal, moderate, and heavy loads.
During the execution of performance tests, ambiguous terms such as "acceptable range" and "heavy load" are replaced with specific numerical values. Performance engineers establish these values based on business requirements and the technical characteristics of the application.
Web Performance Testing Approaches
There are nominally two approaches, manual testing and automation testing, but performance testing is the one discipline where manual is not a real option. Simulating a thousand concurrent users by hand means finding a thousand people and coordinating them, and the hardware, servers, and time to do it cost more than the tooling would. Even if you managed it, humans reading response times off screens produce measurements too imprecise to act on.
Repeatability is the deciding argument. A performance test is only useful as a comparison between two builds, which requires the load profile to be identical each time. Manual runs vary, so you could never prove a fix worked. Automation buys consistent virtual users, accurate metrics, and tests that run unattended on every commit in continuous integration, which is what keeps bottlenecks out of an Agile development cycle rather than finding them after release.
Automation does not remove the engineer. Tests can be fully automated at the component level, but interpreting results on an assembled system, deciding whether a regression matters and which component caused it, still needs a performance engineer. Automate the execution; keep the judgment.
Steps to Perform Web Performance Testing
The basic steps to execute web performance testing:
1. Identify Performance Scenario
Before initiating web performance testing, testers must understand the key scenarios affecting web application performance. For example, you can consider scenarios like peak usage time, high traffic periods, and others that might be critical to the software application.
2. Plan and Design Performance Test Script
In the next step, testers must give time to planning and designing performance test scripts. The test scripts must simulate the identified scenario so that the performance of the software application can be accurately verified. The test scripts must have a series of actions and interactions that users perform on the websites. Tools like JMeter can be used to design test scripts and automate the test scenario
3. Configure the Test Environment and Distribute the Load
Then, you must begin the test by first identifying the test environment that correctly duplicates the intended production environment. To replicate your performance testing environment better, you must record the relevant specifications and configurations, including hardware and software. You must avoid conducting tests in live production environments unless safeguards are in place to avert disruptions to the user experience. The closer the resemblance between your test environment and the live production setup, the greater the precision of your test results.
Configuration management is imperative for programming the environment with pertinent variables prior to the execution of tests.
4. Define Acceptable Performance Levels
This includes performance objectives and limitations for metrics in this phase. Establish the objectives and numerical benchmarks to signify the triumph of performance tests. A main approach to achieve this is by referencing project specifications and the anticipated outcomes from the software. Subsequently, testers can identify test metrics, benchmarks, and thresholds to articulate acceptable system performance. This might include response time, throughput, and resource allocation criteria. Additionally, you have the flexibility to incorporate other metrics tailored to the specifics of your application.
5. Create Test Scenarios
Once the performance metrics have been identified, the subsequent task involves formulating authentic test scenarios. These scenarios aim to replicate the practical usage of the software application, essentially mirroring the actions anticipated by end users. This includes simulating activities that users are expected to engage in while interacting with your application commonly. Test scenarios can be created to have diverse user interactions like registration, login, browsing, and purchasing. These scenarios must be designed to have all facets of the software application's functionality. Essentially, they should accurately mirror authentic user behavior and the projected load on your software applications.
6. Choose the Right Performance Testing Tools
Selecting the appropriate performance testing tools is paramount in guaranteeing precise and dependable test outcomes. Various performance testing tools, including Apache JMeter, LoadRunner, and Gatling, are accessible in the market. Given their distinct features and capabilities, opting for the tool that aligns most effectively with your specific requirements becomes crucial.
7. Execute the Web Performance Test
Once the test environment is established and the appropriate testing tool is selected, the commencement of performance tests becomes viable. To ensure consistency in results, it is imperative to conduct tests repeatedly. Vigilant monitoring of the software application throughout test execution is crucial for capturing any potential anomalies. For web applications, a convenient checklist can streamline the test execution process and save time.
You must also consider adopting parallel testing to concurrently run tests, optimizing time without compromising result accuracy. The following practices are recommended during the execution of performance tests:
- Designate an individual responsible for continuous monitoring.
- Establish a routine of regularly validating test data, systems, and scripts.
- Monitor all test results carefully to identify and rectify any process flaws.
- Maintain comprehensive logs of all tests, facilitating potential reiteration during the application life cycle.
- Initiate smoke tests as a preliminary step before delving into the actual tests.
- As a general practice, QA professionals typically execute each test three times.
8. Result Analysis
Evaluate the performance test data accumulated throughout ongoing testing to pinpoint potential system performance issues or bottlenecks. A thorough analysis has the potential to offer actionable insights for enhancing the application.
9. Identify the Bottleneck
Following the above step, you can find the issue or bottleneck compromising the performance of the software applications. The common bottleneck could be code problems, hardware issues, software glitches, and network issues. When analyzing the result and getting the bottleneck, fixing and resolving the issues is crucial.
10. Debugging and Re-Testing
Upon receiving the test results and identifying bugs, share this information with the team. Compile the bugs and forward them to the relevant developers for resolution. If feasible, QA professionals can address some basic bugs to expedite the process and minimize back-and-forth within the team.
After addressing performance shortcomings, re-execute the test to confirm the cleanliness of the code and optimal performance of the software.
11. Continuous Monitoring
Maintain vigilance over your application's performance post-launch. Regular performance testing is an early detection mechanism for new issues, preventing their impact on users. Additionally, it ensures that your application adapts to evolving usage patterns and loads.

Web Performance Testing in the Cloud
From the steps mentioned above, you must ascertain the significance of replicating the production environment to perform performance testing. For this, it is important to have the correct configuration of the test environment. However, sometimes it becomes difficult to scale resources up or down, the organization may face resource constraints, and it may require upfront capital investment in hardware, servers, and networking equipment.
Opting for a cloud-based environment and testing in real user conditions is recommended. Cloud platforms provide scalable resources, allowing you to easily adjust the size and capacity of your test environment based on the testing requirements. It also offers rapid provisioning and deployment of resources.
Further, the easiest approach to executing tests in real user conditions involves running performance tests on actual browsers and devices. Instead of managing the numerous limitations of emulators and simulators, testers find greater efficacy in utilizing a real device cloud that provides real devices, browsers, and operating systems on demand for immediate testing.

Subscribe to the TestMu AI YouTube Channel for test automation tutorials around Selenium, Playwright, Appium, and more.
QA professionals can ensure consistent and accurate results by executing tests on a real device cloud. Thorough and flawless testing is important in preventing significant bugs from slipping through undetected into production, optimizing the software to deliver the highest levels of user experience.
Whether opting for manual testing or automated testing, the indispensability of real devices remains non-negotiable in the testing equation.
Checklist for Web Performance Testing
To have a better and more robust execution of web performance testing without missing any crucial step, having a checklist is always preferable. Below is an expanded checklist covering various aspects of web performance testing:
- Check for performance goals of the software applications like high throughput.
- Check critical user scenarios and usage patterns.
- Determine the peak load and simultaneous user connections.
- Check for SLAs related to performance and ensure it best aligns with user expectations.
- Validate performance against user expectations.
- Ensure that hardware infrastructure aligns with performance requirements.
- Ensure the software stack (web server, application server, database) is optimized.
- Check that code review is done to find performance bottlenecks.
- Regularly monitor and analyze performance metrics.
- Check whether security evaluation is done to ensure performance under secure conditions.
Using a checklist covering these aspects, you can systematically approach the web performance testing process and ensure your software application is robust, scalable, and meets user expectations.
Web Performance Testing Reports
While we've extensively covered various aspects of web performance testing, one crucial aspect we haven't discussed is performance testing reports. These reports, along with dashboards and metrics, serve as the foundation for understanding the existence of bottlenecks and identifying necessary system enhancements for optimizing your websites, applications, and APIs.
Although the specifics of reports may differ among various performance testing solutions, there are fundamental performance metrics (load time, response time, etc) that demand inspection and testing across all reports. Most tools (Apache JMeter, LoadRunner) also facilitate easy sharing of these reports, allowing feedback collection from diverse departments.
Effective planning of objectives and accurate execution of web performance tests simplify identifying issues in the performance reports. Conversely, inadequate planning may lead to confusion, necessitating a revisit to the initial stages to reevaluate performance tests. Unlike functional tests, where outcomes are clear as pass or fail, performance testing is more intricate, demanding additional analysis.
A significant visual created by performance testing tools like Google Chrome DevTools and WebPageTest is the waterfall chart, containing information and data for analysis. Load time is a critical performance metric, considering that slow page load times significantly increase the likelihood of visitors abandoning your pages. Web performance reports, aligned with your requirements plan, showcase load times, response times, and individual component load and response times, providing insights into compliance with specified thresholds.
In addition to the waterfall chart, which details load times, response times, and file sizes, users are typically presented with other metrics and dashboards revealing errors such as HTTP error codes or completion timeout errors due to prolonged element loading times. A complete investigation of these factors and metrics ensures adherence to specified performance thresholds, preventing negative impacts on web performance.
Further visuals and reports include the performance testing execution plan, illustrating the impact of virtual user numbers on response times over the test period. Comparing this data with the waterfall chart helps find specific components hampering performance. Another crucial graphic is the cumulative session count report, revealing instances where new sessions couldn't start, resulting in errors.
While comprehending these reports and metrics may require some time, it's critical for sites or applications subject to SLA requirements. Implementing any necessary performance improvements ensures readiness to handle the expected load. Addressing immediate concerns is the initial step, yet it's crucial to recognize that performance testing is an ongoing process, not a one-time endeavor. With each modification to applications or systems, performance testing should be consistently conducted with each application or system modification to find undetected issues.
Tools to Execute Web Performance Testing
To leverage the execution of web performance testing, you can use some performance testing tools that address software technology needs. However, there are many different testing tools in the market; some are free, some are paid, and some are open-source. The main challenge you can encounter is choosing the right tool that best aligns with your software project requirements. Below is a list of some of the best web performance testing tools from which you can choose the correct tool.
JMeter
Regarded as one of the most potent tools for execution load and stress performance testing on web applications, JMeter allows the testers to emulate substantial traffic loads and understand the resilience of networks or servers. Supporting a diverse array of protocols such as Web, FTP, LDAP, TCP, Database (JDBC), and more, JMeter offers a comprehensive IDE that affords testers maximum control over the execution and monitoring of load tests. JMeter is free to run locally; to scale those tests across a managed cloud grid, run them with TestMu AI's JMeter cloud load testing. See the JMeter performance testing pricing plan for tier options.
Gatling
Gatling stands out as a load and performance testing framework, featuring an open-source nature complemented by an intuitive interface tailored for web applications. Gatling boasts compatibility with various protocols, including HTTP, Server-sent events, WebSockets, JMS, AMQP, MQTT, and ZeroMQ. With its HTML-rich reporting and integrated DSL, Gatling equips testers with various plugins, enabling them to enhance the software tool's functionality and optimize the testing framework.
LoadRunner
It is widely recognized as a robust performance testing tool, LoadRunner excels in supporting a broad spectrum of protocols for considering the performance of various websites and applications, including mobile platforms, rendering it highly adaptable. Although a complex tool necessitating on-premises deployment, MicroFocus offers a web-based alternative named LoadRunner Cloud for short-term requirements.
LoadRunner easily identifies prevalent causes of performance issues while providing accurate application scalability and capacity predictions.
WebLOAD
Developed by RadView, WebLOAD serves as load-testing software designed for executing performance tests on websites, web applications, and APIs. The platform supports various protocols, cloud applications, and enterprise applications, seamlessly integrating with numerous third-party tools such as Git and Atlassian Bamboo. It functions as a comprehensive tool for load testing, performance testing, and stress testing web applications, WebLOAD unifies performance, scalability, and integrity in a single process for the validation of web and mobile applications.
LoadNinja
LoadNinja, a SmartBear offering, changes the load testing process for websites, web apps, and APIs by leveraging real browsers to provide more accurate real-world results. This cloud-based tool enables teams to record and instantly play back comprehensive load tests effortlessly and use real browsers at scale without the complexities of dynamic correlation. LoadNinja includes a user-friendly point-and-click scripting tool called the InstaPlay recorder.
BlazeMeter
Built on JMeter, BlazeMeter is a load-testing solution that supports open-source Java-based software for functional and performance tests on web applications. This platform integrates with various third-party performance testing tools like Apache JMeter, Selenium, and Grinder, enabling teams to upload scripts from these platforms into BlazeMeter. Positioned as the only complete, continuous testing platform in the market, BlazeMeter offers testers advanced features such as mock services, synthetic test data, and comprehensive API testing and monitoring, which are scalable to many users.
NeoLoad
Developed by Neotys, NeoLoad is an on-premises performance testing tool designed for websites, applications, and APIs. While on-premises solutions include additional hardware capacity, specific system requirements, and ongoing maintenance responsibilities, NeoLoad supports many popular protocols, frameworks, web services, and applications.
Grafana k6
k6 by Grafana is an open-source load testing tool designed for performance testing, scalability testing, and stress testing of web applications. Developed with a developer-centric approach, k6 is known for its simplicity, flexibility, and the ability to execute tests with realistic scenarios. You can further scale the end-to-end testing of web applications by integrating Grafana k6 with cloud testing platforms like TestMu AI and get the flexibility to run your test on different OS and browser (Chromium) versions.
TestMu AI is an AI-Native test orchestration and execution platform to run manual and automated tests at scale. The platform allows you to perform real-time and automation testing across 3000+ environments and real mobile devices.

Visit our support documentation to get started with k6 testing with TestMu AI.

Note: Perform k6 testing on over 3000+ environments. Try TestMu AI Now!
JMeter vs k6: Which Should You Use?
Both tools appear in the list above, and they are the two most commonly weighed against each other, so it is worth being direct about how they differ. They come from different eras and different assumptions about who writes the test.
| Dimension | Apache JMeter | Grafana k6 |
|---|---|---|
| Language | Java, with tests usually built in the GUI and stored as XML | JavaScript (ES6), tests written as code |
| Interface | Desktop GUI for authoring, CLI for execution | CLI first, with no GUI |
| Protocol support | Very broad: HTTP, JDBC, JMS, LDAP, FTP, SOAP, TCP, and more | HTTP-centric, plus WebSocket, gRPC, and browser testing |
| CI/CD fit | Workable, though XML test plans are awkward to review in a pull request | Built for it: tests are code, diff and review like any other file |
| Resource usage | Heavier per virtual user, being thread-based | Lighter, using Go routines under the hood |
| Learning curve | GUI lowers the entry barrier for non-programmers | Assumes you are comfortable writing JavaScript |
| Distributed load | Native, via a controller and remote workers | Handled through k6 Cloud or your own orchestration |
| Best for | Legacy and enterprise protocols, and testers who prefer a GUI | Developer-owned performance tests living beside application code |
The honest answer to which is better is that neither is, and the question is really about who owns performance testing on your team. If it is developers, and tests should live in the repository and run on every pull request, k6 fits: the test is JavaScript, it reviews like code, and it starts fast. If it is a QA team testing an enterprise system that speaks JDBC or JMS, JMeter is not the legacy choice, it is the only one of the two that can talk to those systems at all.
Where k6 is genuinely stronger is developer experience and CI/CD: no GUI to drive, lighter resource use per virtual user, and a test plan you can read in a diff. Where JMeter is genuinely stronger is protocol coverage and the fact that someone who does not write code can still build a test plan. Reach for JMeter when you need breadth of protocol; reach for k6 when performance testing has to keep pace with a deployment pipeline.
Challenges of Web Performance Testing
Three problems account for most failed performance testing efforts. Each has a known fix, and each is cheaper to address before you start than after.
- Choosing the wrong tool: The right choice depends on your application's communication protocol, technology stack, the team's proficiency, and licensing cost. Get it wrong and you lose days getting scripts to work at all, on a tool that was never going to fit. Fix it by evaluating the Application Under Test against those four factors first, and running a proof of concept on a real transaction before committing.
- No test strategy or coverage: Without a strategy that identifies and ranks risks, teams test what is easy to script rather than what matters, and report coverage that means nothing. Fix it by analysing the application architecture and usage patterns before writing tests, then prioritising by risk and traffic, which is exactly what the 80/20 rule above is for.
- Stakeholders who do not see the value: Performance testing gets cut when decision-makers treat it as optional, and the cost only becomes visible once the system is slow in production, by which point the fix is expensive. Fix it by building it into the plan and budget from the start rather than proposing it as an extra, and by translating results into the terms stakeholders act on: lost conversions, not milliseconds.
Best Practices of Web Performance Testing
Six practices separate performance testing that changes decisions from performance testing that produces a report nobody reads.
- Start at the unit test level: Do not wait for integration. Run performance checks on code units before they merge, when the cause of a regression is still one commit rather than a release.
- Shift left: Performance testing belongs throughout development, not bolted on at the end. Finding a bottleneck early is the difference between changing a query and rearchitecting a service.
- Identify peak traffic times: Pull your usage data, find the genuine high-traffic periods, and build those into your scenarios. A test tuned to average traffic proves nothing about the hour that actually threatens you.
- Strive for broader coverage: One scenario is never enough, because the failures that hurt are the ones outside the plan you wrote. AI-enabled and codeless performance tools widen the footprint cheaply, which is what makes broad coverage affordable rather than aspirational.
- Create realistic tests: Pointing a server cluster with thousands of users at your app and calling it a performance test stresses the software but teaches you little. Real traffic arrives from a diverse mix of devices, browsers, and operating systems, and your tests need that diversity. A platform like TestMu AI makes it practical: research the device, browser, and OS combinations your audience actually uses, then run against those on TestMu AI's real device cloud.
- Pick the right automation platform: The platform has to imitate real user interaction, otherwise the numbers describe your harness rather than your users, especially once test parameters change.
Conclusion
In this tutorial, we have thoroughly discussed web performance testing, its concept, significance, and how to execute it. Let us summarize the key learning from this tutorial. Web performance testing is crucial in ensuring the quality and functionality of websites and web applications by determining their speed, scalability, and stability. It is an important part of the Software Testing Life Cycle because it allows the identification of bottlenecks and improves the software responsiveness. Organizations can ensure efficient, responsive, and reliable web platforms through this test.
Regarding web performance testing, the QA team performs load testing, stress testing, and others that simulate a real-world scenario, evaluate the application's performance in different conditions, and fix any performance-related issues. This test process cannot be overstated and is indispensable in any software development scenario. With this guide, you must gain immense information on web performance testing that will, in turn, help you get started.
Author

Salman Khan
Blogs: 138


Salman is a Test Automation Evangelist and Community Contributor at TestMu AI, with over 6 years of hands-on experience in software testing and automation. He has completed his Master of Technology in Computer Science and Engineering, demonstrating strong technical expertise in software development, testing, AI agents and LLMs. He is certified in KaneAI, Automation Testing, Selenium, Cypress, Playwright, and Appium, with deep experience in CI/CD pipelines, cross-browser testing, AI in testing, and mobile automation. Salman works closely with engineering teams to convert complex testing concepts into actionable, developer-first content. Salman has authored 120+ technical tutorials, guides, and documentation on test automation, web development, and related domains, making him a strong voice in the QA and testing community.


Frequently asked questions
Did you find this page helpful?
More Related Learning Hubs
TestMu AI forEnterprise
Get access to solutions built on Enterprise
grade security, privacy, & compliance
- Advanced access controls
- Advanced data retention rules
- Advanced Local Testing
- Premium Support options
- Early access to beta features
- Private Slack Channel
- Unlimited Manual Accessibility DevTools Tests