
Run JMeter and Gatling Load Tests in the Cloud
Test How Your Website Handles Heavy Traffic. Simulate Up to 8,000 Users at Once and See Response Times and Errors Live.

Mobile App Performance Testing: Steps, Tools, and Metrics
Part of: Performance Testing
Mobile app performance testing measures startup time, frame rate, CPU, memory, and network behavior on real devices. Learn the steps, tools, and metrics.
Last Updated on:
On This Page
OVERVIEW
An app can pass every functional test and still stall on a budget phone or a slow network, because functional tests check what a screen shows rather than how long it takes to appear. Mobile app performance testing, also called mobile performance testing, measures that second part: startup time, frame rate, CPU and memory use, battery drain, and how screens load as the connection degrades.
Teams typically combine local testing, which profiles builds on devices before release, with field testing, which uses Real User Monitoring tools like Firebase Performance Monitoring to capture actual launch times and crashes in production. For the wider release picture beyond speed, see the guide to mobile app testing.
Key Takeaways
Mobile app performance testing measures how fast an app starts, how smoothly it renders, and how much CPU, memory, battery, and data it uses on real devices and networks. It also load-tests the APIs behind the app, so a slow screen can be traced to the device, the network, or the server before users notice it.
What Does Mobile App Performance Testing Measure?
- Device performance: Device-side testing measures cold startup time, frame rate, janky and frozen frames, CPU, memory, and battery drain on the handset itself, where low-end phones expose problems that a flagship hides.
- Network performance: Network testing measures how long screens take to load under throttled 3G or 4G profiles, where payload size and request count decide the wait more than raw server speed does.
- Server performance: Backend testing measures API response times and error rates while many simulated users call the endpoints that the app depends on at the same time.
Which Tools Are Used for Mobile App Performance Testing?
- Android Studio Profiler: Android Studio's profiler records CPU use, memory allocations, heap dumps, and system traces for Android apps running on a connected device. Platform: Android only.
- Xcode Instruments: Xcode Instruments profiles iOS apps with Time Profiler for CPU time and with Allocations and Leaks for memory growth. Requires a Mac: Yes.
- TestMu AI App Profiling: App Profiling adds cold startup, frame rate, CPU, memory, and ANR data to Appium sessions on real devices. Supports Android 9+ and iOS; battery drain is reported on Android only.
- Apache JMeter: JMeter load-tests the backend APIs that a mobile app calls by replaying recorded HTTP traffic with many virtual users. Open source: Yes. Measures on-device metrics: No.
How Do You Run a Mobile App Performance Test?
- Set a pass or fail budget for each metric, such as cold start on the lowest supported phone, and keep one budget per device tier.
- Profile release-like builds on a flagship phone and on a low-end phone, using real devices for every number you plan to compare.
- Repeat each measurement several times and compare the median with the budget, because single runs of the same journey can differ by seconds.
- Load-test the backend APIs separately with JMeter or Gatling, then check field data from real users after each release.
What Is Mobile App Performance Testing?
Mobile app performance testing is the practice of measuring an app's speed, responsiveness, stability, and resource use on mobile hardware under realistic conditions: different device tiers, OS versions, network speeds, and backend load. Each test produces numbers, such as cold startup time, frame rate, or peak memory, that are compared against a budget on every build so a regression fails before release.
It differs from functional testing in what it asserts. A login test checks that the dashboard appears; a performance test checks that it appears within budget on the slowest phone you support. Faults that only appear after hours of continuous use, such as memory growth or thermal throttling, belong to reliability testing, which runs the same journeys for far longer and scores them on failure rate.
Why Is Mobile App Performance Testing Important?
On Android, the store itself watches app behavior. Google's Android vitals documentation says that when an app exceeds a bad behavior threshold for crashes or ANRs, "Play may reduce the visibility of your title" and may also show users a warning on the store listing.
- Hardware tiers - a build that feels fast on the phones a team tests with can be slow on cheaper models. In the real device results in this guide, a budget phone's cold start passed one second in 4 of 10 runs, while a Pixel 7's never passed half a second.
- Regressions inside passing builds - a new SDK, a larger image, or one more API call at launch can slow a screen without failing a single functional test, which is why performance checks belong in every CI run instead of a one-time audit.
The Three Layers of Mobile Performance: Device, Network, and Server
What a user experiences as slow is the combined result of three layers, and a bottleneck in any one of them degrades the whole app.
- Device (client-side) performance - how the app behaves on the handset itself, measured through CPU usage, memory footprint, battery drain, and rendering frame rate. Low-end devices with less memory and slower processors expose problems that never appear on a flagship phone.
- Network performance - how the app copes with real connectivity, including latency, limited bandwidth, packet loss, and handoffs between Wi-Fi and cellular. An app that feels instant on office Wi-Fi can stall on a congested cellular network. To measure the connection itself, including throughput, jitter, and packet loss, see network performance testing.
- Server and API performance - how quickly the backend answers, measured through API response times and payload sizes. Oversized responses or slow database queries surface on mobile as spinners and timeouts.
Testing all three together is what separates mobile performance testing from generic load testing. For any screen that loads web content, the browser's Navigation Timing data splits the wait: time to first byte (TTFB) covers the request's trip to the server and the server's processing, while the time after the first byte covers the download and rendering on the phone.

Note: Reproduce a slow-network complaint by hand before you script it. On TestMu AI's real devices, you can switch the network profile during a live session and watch CPU, memory, and FPS graphs from App Profiling while the screen loads. Try TestMu AI free.
Types of Mobile Performance Testing
Mobile performance testing splits the broader discipline of performance testing into checks that each answer one question about one layer.
| Type | Question it answers | Layer | Typical tools |
|---|---|---|---|
| Load testing | Do API response times and error rates hold at the expected peak number of app users? | Server | JMeter, Gatling |
| Stress testing | At what load does the backend start timing out, and does it recover afterward? | Server | JMeter, Gatling |
| Spike testing | Does the backend survive a sudden surge, such as a push notification that sends many users into the app at once? | Server | JMeter, Gatling |
| Endurance (soak) testing | Do memory use or response times drift over hours of continuous use? | Device and server | Profilers plus long-running load |
| Network condition testing | How do screens behave on slow, lossy, or dropping connections, and does offline mode recover? | Network | Throttling presets, proxies |
| Startup and rendering testing | How long does a cold start take, and how many frames are janky or frozen while scrolling? | Device | Macrobenchmark, XCTest, App Profiling |
| Battery and thermal testing | How much battery and heat does a typical session cost? | Device | Battery drain and temperature readings from profilers |
Mobile App Performance Metrics and How to Measure Them
Track a handful of metrics on every build, each measured with the platform's own tooling. Target values for each one are covered in the guide to mobile app performance metrics.
| Metric | What it tells you | How to measure it |
|---|---|---|
| Cold start time | Time from tap to the first frame (time to initial display) or to a usable screen (time to full display) | Android: adb shell am start -S -W reports TotalTime, and reportFullyDrawn marks full display. iOS: XCTApplicationLaunchMetric in an XCTest performance test |
| Frame rendering | Smoothness of scrolling and animation; dropped frames show up as jank | Android: Macrobenchmark FrameTimingMetric. iOS: Xcode Instruments. Both: App Profiling frame rate |
| Memory | Leaks and steady growth that end in out-of-memory crashes | Android Studio allocation tracking and heap dumps (debuggable build); Instruments Allocations and Leaks |
| CPU | Main-thread work that delays input handling and frames | Android Studio CPU recordings; Instruments Time Profiler |
| Network | Payload size, request count, latency, and time to first byte | Network logs, proxy captures, Navigation Timing for web content |
| Battery and temperature | Energy and heat cost of a session | App Profiling battery drain and temperature (Android) |
| Crashes and ANRs | Stability; an ANR is Android's Application Not Responding event | Android vitals in Play Console; App Profiling crash and ANR counts |
Android's slow rendering guide puts numbers on smoothness: a frame that takes longer than 700 ms counts as frozen, and an app targeting 90 fps has 11 ms to render each frame.
Local Testing vs Field Testing for Mobile Apps
- Local testing - happens before release. Engineers profile builds on physical devices with IDE tools or cloud devices, catching regressions before code ships. It is repeatable: you script the exact scenario, run it on every build, and compare results release over release.
- Field testing - happens in production, with real users on real networks. Real User Monitoring (RUM) and application performance monitoring (APM) SDKs capture launch times, crashes, and slow screens from actual sessions across more device and network combinations than any lab can reproduce.
Firebase Performance Monitoring is one source of field data: Google's Firebase documentation lists app start time, screen rendering, and network requests among the data it collects automatically once the SDK is in the app. Use local results to block regressions in CI, and use field data to choose which devices, OS versions, and countries the local matrix should cover.
How Performance Testing Differs by App Type: Native, Cross-Platform, Hybrid, and PWA
Where bottlenecks hide depends on how the app is built.
- Native apps (Swift, Kotlin, Java) run directly on the platform, so testing centers on CPU, memory, and rendering profiles from Android Studio and Xcode Instruments.
- React Native apps - since React Native 0.76, the New Architecture is enabled by default, and JavaScript talks to native code synchronously through the JavaScript Interface (JSI) instead of the old asynchronous bridge. Apps that have not migrated still run on the bridge, so check which architecture a build uses before reading its profile.
- Flutter apps - Flutter's performance profiling documentation says to profile on a physical device in profile mode, because debug mode and emulators are "generally not indicative of the final behavior of release mode builds." Flutter DevTools then shows the time each frame spends on the UI thread and the raster thread.
- Hybrid apps (Ionic, Capacitor, Cordova) render inside a WebView, so the work shifts to the web layer: page weight, JavaScript execution, and how fast the WebView paints. Chrome DevTools remote debugging on Android and Safari Web Inspector on iOS profile that layer.
- PWAs and mobile web run in the browser, so the yardstick is Core Web Vitals as defined on web.dev: Largest Contentful Paint for loading, Interaction to Next Paint for responsiveness, and Cumulative Layout Shift for visual stability. The guide to web performance testing covers those audits.
Android vs iOS App Performance Testing
Both platforms measure startup, rendering, memory, and stability, but each defines and records them with its own tools, so plan a separate budget and toolchain for the Android and iOS halves of a suite.
| Task | Android | iOS |
|---|---|---|
| Build to profile | A profileable build based on the release variant | A release-configuration build, profiled in Instruments on a physical iPhone |
| Startup | Time to initial display from the Displayed line in Logcat or adb shell am start -S -W (TotalTime); time to full display once the app calls reportFullyDrawn | XCTApplicationLaunchMetric in an XCTest performance test; the App Launch template in Instruments |
| Responsiveness | Slow and frozen frames; Macrobenchmark FrameTimingMetric | Hangs, from the Hangs instrument and the hang rate in Xcode Organizer |
| System traces | Perfetto, the platform-wide tracing tool since Android 10 | Instruments Time Profiler |
| Field data | Android vitals in Play Console; Firebase Performance Monitoring | Xcode Organizer charts of launch time, hang rate, memory, and battery use; MetricKit reports, delivered at most once per day |
| TestMu AI App Profiling | Android 9 and later, including cold and hot startup, ANRs, and battery drain | iOS real devices; the docs list battery drain as Android-only |
Google's Android vitals overview sets the bad behavior thresholds at a 1.09% user-perceived crash rate and a 0.47% user-perceived ANR rate overall, and 8% for either rate on any single phone model.
On iOS, the stall to watch is a hang. Apple's guide to hangs says most of its developer tools start reporting one when the main run loop stays unresponsive for more than 250 ms, and the Hangs instrument can be set to report shorter stalls.
Keep launch budgets per platform. Android's time to initial display stops at the first frame, while XCTApplicationLaunchMetric by default also waits for extended launch tasks, so an iOS launch number can read higher without the iOS app being slower. Compare each platform with its own previous builds instead.

Austin Siewert
Co-Founder, Steadfast Systems
Discovered @TestMu AI yesterday. Best browser testing tool I've found for my use case. Great pricing model for the limited testing I do 👏
3M+ Devs and QAs rely on TestMu AI
Deliver immersive digital experiences with Next-Generation Mobile Apps and Cross Browser Testing Cloud

How to Run a Mobile App Performance Test
A repeatable test has six parts: a budget, a device matrix, a release-like build, a scripted journey measured on real devices, a separate backend load test, and a CI gate that compares medians.
1. Set a Budget for Each Metric
Write the pass and fail numbers down before measuring: cold start on your lowest supported device, frozen frames per journey, peak memory, and the 95th-percentile API response time. Base them on field data from your RUM tool rather than on what the current build happens to achieve, and keep a separate budget for each device tier.
2. Pick Real Devices by Tier
Choose devices from your own analytics: the most-used flagship, a mid-range model, and at least one low-memory Android phone, on the OS versions your users run. Use physical devices for anything you will compare, since Android's Macrobenchmark guide discourages emulators because "they don't produce performance numbers representative of the end-user experience."
A cloud device farm removes the hardware constraint. TestMu AI's real device cloud spans 50,000+ real Android and iOS devices, so the matrix can follow your analytics instead of the phones the team happens to own, and each device stays fixed from build to build as part of a stable test environment.
3. Profile Release-Like Builds
Debug builds carry extra checks that inflate every timing. Android's profiling guide recommends a profileable app, which is based on the release build variant and "enables a subset of common profiling tasks without the performance overhead of the debug build." Flutter's equivalent is flutter run --profile. Whatever the platform, measure the build configuration you ship.
4. Script the Journey and Measure It on Real Devices
Drive the user journey with an automation framework and let a profiler record what happens. On TestMu AI's real devices, an Appium session gets App Profiling when the appProfiling capability is true (it also needs resignApp), and the networkProfile capability applies a throttling preset such as 3g-umts-good or 2g-gprs-good. The App Profiling docs list every metric, and the network throttling docs list the presets plus custom download, upload, and latency settings.
Run profiling against an app uploaded to your own account. With the public sample app ID, session creation returned a 400 error saying the app would "take a few seconds to update", and a retry 25 seconds later failed the same way; the same APK uploaded through the upload API started a profiled session on the first attempt. These commands install the Python client and upload TestMu AI's sample Android app:
pip install Appium-Python-Client requests
export LT_USERNAME="your-username" LT_ACCESS_KEY="your-access-key"
APK=https://prod-mobile-artefacts.lambdatest.com/assets/docs/proverbial_android.apk
curl -u "$LT_USERNAME:$LT_ACCESS_KEY" -F "name=proverbial-perf-demo" -F "url=$APK" https://manual-api.lambdatest.com/app/upload/realDevice
The script below follows the patterns in TestMu AI's Appium skill and produced every result in the next section. Part 1 holds the imports and settings; NETWORK_PROFILE picks the throttling preset and falls back to the unthrottled default network:
# perf_run.py, part 1 of 4: imports and settings
import os, time, requests
from appium import webdriver
from appium.options.android import UiAutomator2Options
from appium.webdriver.common.appiumby import AppiumBy
from selenium.webdriver.support.ui import WebDriverWait

USER, KEY = os.environ["LT_USERNAME"], os.environ["LT_ACCESS_KEY"]
PROFILE = os.environ.get("NETWORK_PROFILE", "default")
PAGE = ("https://ecommerce-playground.lambdatest.io/"
        "index.php?route=product/category&path=57")
Part 2 opens a session on a real Pixel 7 unless DEVICE and OS_VERSION say otherwise, with appProfiling, resignApp, and the chosen networkProfile set in LT:Options:
# perf_run.py, part 2 of 4: start a profiled real-device session
opts = UiAutomator2Options()
opts.device_name = os.environ.get("DEVICE", "Pixel 7")
opts.platform_version = os.environ.get("OS_VERSION", "13")
opts.app = os.environ["APP_URL"]  # lt://APP... from the upload API
opts.set_capability("LT:Options", {
    "isRealMobile": True, "appProfiling": True, "resignApp": True,
    "network": True, "networkProfile": PROFILE,
    "build": "Mobile performance testing", "name": PROFILE,
    "username": USER, "accessKey": KEY})
driver = webdriver.Remote("https://mobile-hub.lambdatest.com/wd/hub",
                          options=opts)
Part 3 opens the page in the sample app's built-in browser, then switches to the WEBVIEW context to read the page's own Navigation Timing entry. responseStart is the time to first byte and loadEventEnd marks the end of the load, so the timing comes from the browser rather than from a stopwatch around Appium commands.
# perf_run.py, part 3 of 4: open the page in the app's WebView, time it
NAV = "const n = performance.getEntriesByType('navigation')[0];"
LOADED = NAV + "return location.href.includes('57') && n.loadEventEnd > 0"
TIMES = NAV + "return [n.responseStart, n.loadEventEnd]"
APP = "com.lambdatest.proverbial:id/"
try:
    driver.find_element(AppiumBy.ACCESSIBILITY_ID, "Browser").click()
    driver.find_element(AppiumBy.ID, APP + "url").send_keys(PAGE)
    driver.find_element(AppiumBy.ID, APP + "find").click()
    driver.switch_to.context("WEBVIEW_com.lambdatest.proverbial")
    WebDriverWait(driver, 180).until(lambda d: d.execute_script(LOADED))
    ttfb, load = driver.execute_script(TIMES)
    driver.switch_to.context("NATIVE_APP")
    driver.execute_script("lambda-status=passed")
finally:
    sid = driver.session_id
    driver.quit()
Part 4 reads the session's metrics from the appmetrics API. The first request after a session returned a 404 "Either resource not found or already deleted" response, and the next one, about 30 seconds later, returned the data, hence the retry loop.
# perf_run.py, part 4 of 4: read the App Profiling metrics for the session
api = ("https://mobile-api.lambdatest.com/mobile-automation/api/v1/"
       f"sessions/{sid}/log/appmetrics")
for _ in range(20):  # metrics appear shortly after the session ends
    r = requests.get(api, auth=(USER, KEY))
    if r.ok:
        break
    time.sleep(15)
m, frames = r.json()["meta"], r.json()["frames"]
janky = sum(f["janky"] for f in frames)
frozen = sum(f["frozen"] for f in frames)
print(f"{PROFILE}: TTFB {ttfb:.0f} ms, load {load:.0f} ms,"
      f" cold start {m['coldStartup']} ms")
print(f"avg {m['avgFrameRate']} fps, janky {janky}, frozen {frozen}")
print(f"max CPU {m['maxCPUUtilization']}%, max memory"
      f" {m['maxMemoryUsage']} MB, crashes {m['crashCount']},"
      f" ANRs {m['anrCount']}")
print(f"session {sid}")
Point APP_URL at your upload and override the device and network profile through environment variables:
export APP_URL="lt://APP1234567890"  # the app_url your upload returned
DEVICE="Oppo A54" OS_VERSION=11 NETWORK_PROFILE=3g-umts-good python perf_run.py
That command printed this on an Oppo A54:
3g-umts-good: TTFB 1134 ms, load 3711 ms, cold start 593 ms
avg 70.59 fps, janky 14, frozen 0
max CPU 17.5%, max memory 95.72 MB, crashes 0, ANRs 0
session ac52b00a-253b-4958-b5d8-77111f856733
5. Load-Test the Backend Separately
Device profiling drives one phone, so it cannot show how the API behaves when thousands of app users call it at once. Run that as a separate load test with JMeter or Gatling against the endpoints the app calls, with think time and payloads copied from real traffic. The JMeter section below shows how to capture that traffic from a phone.
6. Compare Medians Against the Budget in CI
A single run can mislead: in the measured runs, the same Pixel 7 on the same network loaded the same page in anywhere from 2.2 to 4.6 seconds, so run each journey several times, compare the median with the budget, and fail the build only when the median crosses it. Keep the device model, OS version, and network profile fixed between builds, so a change in the number means a change in the app.
Real Device Results: Two Phones, Two Network Profiles
To make the three layers visible, perf_run.py ran five times in each of four configurations on TestMu AI's real device cloud on October 5, 2026: a Pixel 7 on Android 13 and an Oppo A54 on Android 11, each on the default network and on the 3g-umts-good preset. Every run was a new session that opened the Ecommerce Playground's Tablets category page in the sample app's browser.
Page load, median of five runs per configuration (each column is its own median, so the first two columns do not add up exactly to the third):
| Configuration | TTFB | Time after first byte | Page load |
|---|---|---|---|
| Pixel 7 (Android 13), default network | 1,343 ms | 2,257 ms | 3,754 ms |
| Pixel 7 (Android 13), 3g-umts-good | 1,781 ms | 4,093 ms | 5,874 ms |
| Oppo A54 (Android 11), default network | 1,452 ms | 2,657 ms | 4,249 ms |
| Oppo A54 (Android 11), 3g-umts-good | 1,260 ms | 3,713 ms | 4,973 ms |
App metrics from App Profiling, pooled across both network profiles (ten runs per phone):
| Phone | Median cold start | Slowest cold start | Cold starts over 1 s | Median average FPS | Median janky frames |
|---|---|---|---|---|---|
| Pixel 7 (Android 13) | 356.5 ms | 471 ms | 0 of 10 | 82.3 | 27.5 |
| Oppo A54 (Android 11) | 492 ms | 2,137 ms | 4 of 10 | 63.1 | 180 |
Each layer moved a different number:
- Network - on the Pixel 7, the 3G preset raised median page load from 3,754 ms to 5,874 ms. Most of the increase came after the first byte (2,257 ms to 4,093 ms), while TTFB rose less, from 1,343 ms to 1,781 ms.
- Server - on the Oppo A54, the 3G runs happened to get faster server responses (median TTFB 1,260 ms against 1,452 ms), which hid part of the network penalty: page load rose only from 4,249 ms to 4,973 ms, while the time after the first byte rose from 2,657 ms to 3,713 ms.
- Device - the Oppo A54's median cold start was 492 ms against 356.5 ms on the Pixel 7, but its slowest cold start took 2,137 ms and 4 of its 10 cold starts passed one second. The Pixel 7 never went past 471 ms.
- Rendering - the same journey produced a median of 180 janky frames per session on the Oppo A54 and 27.5 on the Pixel 7.
- Variance - the Pixel 7 on the default network loaded the same page in anywhere from 2,160 ms to 4,575 ms across five runs.
- Stability - all 20 sessions finished with zero crashes, zero ANRs, and zero frozen frames.
One page, one app, and two phones are not a benchmark of either device. The runs show which layer moves which number, which is the reason to record TTFB, load time, and device metrics separately in your own suite.
Run iOS + Android tests written by your AI agent.

How to Use JMeter for Mobile App Load Testing
JMeter load-tests the backend an app talks to; it never runs the app itself. The usual workflow records the app's HTTP traffic through JMeter's proxy and replays it with many virtual users. The JMeter tutorial covers installing JMeter and running a first test plan in CLI mode before you record app traffic.
- Add an HTTP(S) Test Script Recorder to the test plan and start it. Per the JMeter component reference, the recorder listens on port 8888 by default.
- Set the phone's Wi-Fi proxy to the IP address of the machine running JMeter and the recorder's port.
- Install the ApacheJMeterTemporaryRootCA certificate on the phone as a trusted CA so HTTPS requests can be recorded. JMeter exports that certificate into its launch directory the first time the recorder starts.
- On Android 7.0 (API level 24) and higher, apps no longer trust user-added CAs by default, according to Android's network security configuration guide. Record from a debug build whose network security config trusts the certificate in a debug-overrides block, which Android ignores in release builds.
- Walk through the journey in the app, stop the recorder, and replace recorded session tokens and IDs with variables.
- Size the thread group to your target concurrency, add think time between requests, and run with listeners that report response times and errors.
The recording captures HTTP requests only, so JMeter results say nothing about frame rate, memory, or battery on the phone. Pair them with a device-side profile of the same journey.
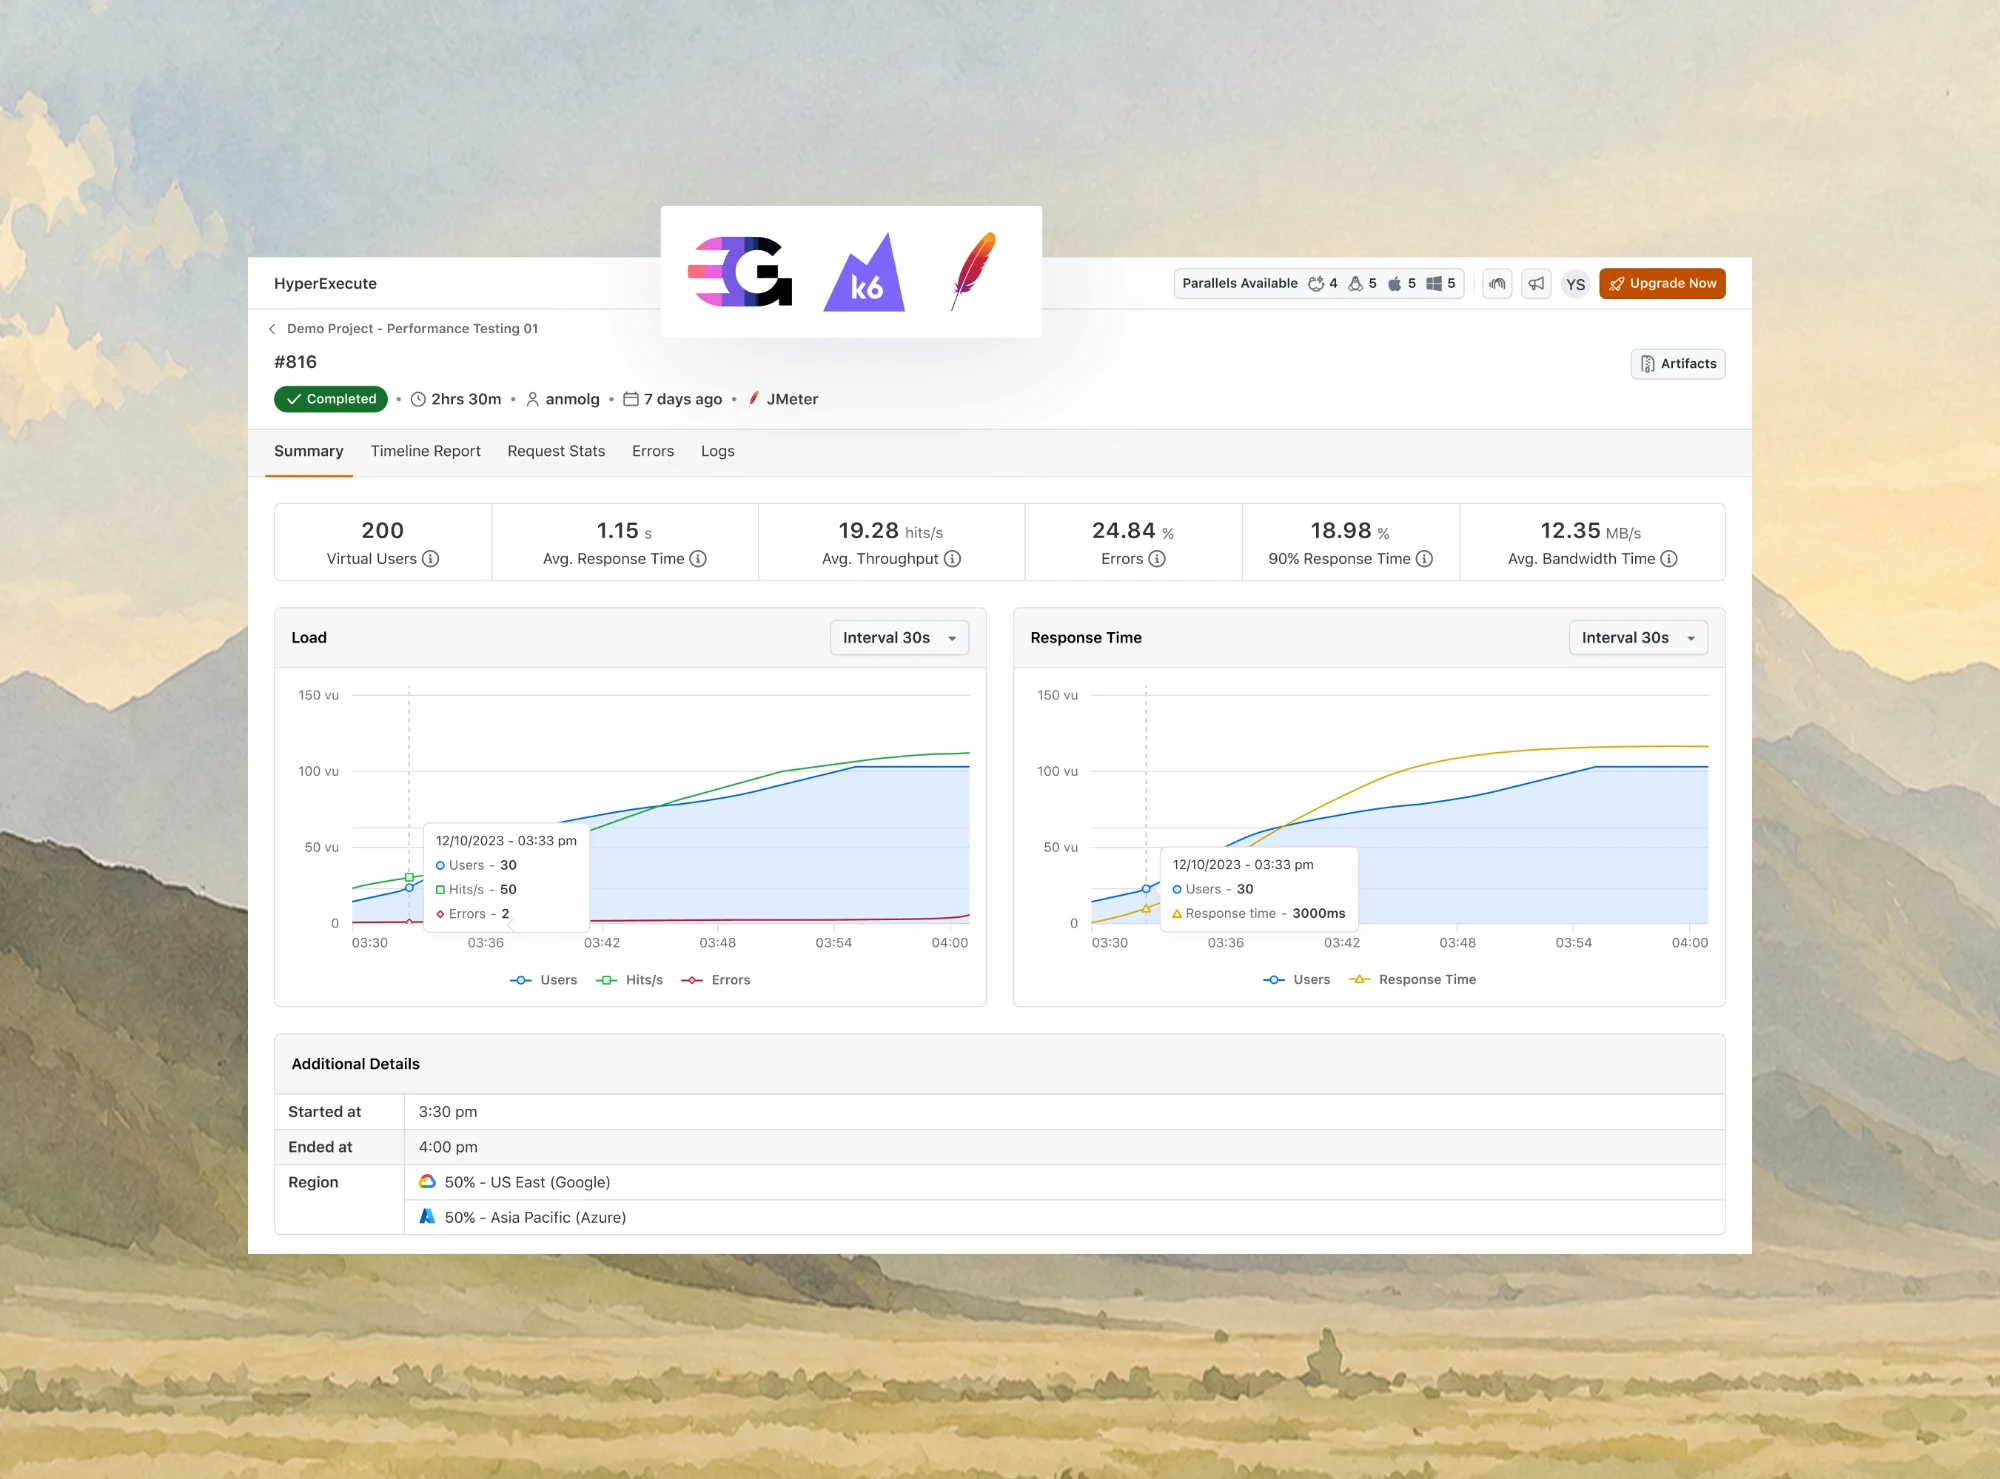
When one machine cannot generate enough load, TestMu AI's JMeter cloud load testing takes the .jmx your team already maintains, provisions the load generators, runs the test, and tears the infrastructure down when it finishes. Existing Gatling simulations written in the Java DSL can also run on TestMu AI's Gatling cloud load testing, which provisions the load generators for each run. Both are part of Performance Testing by HyperExecute.
Tools for Mobile App Performance Testing
No single tool covers all three layers. Native profilers measure the device, throttling presets and proxies shape the network, load generators exercise the server, and RUM SDKs report what happens in the field.
| Tool | Layer | What it measures | Platform |
|---|---|---|---|
| Android Studio Profiler | Device | CPU recordings, memory allocations, heap dumps, and system traces | Android |
| Jetpack Macrobenchmark | Device | Startup and frame timing in automated tests, through StartupTimingMetric and FrameTimingMetric | Android |
| Perfetto | Device | System-wide traces recorded on the phone and opened in the Perfetto UI; the platform-wide tracing tool since Android 10 | Android |
| Xcode Instruments | Device | CPU time with Time Profiler, memory with Allocations and Leaks, main-thread stalls with Hangs, and launch with the App Launch template | iOS (Xcode runs on macOS) |
| XCTest performance tests | Device | Launch duration with XCTApplicationLaunchMetric, tracked across builds | iOS |
| Flutter DevTools | Device | UI thread and raster thread time for each frame in profile mode | Flutter on Android and iOS |
| TestMu AI App Profiling | Device and network | CPU, memory, disk, frame rate, network, crashes, and battery temperature on real devices, plus cold and hot startup, ANRs, and battery drain on Android | Android 9+ and iOS, through Appium |
| Appium | Driver | Drives the user journey that the profilers measure; on TestMu AI it carries the appProfiling and networkProfile capabilities | Android and iOS |
| Apache JMeter | Server | Open-source load tester: response times, throughput, and errors under load, from recorded or scripted HTTP traffic | Any backend |
| Gatling | Server | Load simulations written as code with its Java or JavaScript SDK, or created from a Postman collection or a recorded browser session | Any backend |
| LoadRunner | Server | Commercial load tester, now sold as OpenText Professional Performance Engineering, with protocol support across web, mobile, packaged, and legacy applications | Any backend |
| Firebase Performance Monitoring | Field | App start time, screen rendering, and network requests from real users | Android, iOS, and web |
| MetricKit and Xcode Organizer | Field | Daily power and performance reports delivered to the app, and Organizer charts of launch time, hang rate, memory, and battery use from participating users | iOS |
Challenges in Mobile Performance Testing
- Device fragmentation - performance differs by chipset, memory, and refresh rate, so a single test phone hides most of the spread. A tiered matrix drawn from your analytics covers it.
- Noisy measurements - server response time, radio conditions, and device temperature all move the numbers between identical runs. TestMu AI's network throttling docs also note that results "may vary sometimes based on multiple factors including network conditions and device performance." Fixed devices, repeated runs, and medians keep real regressions visible.
- Emulator numbers - emulators run on the host machine's hardware, so their timings do not transfer to phones. Keep them for functional checks and measure on physical devices.
- Network realism - presets approximate bandwidth and latency but cannot reproduce tower handoffs or cell congestion. Confirm lab results against field data from the regions you serve.
- Backend noise in client numbers - a slow API makes a fast client build look slow. Separate TTFB from client time, as in the real device results, before blaming the app.
Conclusion
Start with the journey your users hit first, cold start to the first useful screen, and set its budget on the lowest-tier phone you support. Run that journey through TestMu AI's App Automation with appProfiling enabled on every build, and use the App Profiling comparison view in Test Insights to see which build moved the median.
Testing web or mobile apps without writing code? KaneAI by TestMu AI turns plain-English instructions into tests.
Author

Srinivasan Sekar
Blogs: 21


Srinivasan Sekar is Director of Engineering at TestMu AI, where he leads engineering and open-source initiatives behind the Selenium and Appium automation grid and owns TestMu AI's MCP Server. A committer to Appium and a contributor to Selenium, WebdriverIO, Taiko, and AppiumTestDistribution, he brings over 15 years of experience in quality engineering and open-source technologies. He is the author of the Apress book 'The MCP Standard: A Developer's Guide to Building Universal AI Tools with the Model Context Protocol,' a Certified Kubernetes and Cloud Native Associate, and an international conference speaker. Before TestMu AI he spent over eight years at Thoughtworks as a Principal Consultant and Quality Architect. Srinivasan holds a B.Tech in Information Technology from Anna University.
Reviewer

Sai Krishna
Reviewer
Sai Krishna is Director of Engineering at TestMu AI, where he leads agentic AI for quality engineering, building AI agents that autonomously drive mobile and conversational test automation. His current focus is Agent Testing and Model Context Protocol (MCP) support for mobile. He is a core contributor and member of the Appium open-source project and the creator of AppiumTestDistribution and appium-device-farm. With over 14 years of experience including more than 9 years at Thoughtworks as a Principal Consultant, he holds a BSc in Electronics and speaks regularly at TestMu and Appium Conf on Appium, mobile automation, and agentic AI in testing.


Mobile App Performance Testing FAQs
Did you find this page helpful?
More Related Learning Hubs







TestMu AI forEnterprise
Get access to solutions built on Enterprise
grade security, privacy, & compliance
- Advanced access controls
- Advanced data retention rules
- Advanced Local Testing
- Premium Support options
- Early access to beta features
- Private Slack Channel
- Unlimited Manual Accessibility DevTools Tests