

Power Your Software Testing with AI Agents and Cloud
The Native AI-Agentic Cloud Platform to Supercharge Quality Engineering. Test Intelligently and Ship Faster.


- TestMu AI (Formerly LambdaTest)
- /
- Blog
- /
- How To Get Started With Cypress Debugging
How To Get Started With Cypress Debugging
This Cypress testing tutorial on Cypress debugging discusses some of the best ways to debug your Cypress tests and explain each in detail
Last Updated on:
Cypress debugging pauses a failing test so you can inspect the real application state, and Cypress testing ships three tools for it: the debugger keyword, the .debug() method, and the .pause() command.
Cypress queues commands and runs them asynchronously, so a debugger statement only halts execution inside a .then() block. Placed outside one, it fires before the commands it was meant to inspect.
This guide covers the debugger keyword, the .debug() method, stack traces, Cypress logs, the .pause() command, AI agents in Cypress debugging, and reducing type errors.
Overview
To start debugging Cypress tests, use the built-in .debug() method to inspect elements directly in DevTools, or use the debugger keyword inside a .then() block to pause execution and analyze variables. These native tools, alongside stack traces and command logs, quickly isolate test failures.
- Best for real-time state inspection: The debugger keyword - pauses Cypress test execution inside a .then() block to let developers inspect variables and analyze application state using browser DevTools.
- Best for quick element inspection: The .debug() method - pauses tests at specific commands to expose the command name, arguments, and current subject directly in the browser console.
- Best for locating error origins: Stack traces - translate error locations to actual source files and line numbers, allowing developers to identify breakdowns and open files directly in VSCode.
- Best for step-by-step execution tracking: Logs - provide visibility into test execution via cy.log() for the Cypress dashboard or console.log() inside a .then() block for the browser console.
- Best for manual execution control: The .pause() command - stops Cypress test execution at a specific command, allowing developers to inspect the application and manually resume using the play button.
- Best for self-healing flaky tests: Cypress AI - uses self-healing mechanics and Cloud MCP integration to query failed run data, identify root causes from stack traces, and suggest fixes.
- Best for preventing type errors: TypeScript - provides strongly typed official declarations, custom command type definitions, and autocomplete options to help developers spot errors before running tests.
- Best for cross-browser cloud testing: TestMu AI - enables teams to run Cypress parallel testing across more than 40 browser versions on Windows and macOS with detailed command logs.
Using debugger in Cypress
Sometimes, when running tests, especially large and complicated ones, it could be very difficult for you to know what exactly went wrong and which part of the code failed to do as expected.
The debugger is very helpful in these kinds of situations. You can stop the test execution at any time and look up the application’s state to see if everything works as it should.
If you have been in the development field for quite a while, you might already know how to use the debugger in other parts of your applications.
However, if you are unfamiliar with Cypress debugging, using the debugger in Cypress might work differently than you think it should.
Even though using a debugger in Cypress is quite similar to using the debugger in other parts of your application (like your front end), it doesn’t work the same way.
You can only use the debugger in Cypress inside the.then() function. Otherwise, it does not work the way it is supposed to.
Let me explain…
Let’s see what goes wrong if we add the debugger outside a .then() function.
it('should work as usual', () => {
  cy.visit('https://ecommerce-playground.lambdatest.io')

  cy.get('[data-test="some-selector"]')
  debugger // Doesn't work
})
Running the test:
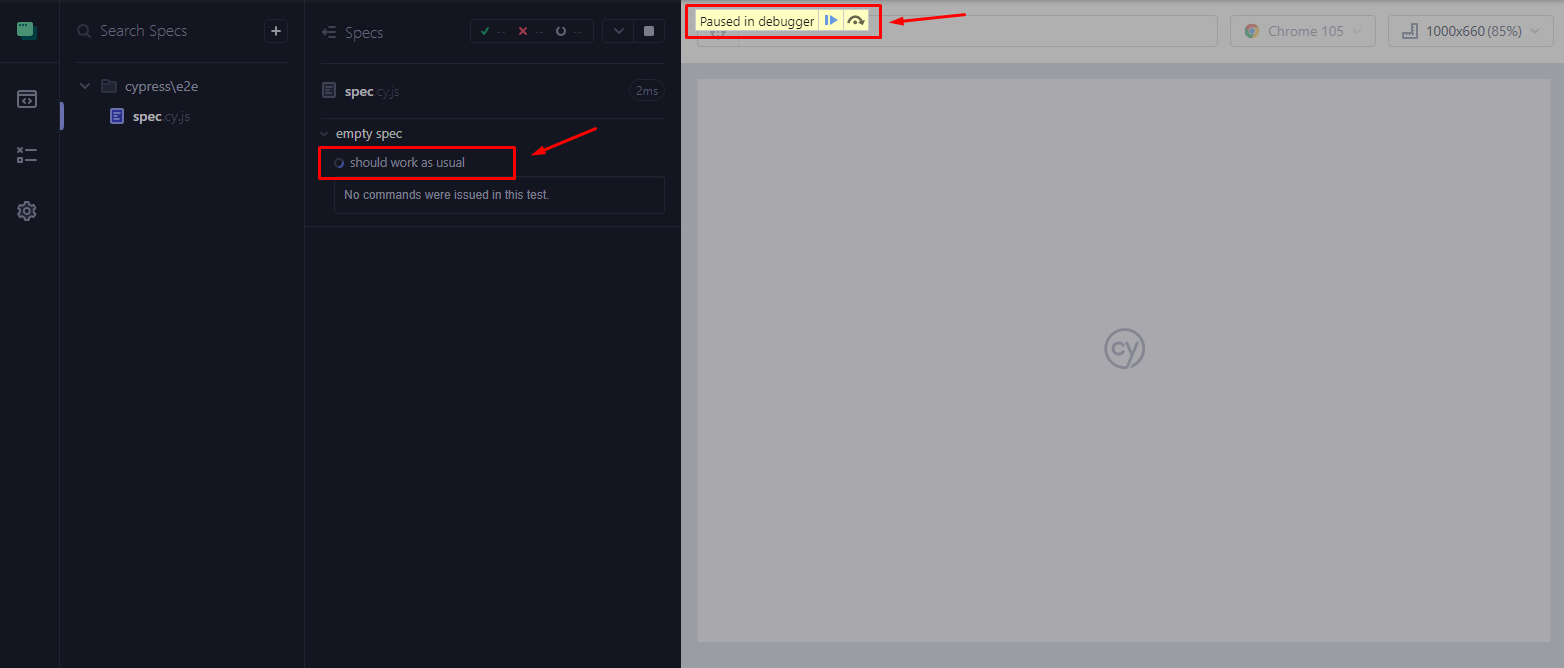
As you can see, the debugger will pause the test to run before the test even starts.
If you have used a debugger before, your expectation might be that first, the cy.visit() and cy.get() functions should run and complete, and then the debugger should pause the test, but that’s not the case.
So, what happened there? Why did the test pause immediately?
Based on the Cypress documentation, it is said that the commands in Cypress are all “Asynchronous,” so what does that mean?
In Cypress, when a set of commands are invoked, they get enqueued for later, and after the whole, it() block is finished, Cypress will run all of the commands in order.
it('hides the thing when it is clicked', () => {
  cy.visit('/my/resource/path') // Nothing happens yet

  cy.get('.hides-when-clicked') // Still nothing happening
    .should('be.visible') // Still absolutely nothing
    .click() // Nope, nothing
    .should('not.be.visible') // Definitely nothing happening yet
})

// Ok, the test function has finished executing...
// We've queued all of these commands and now
// Cypress will begin running them in order!
Based on this information, now you should know why the debugger pauses the test immediately instead of pausing the test after the other two commands have finished running.
The two commands that come before the debugger are only being enqueued to run later, but the debugger, which is not a Cypress command, will not be enqueued and will be invoked immediately.
Causing the test to pause immediately before the other commands can be executed in the queue.
That’s why you should always use the debugger inside the .then() function. This will ensure that the Cypress command will run and complete, and then the debugger will pause the execution of the tests.
Now, let’s re-write the test again, but this time using the debugger inside of the .then() function
it('should only pause when the cy.get() function finishes executing', () => {
  cy.visit('https://ecommerce-playground.lambdatest.io/')

  cy.get('h2')
    .should('exist')
    .then($h2 => {
      debugger
    })
})
In this section of this tutorial on Cypress debugging, the debugger will only pause the test if the h2 element exists in the DOM since we are saying that the debugger should only pause the test only if the h2 element exists in the DOM.
Now, let’s run the test.
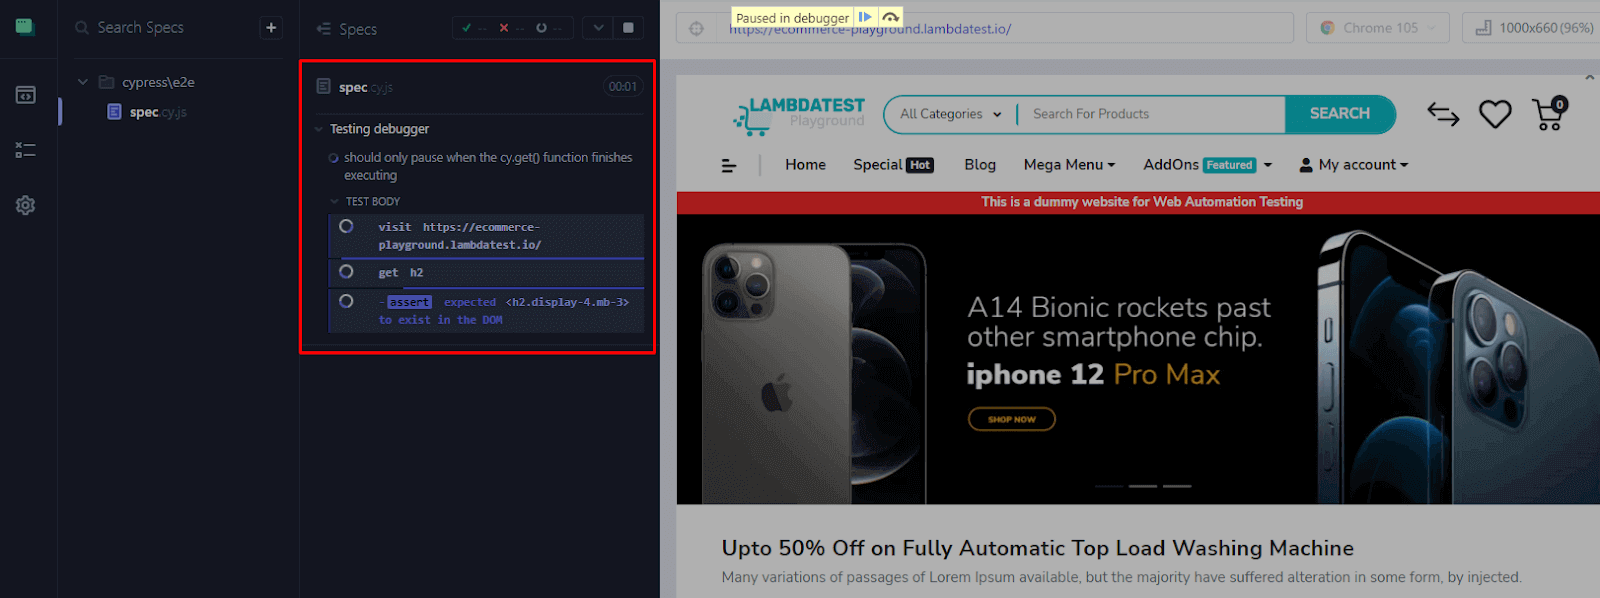
As you can see, now the debugger only pauses the test after it gets the element and makes sure that the element does exist in the DOM; otherwise, it will throw an error.
Let’s fail the assertion on purpose and see if the .then() function runs or not
it('should only pause when the cy.get() function finishes executing', () => {
  cy.visit('https://ecommerce-playground.lambdatest.io/')

  cy.get('[data-cy="some-selector-which-does-not-exist"]')
    .should('exist')
    .then($h1 => {
      debugger
    })
})
Running the test:
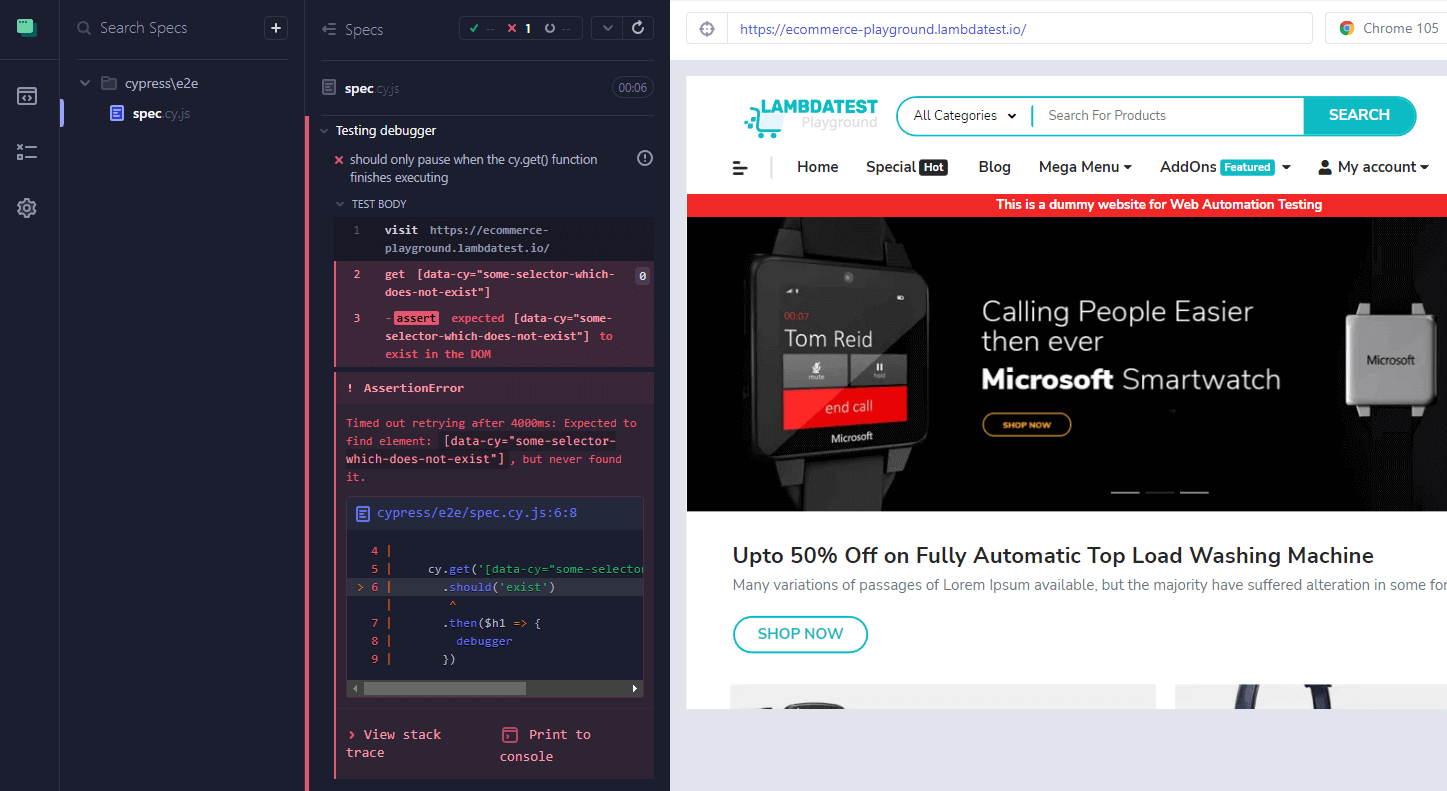
As you can see from the screenshot above, the debugger will never pause the test since the assertion has failed and the .then() block did not have a chance to be executed.

Using the .debug() method for Cypress debugging
The .debug() method is a shortcut for Cypress debugging, which you can chain to every other Cypress command wherever in your tests.
It will expose some details in the browser’s console when the .debug() function triggers:
- Command Name: the name of the last command invoked before the
.debug()triggered. - Command Args: the list of arguments passed to the last method before the
.debug()invocation. - Current Subject: a new variable will be created inside the browser with the name subject, which you can interact with using the browser’s console.
The subject variable is the return value of the Cypress command and can be interacted with by using the browser’s console.
Let’s try it out. In this example, I will get the first h2 element on the page.
it('should pause the test by using the .debug() command', () => {
  cy.visit('https://ecommerce-playground.lambdatest.io/')

  cy.get('h2')
    .should('exist')
    .debug() // debugger
})
Execution:
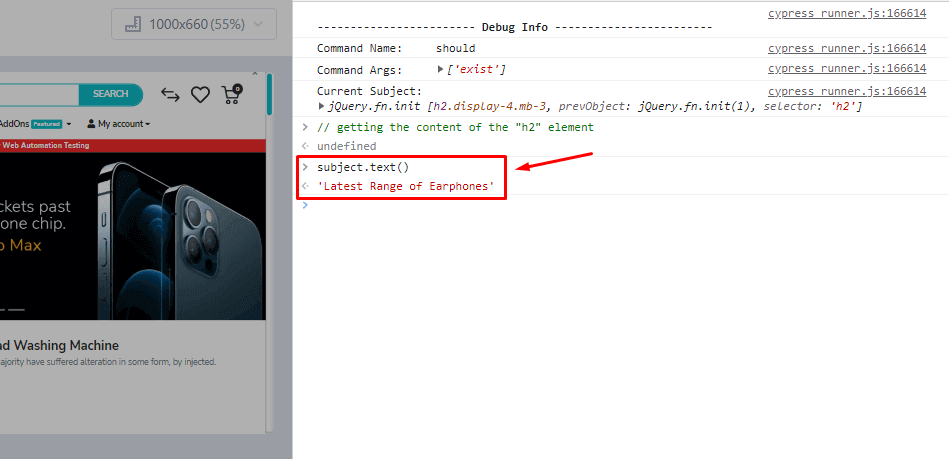
In this case, the subject variable represents the return value of the cy.get('h2') command, which means the subject variable is an h2 element.
When we run the subject.text(), this will give us the text content inside the h2 element.

Using stack trace for Cypress debugging
A stack trace shows a list of method calls that lead to the exception being thrown, together with the filenames and line numbers where the calls happened.
Cypress also translates the stack trace so that the actual source file is shown along with its line numbers instead of the file loaded by the browser.
The Cypress console could be very useful whenever you face an error, luckily, most of the Cypress errors are well explained, and you can easily understand what is going on by simply reading the stack trace.
You can also integrate it with the VSCode IDE to jump right to where the error was thrown and shown in the stack trace.
For example, let’s introduce an error by trying to get an element that doesn’t exist in the DOM
it("should throw an error", () => {
  cy.visit("https://ecommerce-playground.lambdatest.io/")

  cy.get("some-selector-which-does-not-exist").click()
})
Running the test:
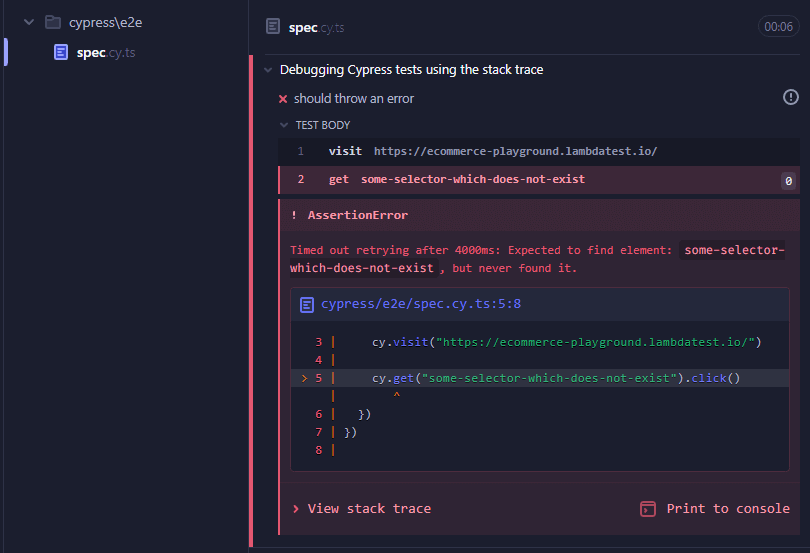
As you can see, Cypress does a great job explaining why and where the error happened.

If you click the “View stack trace” button, you can see the file name in which the error was thrown.
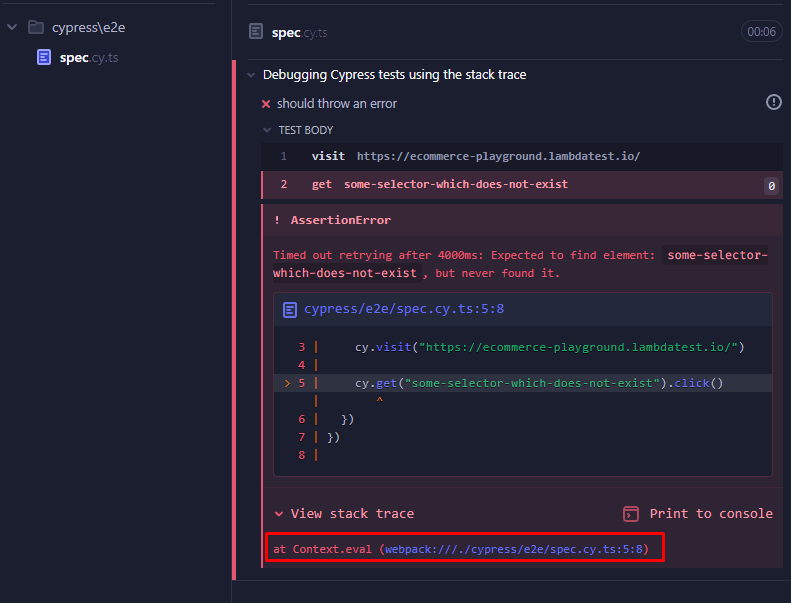
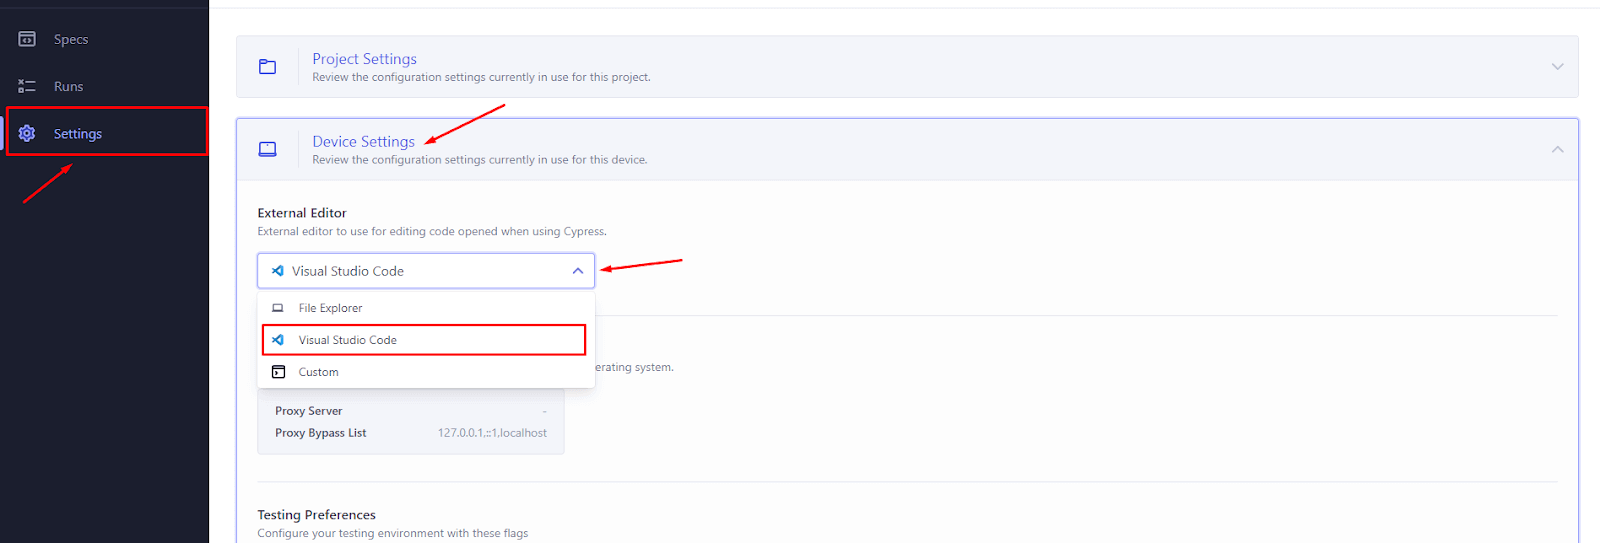
If you click on it, it will ask you to select your IDE to open it. You can choose VSCode from there. If you can not open it, go to the Settings tab -> Device Settings -> External Editor -> Visual Studio Code or your preferred IDE.
Now, if you click on the link on the stack trace dropdown, it will automatically open that file and navigate to that specific line where the error was introduced.
This is a very good feature of Cypress UI automation tool, helps you easily spot errors and locate where the error happened.

Note: Run End-to-End Cypress tests on the cloud grid. Try TestMu AI Now!
Using logs for Cypress debugging
Using logs or console logs is another way to debug your code and get an understanding of what is going on when executing tests.
There are two different commands that you can use for logging outputs inside of your browser’s console, which is the cy.log() and the conventional JavaScript console.log() function.
Using Console log
Since all Cypress commands are asynchronous and will be enqueued for later use, you should never assign returning values of any Cypress command.
If you want to console.log() a returning value of any Cypress command, you should do so inside the .then() function.
If you log a returned value from a Cypress command, it will be logged in the browser’s console, but the value will be just a Cypress Chainer Object.
it('should not return the h2 element', () => {
  cy.visit('https://ecommerce-playground.lambdatest.io/')

  const h2 = cy.get('h2')

  // do not do this, the value will not be the actual "h2" element
  console.log(h2)
})
This is the result that you’ll get, which is not very useful.
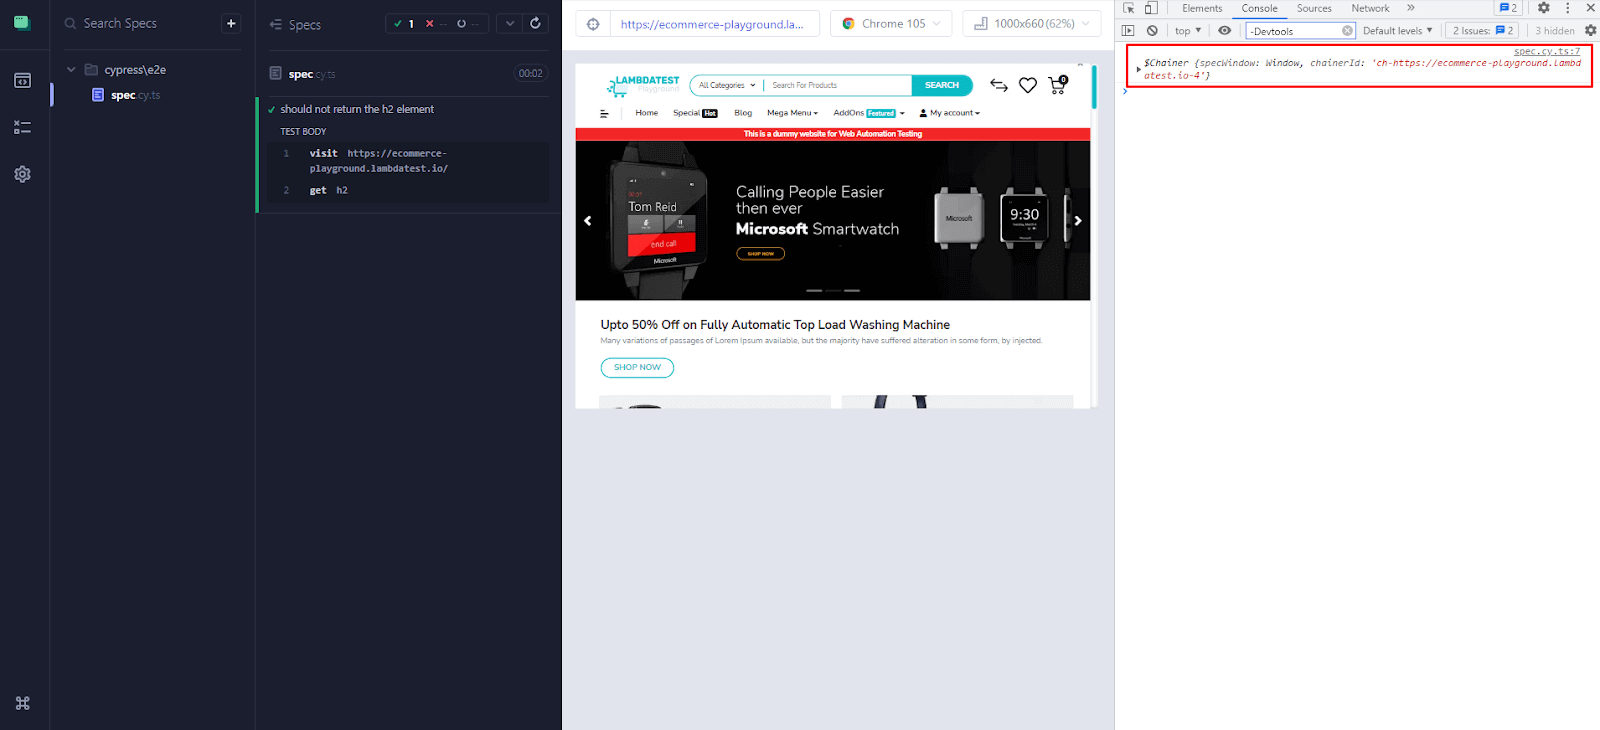
If you want to log the return value of any Cypress command, the right way to do it is by logging the value inside of a .then() function. This way, you will get the actual element after you log it. This is the right way to do it.
('should return the actual h2 element', () => {
  cy.visit('https://ecommerce-playground.lambdatest.io/')

  cy.get('h2').then($h2 => {
    // this will log the actual value of the "h2" element
    console.log($h2)
  })
})
If you want to log the text of the element:
it('should return the text of h2 element', () => {
  cy.visit('https://ecommerce-playground.lambdatest.io/')

  cy.get('h2').then($h2 => {
    // gets back the text inside the "h2" element
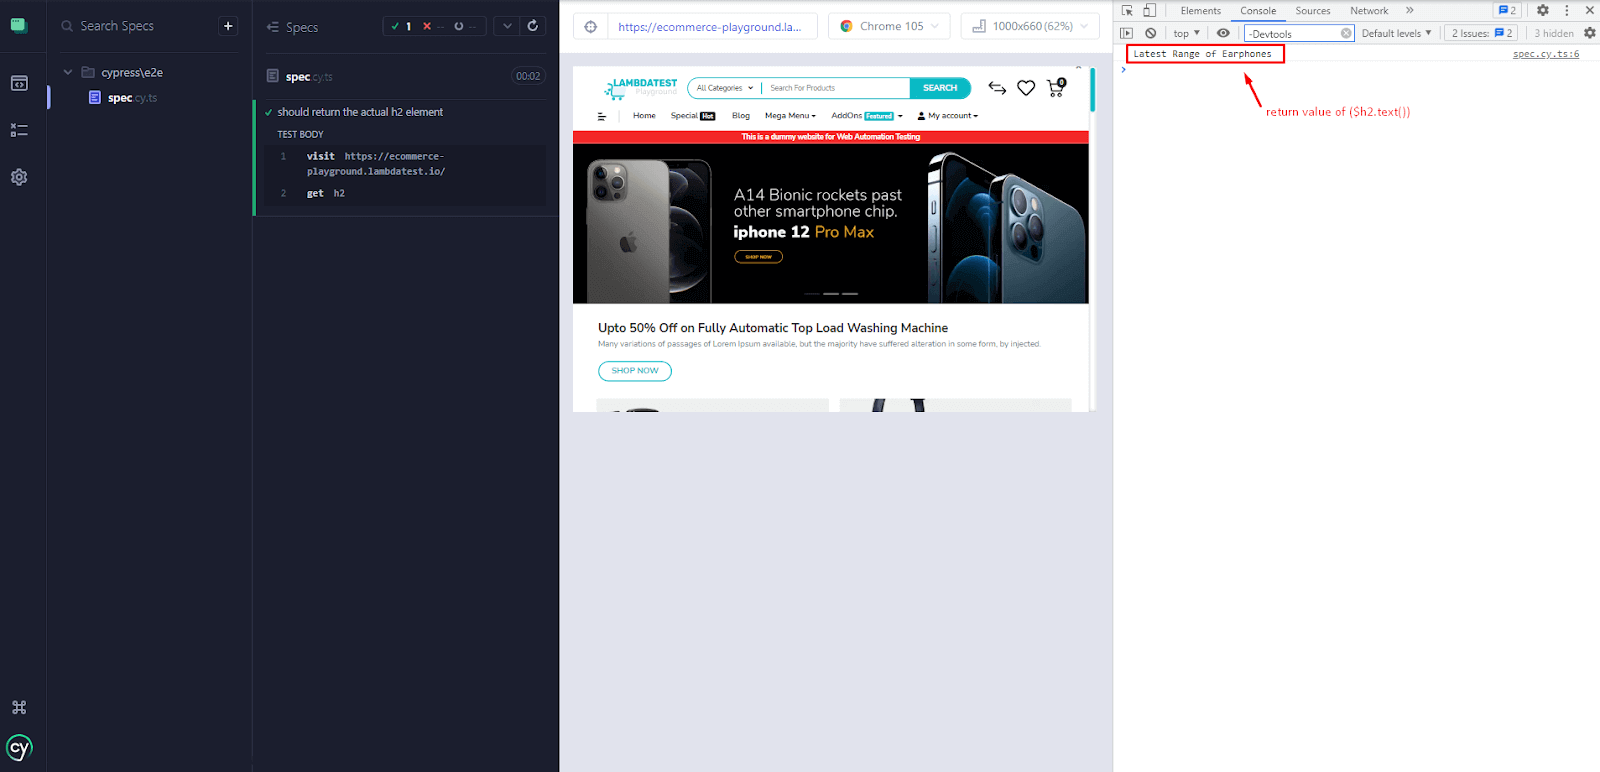
    console.log($h2.text())
  })
})
The result in the browser’s console is the text inside of the h2 element.
Using the Cypress log command
Cypress automation tool provides us with another useful command that will help us log outputs inside of Cypress’s dashboard logger.
You can use the command by running cy.log() anywhere in your code.
If you want to log the output of a Cypress command, just make sure you do it inside the .then() function since Cypress commands are being enqueued and not instantly executed.
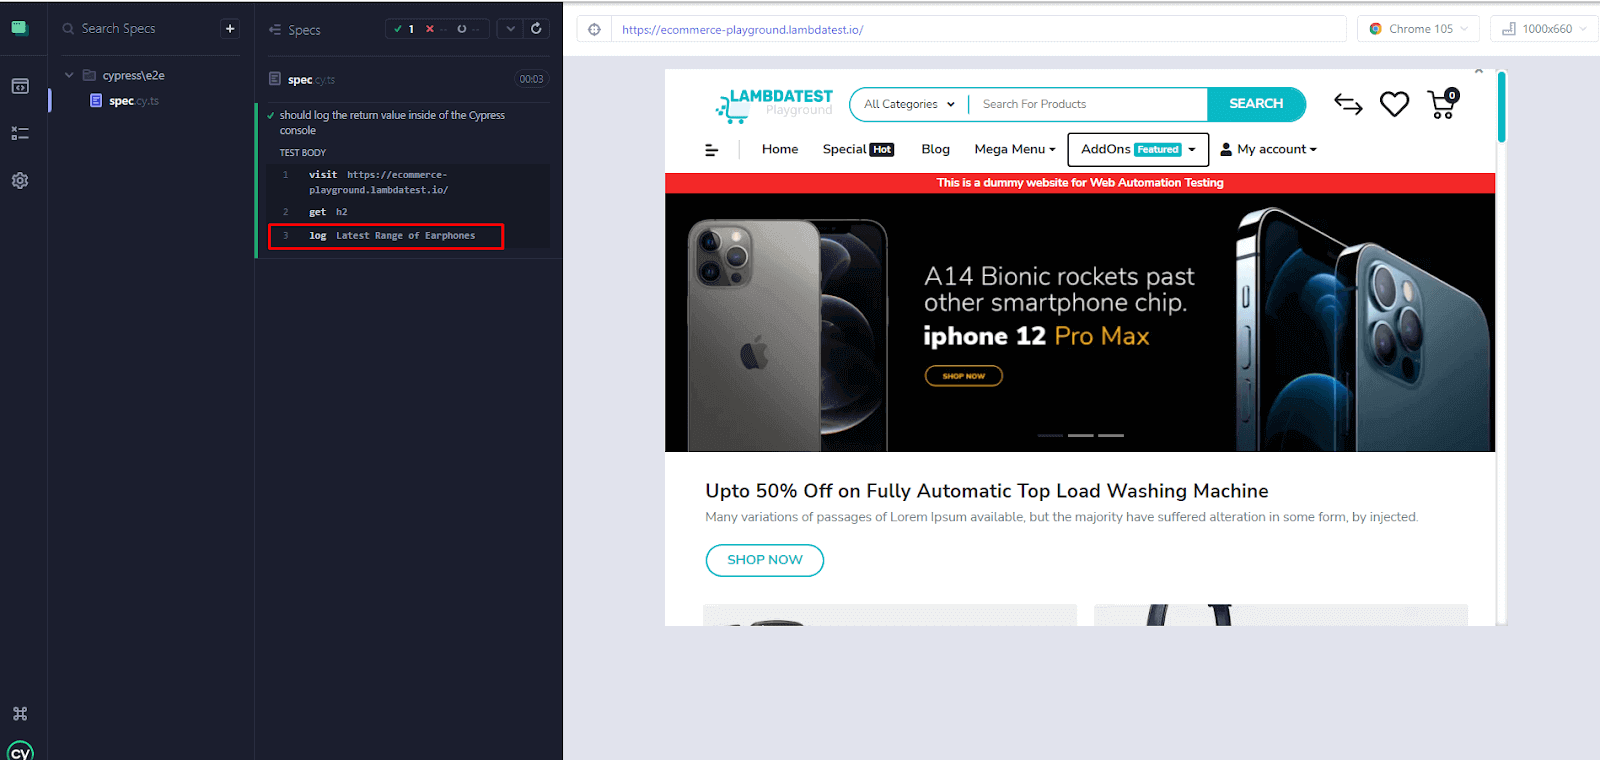
The difference between the regular console.log() function and the Cypress log() function is that the Cypress log() function will log the output inside of the Cypress console, but the console.log() command will log it inside of the browser’s console.
it('should log the return value inside of the Cypress console', () => {
  cy.visit('https://ecommerce-playground.lambdatest.io/')

  cy.get('h2').then($h2 => {
    cy.log($h2.text())
  })
})
The result in the Cypress console:
Using .pause() command for Cypress debugging
Cypress exposes another command which helps in pausing the test execution and making it easily debuggable, you can then manually start the test again and resume executing Cypress commands.
The .pause() command is also a Cypress chainable and can be chained with any other Cypress command.
Cypress.pause() example of use
it("should pause the test", () => {
  cy.visit("https://ecommerce-playground.lambdatest.io/")

  cy.get("input[name='search']")
    .first()
    .should("exist")
    .and("be.visible")
    // pauses the command execution
    .pause()
    .type("Iphone 12")
})
In this section of this tutorial on Cypress debugging we are getting the input elements in the DOM, which has a “name” attribute of “search,” and we are selecting the first one by running the .first() command.
And we are asserting two assertions on them; after that, we are typing something inside of the input, but just before typing the input, we have run the .pause() method.
The code will run the first three commands and pause before running the fourth and final commands.
Running the test:
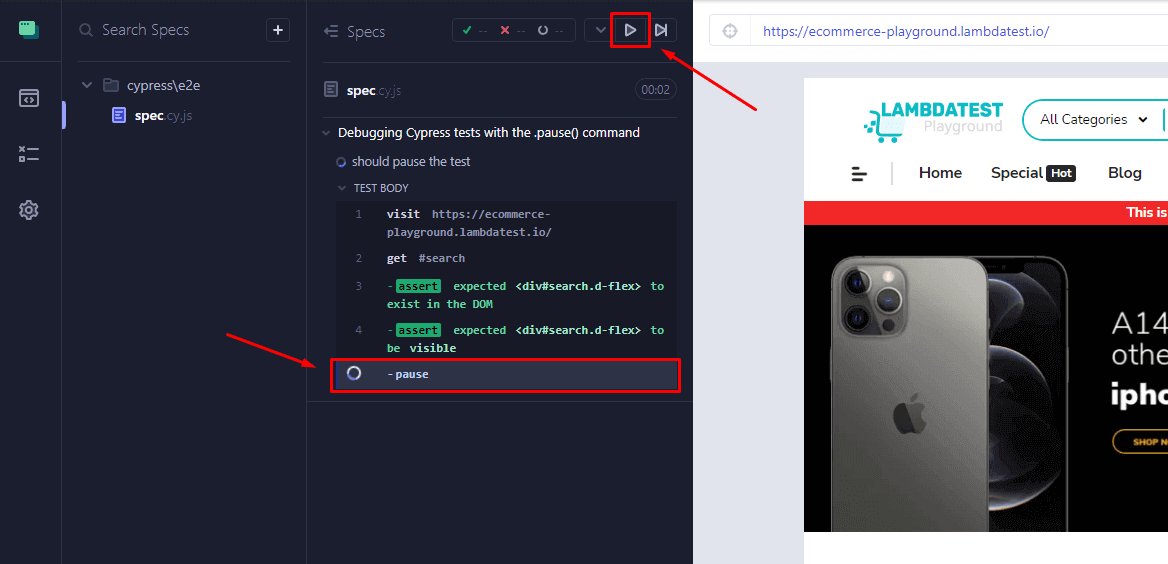
As you can see, a new button has appeared on the top of the Cypress console, and also, we can see in the final output of the logs it is written - pause, which is caused by our pause command.
Now, if we press the play button, the test will resume, and the commands will resume executing again.
Resuming the test execution:
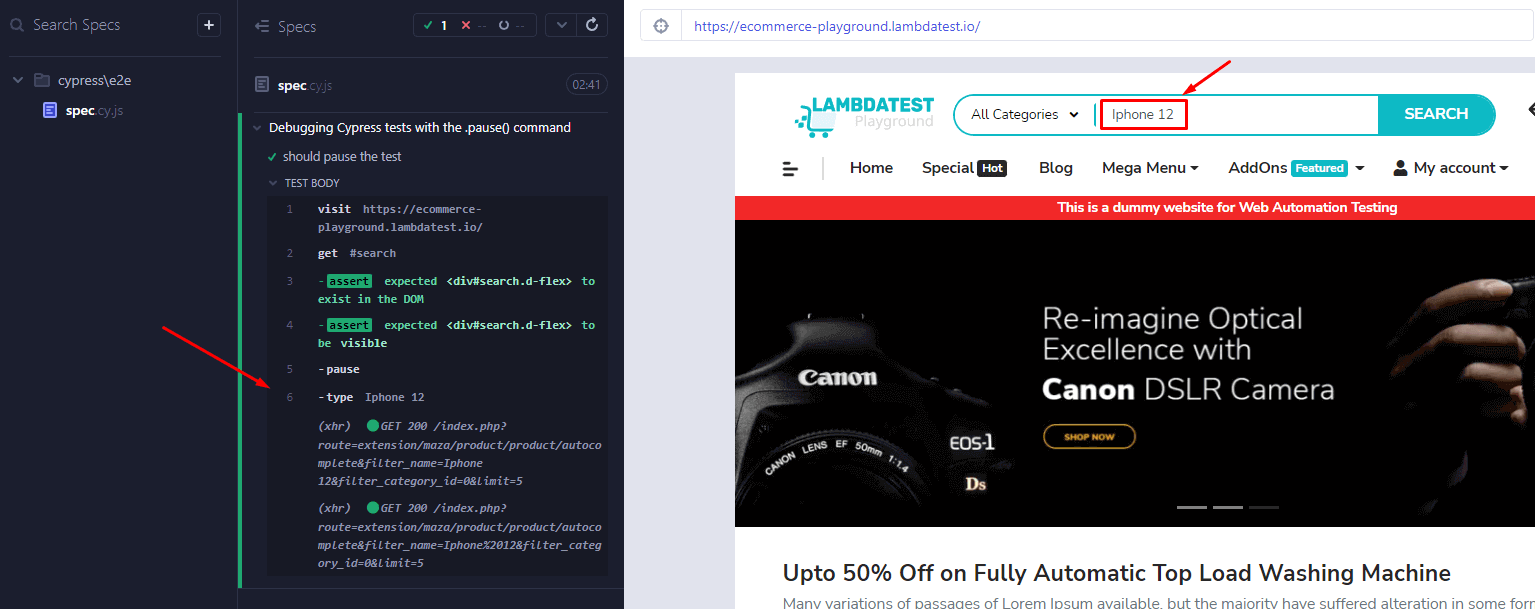
The test will resume, and the last command will then be executed. Finally, the text will be typed inside of the search input.

How Do AI Agents Debug Cypress Tests?
AI agents debug Cypress tests by reading real run data instead of guessing from your source code. Cypress Cloud MCP is a remote Model Context Protocol server that hands an AI assistant your run statuses, failure details, error messages and stack traces.
- Cloud MCP access: the agent queries Cypress Cloud over HTTP for run status, failure details and flaky test reports, so it answers from the run that actually failed.
- Test Replay links: the agent returns the Test Replay URL for a failed run, so you open the recorded DOM, console and network state instead of re-running the spec locally.
- Assistant coverage: any agentic environment that supports remote MCP servers can connect, including Claude, Cursor, GitHub Copilot and the OpenAI Codex CLI.
- Flaky test triage: the agent ranks specs that pass and fail on the same commit, which is the question a single stack trace cannot answer.
- No auto-repair: Cloud MCP explains a failure, it does not rewrite a selector, so the fix still lands in your spec file by hand or through your coding assistant.
For teams working on flaky tests or brittle selectors, Cypress AI adds self-healing mechanics on top of Cloud MCP, surfacing root causes from stack traces and suggesting fixes without leaving the development environment.
[Bonus Tip] How to reduce type errors in Cypress?
I will give you a bonus, this one is not for Cypress debugging but for reducing and spotting errors inside of your application before running the tests, and it will provide you with a faster development pace.
Use TypeScript
TypeScript is a programming language that enables developers to write code in a type-safe way. Since Cypress ships with the official type declarations and is strongly typed, it will be easier for developers to spot and find type errors before running the tests.
Install TypeScript
Install typescript by running the following command.
Note: TypeScript 3.4+ is required to be used with Cypress.
Create a tsconfig.json file inside of the cypress folder with the following configurations.
{
  "compilerOptions": {
    "target": "es5",
    "lib": ["es5", "dom"],
    "types": ["cypress", "node"]
  },
  "include": ["**/*.ts"]
Adding types for your custom commands
It is also important for you to add types for the custom commands that you will create and use throughout your tests and Cypress allows you to do that.
Let’s say you have the following command.
Cypress.Commands.add("login", (email, password) => {
  /**
   * Login to the application
   * With Cypress
   * ...
   */

  return "{ ... }"
})
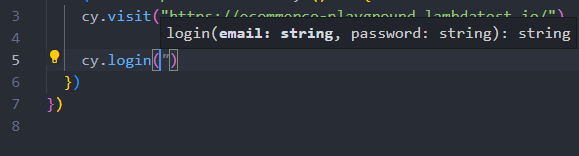
If you don’t declare the types for the login custom command, you will get a TypeScript error instantly, so let’s go ahead and create the types for it.
Inside your support folder, create a file with the name index.ts and add the following code.
// cypress/support/index.ts
declare global {
  namespace Cypress {
    interface Chainable {
      login(email: string, password: string): string
    }
  }
}
Now your Cypress tests should be able to work with TypeScript perfectly. If you are still getting errors, restart the TypeScript server by pressing the Ctrl+Shift+P on Windows or CMD+Shift+P on macOS and type > in the beginning and search for >TypeScript: Restart the TS server and press it. This will restart your TS server and load the new configurations.
Now you will see an autocomplete option for all of the Cypress commands.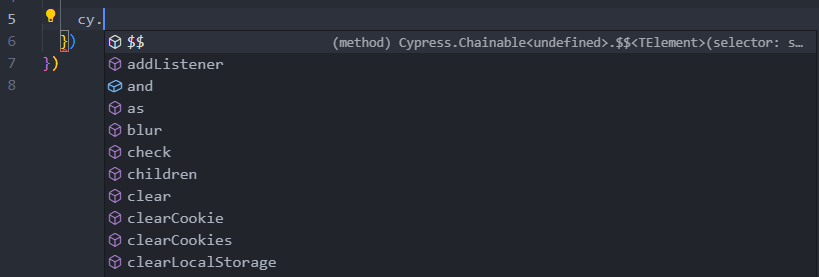
You will also see an autocomplete option for your custom commands.
To get accurate results, you must run Cypress tests on real browsers and OS. The best way to do this is by using TestMu AI’s cloud-based automation testing platform. Accelerate your go-to-market delivery by performing Cypress parallel testing on 40+ versions on the latest across Windows and macOS without compromising accuracy.
For detailed command logs when running Cypress tests on the TestMu AI cloud, refer to the Cypress detailed command logs documentation.
For testing web applications with basic authentication on the TestMu AI platform, refer to the basic authentication for web automation guide.
Subscribe to the TestMu AI YouTube channel for tutorials around Selenium testing, Playwright browser testing, Appium, and more.
If you’re a developer who needs to perform Cypress end-to-end testing for your app and you’d like to get an overview of everything Cypress has to offer, the Cypress 101 certification is for you.

Conclusion
In this Cypress debugging tutorial, we have discussed the best ways to debug Cypress tests easily. Cypress UI testing is an excellent framework for validating your front-end applications. It provides us with many great features to debug our test suites easily.
Here are the different ways to debug your Cypress tests:
- Using a debugger.
- Using
.debug()Cypress command. - Using the stack trace.
- Using logs
console.log()andcy.log(). - Using the Cypress
.pause()command. - Using AI agents through Cypress Cloud MCP.
- Using TypeScript to reduce type errors.
Author

Dastan
Blogs: 4
Dastan, known online as dcodes, is a full-stack developer and technical writer with several years of experience in software engineering. On TestMu AI (formerly LambdaTest), he authored tutorials on Cypress testing, Cypress best practices, Cypress debugging, Playwright with Cucumber, and Podman versus Docker containerization. He also publishes developer tutorials on his platform dcodes.dev and founded rustfinity.com, a platform for learning the Rust programming language.
Cypress Debugging FAQs
Did you find this page helpful?
More Related Blogs
TestMu AI forEnterprise
Get access to solutions built on Enterprise
grade security, privacy, & compliance
- Advanced access controls
- Advanced data retention rules
- Advanced Local Testing
- Premium Support options
- Early access to beta features
- Private Slack Channel
- Unlimited Manual Accessibility DevTools Tests