

Power Your Software Testing with AI Agents and Cloud
The Native AI-Agentic Cloud Platform to Supercharge Quality Engineering. Test Intelligently and Ship Faster.


- TestMu AI (Formerly LambdaTest)
- /
- Blog
- /
- 13 Best Performance Testing Tools Compared in 2026
13 Best Performance Testing Tools Compared in 2026
Compare 13 performance testing tools scored on protocols, load model, CI gating, and reporting, with measured k6, Artillery, and JMeter runs.
Last Updated on:
On This Page
- Performance Testing Defined
- 13 Tools Compared
- How Tools Were Scored
- 1. Apache JMeter
- 2. Grafana k6
- 3. Gatling
- 4. Locust
- 5. Artillery
- 6. TestMu AI HyperExecute
- 7. BlazeMeter
- 8. Azure App Testing
- 9. OctoPerf
- 10. LoadView
- 11. OpenText PPE
- 12. Tricentis NeoLoad
- 13. Sitespeed.io
- Realistic Traffic Models
- Test Data and Scores
- Free and Open Source
- Other Tools Considered
- Why Teams Need Them
- Virtual User Math
- Web vs Mobile Tools
- How to Choose
- Conclusion
A checkout flow that passes every functional test in staging can still time out when launch-day traffic arrives, and that failure is expensive. New Relic's 2025 Observability Forecast puts the median cost of a high-impact outage at $2 million per hour.
Performance testing tools create that traffic on purpose before release, so you can measure response times and error rates and find the bottleneck while it is still cheap to fix. Thirteen tools are scored below on six criteria taken from their own documentation, and the load model claims were measured by running k6 and Artillery against the same slowdown and a JMeter plan on managed cloud infrastructure. If you only need load generation, the narrower load testing tools roundup compares that subset.
Overview
Start a performance testing tool shortlist with Apache JMeter and Grafana k6. JMeter tests HTTP, SOAP, JDBC, JMS, and other protocols from one GUI-built plan, while k6 runs JavaScript or TypeScript load tests that fail a CI build when a response-time threshold is missed. The tools below cover the rest, from Python scripting to SAP protocols and managed load generation.
Which Performance Testing Tools Score Highest?
- Azure App Testing, 27/30: The highest total. It runs existing JMeter and Locust scripts unchanged on managed engines, fails an Azure Pipelines run when any test criterion fails, and publishes a ceiling of 100,000 virtual users per run.
- Grafana k6, 26/30: Arrival-rate executors, thresholds that exit non-zero, and percentiles up to p(99.99) earn top marks on load model, CI gating, and reporting. Protocols score lowest, since anything beyond HTTP, WebSockets, and gRPC needs an extension.
- Gatling, 26/30: Open injection steps and simulations in Java, Kotlin, Scala, JavaScript, or TypeScript earn top marks on load model and scripting. Gatling's FAQ puts one local machine at 64,000 users per second when each user sends one request, a limit set by the operating system.
- BlazeMeter, 26/30: Existing JMeter, Gatling, k6, and Locust tests run unchanged, failure criteria can fail a CI build, and reports carry 99th percentile lines and baseline trends. Load model is its weak score, because load is set by user count rather than arrival rate.
Best Tool by Job
- Best for protocol breadth: Apache JMeter is open source (Apache-2.0) and covers HTTP, SOAP, REST, JDBC, JMS, FTP, LDAP, and mail protocols from one GUI-built test plan that you run in CLI mode for real load.
- Best for load tests in CI: Grafana k6 is open source, its scripts are JavaScript or TypeScript, and a failed threshold ends the run with a non-zero exit code, so a pipeline can block a slow build.
- Best for Python teams: Locust is open source (MIT), user behavior is plain Python code, and its master and worker mode spreads load across several machines.
- Best for running existing JMeter or Gatling plans: TestMu AI HyperExecute runs uploaded .jmx plans and Gatling Java simulations on managed infrastructure, with no load generators to provision, and its JMeter Summary report shows average and 90th percentile response time next to error percentage.
- Best for SAP and enterprise apps: Tricentis NeoLoad is a commercial suite that combines protocol-level load with RealBrowser timings in one run and covers SAP, Citrix, Oracle, and mainframe protocols.
- Best for frontend speed metrics: Sitespeed.io is open source (MIT) and drives a real browser to measure Core Web Vitals, Speed Index, and a HAR waterfall, so pair it with a load generator.
Which Load Model Shows Real Slowdowns?
An open workload model shows real slowdowns, because it keeps starting new requests at a set arrival rate while the application struggles. A closed model runs a fixed number of virtual users that each wait for a response, so it sends fewer requests during a slowdown and its percentile response times understate the problem, as the k6 test run below shows.
What Is Performance Testing?
Performance testing is a type of non-functional testing that measures how fast, stable, and scalable an application is under a defined workload, using response time, throughput, error rate, and resource usage as pass or fail signals. Each test type answers a different question:
- Load testing - expected peak traffic: does the app meet its response-time targets?
- Stress testing - traffic beyond capacity: where does it break, and does it recover?
- Soak testing - steady load for hours: do memory leaks or exhausted connection pools appear?
- Scalability testing - rising load while resources are added: does throughput grow with them?
- Spike testing - a sudden burst of users: does autoscaling react before requests start failing?
13 Best Performance Testing Tools, Compared
By total score, the best performance testing tools in 2026 are Azure App Testing, Grafana k6, Gatling, and BlazeMeter, followed by Tricentis NeoLoad for enterprise protocols. Apache JMeter still covers the widest open-source protocol set, and Sitespeed.io is the frontend measurement tool to pair with any of them.
| Tool | Type | Test authoring | Open source | Best for | Score |
|---|---|---|---|---|---|
| Apache JMeter | Load generator | GUI, saved as .jmx | Yes (Apache-2.0) | Widest protocol coverage | 22 / 30 |
| Grafana k6 | Load generator | JavaScript, TypeScript | Yes (AGPL-3.0) | Load tests gated in CI | 26 / 30 |
| Gatling | Load generator | Java, JS, TS, Scala, Kotlin | Core only (Apache-2.0) | High throughput per generator | 26 / 30 |
| Locust | Load generator | Python | Yes (MIT) | Python teams | 21 / 30 |
| Artillery | Load generator | YAML, JavaScript, TypeScript | Yes (MPL-2.0) | Node.js teams, Playwright load | 24 / 30 |
| TestMu AI HyperExecute | Managed cloud | JMeter .jmx, Gatling Java | No | Existing JMeter or Gatling plans | 21 / 30 |
| BlazeMeter | Managed cloud | JMeter, Gatling, k6, Locust | No | Hosted JMeter with mocks and test data | 26 / 30 |
| Azure App Testing | Managed cloud | JMeter, Locust | No | Apps hosted on Azure | 27 / 30 |
| OctoPerf | Managed cloud or on-premise | Web UI, JMeter import | No | A GUI on top of JMeter | 24 / 30 |
| LoadView | Managed cloud | EveryStep recorder, C# | No | Real-browser load | 21 / 30 |
| OpenText PPE (LoadRunner) | Enterprise suite | VuGen | No | Legacy and packaged-app protocols | 22 / 30 |
| Tricentis NeoLoad | Enterprise suite | Codeless, YAML | No | SAP and enterprise apps | 25 / 30 |
| Sitespeed.io | Frontend measurement | CLI, scripted journeys | Yes (MIT) | Core Web Vitals regressions | 14 / 30 |
How These 13 Performance Testing Tools Were Scored
Every tool was scored 0 to 5 on the six criteria below, from what its own documentation states rather than its marketing page. Where a vendor publishes no answer, the criterion scored 0 instead of a generous guess. One criterion, the load model, cannot be settled from a documentation page at all, so it was measured by running two of the tools against the same target.
- Protocol coverage - which protocols and targets the tool can put load on, from HTTP alone through JDBC, JMS, and mail, to SAP, Citrix, and mainframe.
- Load model - whether it can start new users at an arrival rate, which is the open model, or only hold a fixed number of concurrent users, which is the closed model.
- Scripting and reuse - the authoring language, and whether an existing .jmx plan or simulation runs on it without a rewrite.
- CI gating - whether a failed pass or fail criterion returns a non-zero exit code that can block a pipeline, rather than just a plugin that launches a run.
- Reporting - which percentiles, trends, and error breakdowns each run produces, and whether results line up with APM data.
- Managed scale - how many virtual users you get without provisioning and maintaining your own load generators.
The full scores, the two-tool measured run, and what each tool reported about the same slowdown are in test data and full scores below the list.
Disclosure and how to read this ranking
TestMu AI HyperExecute is our own product, scored on the same six criteria as everything else, limitations included. Nothing here is paid placement, and every other tool's claims were checked against the vendor's own live documentation in September 2026. The numbered sections group tools by how you run them, open-source generators first, then managed clouds, then enterprise suites, so a section number is a grouping rather than a rank. The scores table is the like-for-like comparison.
1. Apache JMeter: Best for The Widest Protocol Coverage
Apache JMeter is an open source Java load testing tool from the Apache Software Foundation, released under the Apache License 2.0. The JMeter component reference documents samplers for HTTP, FTP, JDBC, LDAP, JMS, SMTP, raw TCP and Bolt requests against Neo4j. Protocol coverage is the reason it stays in the roundup.
The documentation names two limits. The user manual states that GUI mode should only be used for creating the test script and that CLI mode must be used for load testing. JMeter also works at protocol level and does not execute the Javascript found in HTML pages, so it measures server response rather than rendered page behaviour.
Key features
- Protocol Samplers - Samplers in the core distribution include HTTP Request, JDBC Request, LDAP Request, JMS Publisher, TCP Sampler and Bolt Request.
- HTML Dashboard - The -e and -o flags generate a report with an APDEX table, three configurable percentiles defaulting to 90, 95 and 99, and an error table.
- Open Model - The Open Model Thread Group accepts schedules such as rate(1/sec) random_arrivals(2 min) rate(3/sec) for arrival rate injection, and the manual labels it experimental.
- Distributed Mode - One controller drives jmeter-server nodes over RMI. Each node runs the full test plan, so 1000 threads with 6 servers injects 6000 threads.
- Live Metrics - The Backend Listener streams active thread counts, response times, percentiles and server hits per second to Graphite or InfluxDB while the test runs.
Load model
The default Thread Group is closed. It sets the number of threads and the ramp up time, so concurrency is fixed and arrival rate floats with server latency. The Constant Throughput Timer and Precise Throughput Timer add pacing. The Open Model Thread Group builds arrival rate schedules from rate(), random_arrivals() and pause(), and setUp Thread Group and tearDown Thread Group handle work either side of the main run.
Integrations
Apache ships no CI plugin, and continuous integration comes through third party libraries for Maven, Gradle and Jenkins. The jmeter-maven-plugin stops Maven execution by default when the results file contains failures, with errorRateThresholdInPercent setting a tolerated error percentage. The Backend Listener feeds Graphite or InfluxDB, and the manual shows InfluxDB data viewed through Grafana.
Pros and cons
| Pros | Cons |
|---|---|
| Core samplers extend beyond HTTP, covering JDBC, JMS, LDAP, FTP, mail and raw TCP; the HTML dashboard delivers APDEX, three configurable percentiles and an error breakdown with no extra tooling; the Apache License 2.0 imposes no seat count, no run duration cap and no feature gate. | Test plans are GUI-authored .jmx files rather than code, which merge awkwardly in version control; Apache publishes no CLI option to fail a run on a response time or error rate threshold, so gating needs a third party plugin; scaling past one machine means maintaining an RMI server fleet on exactly the same JMeter version. |
Pricing
- No plans or tiers are published.
- Apache JMeter is released under the Apache License 2.0, and the 5.6.3 distribution downloads from the project site with no published thread ceiling, no run duration cap and no paid edition.
- Load generator infrastructure is the adopting team's own cost.
Last verified: September 2026.
Verdict: Choose JMeter when the system under test speaks more than HTTP, or when a team owns .jmx assets. Teams that need pipeline gating or a large virtual user count should budget for a plugin and a load generator fleet.
2. Grafana k6: Best for Load Tests Gated in CI
Grafana k6 is an open source load testing tool released under the AGPL-3.0 license and maintained by Grafana Labs. The engine is written in Go, and k6 transpiles TypeScript files through esbuild. The protocols k6 supports out of the box are HTTP/1.1, HTTP/2, WebSockets and gRPC, and everything else arrives through the extension registry.
Pass/fail gating is the strongest part of the tool. Thresholds declare criteria such as p(95) response time or error rate, and a breach returns a non-zero exit code that fails the pipeline. Tests are plain JavaScript or TypeScript files, so they live in the application repository and review like any other source change.
Key features
- Threshold Gating - Thresholds set pass/fail criteria on any metric. A passing run exits 0 and a breach exits non-zero, commonly 99, so pipelines fail automatically.
- Configurable Percentiles - Trend metrics default to avg, min, med, max, p(90) and p(95), and summaryTrendStats accepts finer values such as p(99), p(99.9) and p(99.99).
- Browser Module - The k6/browser module drives a Chromium based browser and records browser_web_vital_lcp, cls, inp, fcp and ttfb. It tries to match Playwright's API behavior.
- Extension Registry - The registry lists 25 extensions, 12 official and 13 community, covering Redis, SQL drivers, Kafka and MQTT. Some need an xk6 built binary.
- Single Instance Scale - One k6 instance runs 30,000 to 40,000 virtual users. Larger tests move to the Kubernetes based k6 Operator or to Grafana Cloud k6.
Load model
Grafana k6 models load through named executors. The closed model uses shared-iterations, per-vu-iterations, constant-vus and ramping-vus, where a new iteration starts only after the previous one finishes. The open model uses constant-arrival-rate and ramping-arrival-rate, which start iterations on a schedule independent of response time and avoid coordinated omission. Scenarios combine several executors in one script, and the vus, duration and stages options remain as shortcuts.
Integrations
Grafana documents CI guides for twelve platforms, including GitHub Actions, GitLab, Jenkins and CircleCI, and maintains two official GitHub Actions, grafana/setup-k6-action and grafana/run-k6-action. Local results stream to thirteen third-party services such as Prometheus remote write, Datadog and OpenTelemetry. The handleSummary() function emits JUnit XML, and converters import HAR, Postman and OpenAPI definitions.
Pros and cons
| Pros | Cons |
|---|---|
| Arrival rate executors give an open workload model without extra plumbing, and the documentation explains why that matters for coordinated omission; thresholds turn any metric into a build gate, backed by twelve documented CI guides and two official GitHub Actions; percentile reporting reaches p(99.99) and local results stream to thirteen third-party services. | Protocols beyond HTTP/1.1, HTTP/2, WebSockets and gRPC depend on extensions, and the registry lists no SAP, Citrix or mainframe entries; open source k6 has no coordinated multi-machine mode, so runs past one machine need manual execution segments, the k6 Operator or the commercial cloud; Grafana Cloud k6 does not publish per test virtual user and duration caps as numbers. |
Pricing
- Open source k6 has no usage caps on self-hosted runs.
- On Grafana Cloud k6, Free allows 500 virtual user hours per month and 14 days of retention.
- Pro keeps that allowance, bills additional virtual user hours and retains results 30 days.
- Enterprise is quoted per contract, scaling up to 1 million concurrent virtual users.
Last verified: September 2026.
Verdict: Teams that write JavaScript and want a performance gate that blocks a merge should pick k6. Protocol breadth and the single instance ceiling are the tradeoff, so pair it with the k6 Operator or Grafana Cloud k6 for large runs. The k6 testing tutorial walks through a first script.
3. Gatling: Best for High Throughput Per Load Generator
Gatling is a code-first load testing tool from Gatling Corp, with its core published under the Apache License 2.0 and simulations written in Java, Kotlin, Scala, JavaScript or TypeScript. The README contrasts its non-blocking, asynchronous architecture with the blocking IO and one-thread-per-user designs of legacy tools, and the workload models documentation treats open and closed models as a first-class testing concept.
The project splits along edition lines. Community Edition runs on a single machine and writes a static HTML report per run, and the FAQ states that distributed testing is not supported there. Gatling Enterprise Edition adds distributed load generation, hosted dashboards, trends across runs, and every named CI/CD and observability integration in the documentation.
Key features
- Local Throughput - The FAQ puts one local generator at 64,000 users per second when one user equals one request, limited by the operating system rather than Gatling.
- Five SDKs - Simulations are written in Java, Kotlin, Scala, JavaScript or TypeScript and run through Maven, Gradle or sbt plugins or npx gatling on Node.js v24 or later.
- Assertion Gates - Global, forAll and details scopes assert on responseTime, failedRequests and requestsPerSec, and if at least one assertion fails, the simulation fails.
- Static Report - Each Community run writes an HTML report with min, max, average, standard deviation and four configurable percentiles, defaulting to the 50th, 75th, 95th and 99th.
- Protocol Coverage - HTTP, WebSocket, Server-Sent Events, JMS, gRPC and MQTT are official, but gRPC and MQTT stop at 5 users and 5 minute tests on local runs.
Load model
Gatling separates open and closed workload models, which cannot be mixed in one injection profile. Open steps are nothingFor, atOnceUsers, rampUsers, constantUsersPerSec, rampUsersPerSec, stressPeakUsers and incrementUsersPerSec; closed steps are constantConcurrentUsers, rampConcurrentUsers and incrementConcurrentUsers. A scenario attaches them with injectOpen or injectClosed, which process steps sequentially. The docs warn against reasoning in concurrent users when the system under test cannot queue excess traffic, because rising response times then slow injection.
Integrations
Documented CI/CD pages cover Jenkins, GitHub Actions, GitLab CI/CD, Azure DevOps Pipelines and TeamCity, each describing Enterprise Edition runs. The gatling/enterprise-action@v1 GitHub Action fails the workflow on failed assertions by default. Observability exports reach Datadog, Dynatrace, New Relic, InfluxDB and OpenTelemetry on Enterprise only. The open-source distribution ships console and file data writers.
Pros and cons
| Pros | Cons |
|---|---|
| Open injection steps set a real arrival rate, which keeps results honest on public-facing systems; simulations live in the same repo and language as the service under test; assertions give each run a pass or fail outcome with no extra tooling. | Every documented CI/CD integration page describes Enterprise Edition runs, so Community users assemble pipeline steps from build tool commands; distributed testing across multiple load generators is not supported on Community Edition; trends across runs, run comparison and all five APM exports are Enterprise features, leaving the open-source path at one static HTML report per run. |
Pricing
- Community Edition is free.
- Enterprise Edition publishes three plans: Basic covers up to 60,000 VUs, 1 hour of testing, 1 load generator and 2 seats; Team covers up to 180,000 VUs, 5 hours of testing, 3 load generators and 10 seats; Enterprise is custom.
- Test runs consume 1 credit per load generator per minute.
Last verified: September 2026.
Verdict: Pick Gatling when engineers own the performance tests, write them in the same language as the service, and need a defensible arrival-rate model. Budget for Enterprise Edition if CI gating, distributed load or APM correlation matter.
4. Locust: Best for Python Teams
Locust is an open source load testing tool under the MIT licence, and the Locust documentation covers writing locustfiles, distributed runs and protocol extension. Scenarios are plain Python classes rather than XML or a proprietary DSL, and each simulated user runs inside its own gevent greenlet, so one process can handle many thousands of concurrent users.
Built-in protocol support stops at HTTP and HTTPS. Contrib user classes include MQTT, Socket.IO, PostgreSQL, MongoDB and the OpenAI SDK, and anything else needs a Python wrapper around a library gevent can monkey patch. Scale comes from running the tool yourself, with a master process coordinating workers and one worker instance recommended per processor core.
Key features
- Python Scenarios - Behaviour lives in @task methods on a User class, with on_start and on_stop hooks, integer task weights and @tag filtering through --tags and --exclude-tags.
- Live Web UI - The interface on port 8089 charts requests per second, response times and running users, and the user count can change mid-run.
- Distributed Mode - Flags --master and --worker split a run across machines, and --processes forks local workers, though that flag is experimental and unavailable on Windows.
- Faster Client - FastHttpUser swaps requests for geventhttpclient, reaching roughly 16,000 requests per second on one core against roughly 4,000 for HttpUser in a documented best case.
- Report Exports - Flags --html, --csv and --json write report artefacts, and the default percentile list runs from the 50th through the 99.99th and on to the 100th.
Load model
The wait_time functions between(), constant(), constant_pacing() and constant_throughput() pace each user, and the documentation states that wait time can only constrain throughput, not launch new users to reach a target. Its worked example pairs constant_throughput(0.1) with 5,000 users to aim at 500 task iterations per second.
That makes Locust a closed workload model. The -u/--users and -r/--spawn-rate flags set concurrency, and LoadTestShape stages scripted through tick() still move concurrency rather than arrival rate.
Integrations
A documented GitHub Actions workflow runs locust --headless --run-time 5m. Installing locust[otel] and passing --otel exports traces, metrics and logs over OTLP to Prometheus, Jaeger or Tempo, though only HttpUser generates spans without additional instrumentation. Containers use the official locustio/locust image, and the Locust Operator installs on Kubernetes by Helm.
Pros and cons
| Pros | Cons |
|---|---|
| Scenarios are ordinary Python, so existing skills, IDEs, debuggers and libraries carry over; the process exits with code 1 when any sample fails, and the docs supply a threshold snippet on fail_ratio, avg_response_time and the 95th percentile; distributed mode, an official Docker image and a Kubernetes operator are all maintained by the project. | There is no open workload model, so arrival rates are approximated by over-provisioning concurrency; only HTTP and HTTPS work out of the box, and C-level I/O in a wrapped library blocks the process and can limit a worker to one user; run-over-run trending is absent, so regression history needs an external sink such as an OTLP backend. |
Pricing
- Locust is open source under the MIT licence, with no plan tiers, no virtual user ceiling and no test duration limit.
- The locust.io site describes a hosted version still being worked on, with no published plan names or user caps.
- Azure Load Testing recommends up to 500 users per test engine for Locust-based tests.
Last verified: September 2026.
Verdict: Pick Locust when the team already writes Python and wants load scenarios in the same language and IDE as the application. Expect to run and size the load generators yourself, and to approximate any arrival-rate requirement. The Python Locust guide walks through a first test.
5. Artillery: Best for Node.js Teams and Playwright Load Tests
Artillery is an open source load testing toolkit distributed as an npm package under MPL-2.0, though some Azure-specific modules carry a separate Business Source Licence. Tests are written in YAML, JavaScript or TypeScript and run on a laptop or across serverless workers. HTTP, WebSocket, Socket.IO and the built-in Playwright engine ship in the box.
Load is expressed as an arrival rate rather than a pool of threads, and each arrival is a new virtual user. The Playwright engine records Web Vitals such as LCP, INP and CLS as browser.page metrics, so paint timings and backend response times land in one summary report. The ensure plugin returns a non-zero exit code when strict thresholds fail.
Key features
- Playwright Engine - Built in with no separate install, it runs Playwright test functions under load and records LCP, FCP, CLS, INP, TTFB and FID as browser.page metrics.
- Arrival Phases - Four documented phase kinds cover a constant arrivalRate, a linear rampTo ramp, a fixed arrivalCount and a pause, with maxVusers capping concurrency inside any phase.
- Ensure Thresholds - The ensure plugin accepts thresholds such as http.response_time.p99 and multi-metric conditional expressions, and Artillery exits with a non-zero code when a strict check fails.
- Serverless Workers - The run-lambda, run-fargate and run-aci commands spread a run across AWS Lambda, AWS Fargate or Azure Container Instances, creating and removing cloud resources automatically.
- Metrics Reporting - Histograms expose min, max, mean, median, p95, p99 and p999, and the publish-metrics plugin streams to fifteen documented destinations including OpenTelemetry, Datadog, Prometheus and Grafana.
Load model
Artillery drives load by arrivals rather than a fixed thread pool. It works through the config.phases array in order, using four phase kinds: a constant arrivalRate, a linear ramp pairing arrivalRate with rampTo, a fixed arrivalCount, and a pause. Each arrival is a new virtual user, maxVusers caps a phase, and Artillery does not wait for one phase's users to finish before starting the next.
Integrations
Documented CI/CD guides cover GitHub Actions, Azure DevOps, Jenkins, CircleCI and GitLab CI/CD, with the official artilleryio/action-cli action for GitHub. Results appear as live console output every 10 seconds, a JSON file via --output, or Artillery Cloud via --record and --key. A Slack plugin posts run notifications.
Pros and cons
| Pros | Cons |
|---|---|
| Load follows documented arrival phases rather than a thread count, with maxVusers as an optional concurrency cap; the ensure plugin returns a non-zero exit code on strict threshold failures, backed by six CI guides and an official GitHub Action; the built-in Playwright engine captures Web Vitals and backend latency in one run. | The self-contained HTML report command was removed from the CLI, so shareable dashboards depend on Artillery Cloud; distributed runs execute in the team's own AWS or Azure account, with Azure capped at 5 workers without a subscription; Playwright load is Chromium only, is documented at roughly 1 vCPU per concurrent virtual user, and is not supported on AWS Lambda. |
Pricing
- The CLI is open source under MPL-2.0.
- Artillery Cloud Free allows 30 reports per month, 5 workers per test and 30-minute tests; Team allows 1000 reports, 25 workers and 2-hour tests; Business sets no limit on workers or duration, with 2500 reports per month.
- No virtual user ceiling is published for any plan.
Last verified: September 2026.
Verdict: Artillery suits Node.js teams that want arrival-rate load testing, native CI gating and Playwright journeys measured under load. Teams needing managed load generators, enterprise protocols, or shared dashboards without a cloud subscription should weigh the gaps.
6. TestMu AI HyperExecute: Best for Running Existing JMeter and Gatling Plans
TestMu AI HyperExecute is a test orchestration cloud that also runs protocol-level load tests. It executes existing JMeter .jmx plans and Gatling-load-testing Java simulations on just-in-time machines, so there is no load-generator fleet to size or patch. Both engines run from the portal or from a hyperexecute.yaml through the HyperExecute CLI, although the JMeter docs page documents only the Projects dashboard path.
The JMeter dashboard sets Total Users, Ramp-up Time, Total Load Distribution, Split CSV and Machine count. Runs surface Summary Report, Timeline Report, Request Stats, Errors and Logs. The Summary tab shows average and 90th percentile response time, and the JMeter HTML dashboard produced by a run carries the 90th, 95th and 99th percentiles.
Key features
- Existing Plans - Uploaded .jmx files run as they are, and folder upload for JMeter projects carries CSV data files with the plan, removing most migration rewriting.
- Region Split - Total Load Distribution splits users by percentage across six documented regions, including East US as the default, Central India and Brazil South.
- Managed Generators - Load generators are managed and destroyed when a run ends, with per-license ceilings of 100, 2,000 and 8,000 concurrent virtual users on Free, Basic and Pro.
- CLI Runs - A signed binary takes --user, --key and --config, so JMeter, Gatling and k6 runs fit unattended pipelines across twelve documented CI tools.
- Property Overrides - Values defined with the JMeter __P() function can be overridden per run, covering thread count, ramp-up and duration, but ${var} User Defined Variables cannot.
Load model
The JMeter path is closed: HyperExecute supports the standard Thread Group, with concurrency set through Total Users and Ramp-up Time. Gatling is mixed. The sample simulation builds open steps through scenario.injectOpen() with constantUsersPerSec and rampUsersPerSec, and closed steps through scenario.injectClosed() with constantConcurrentUsers. Its getPopulationBuilder routes soaktest and capacitytest to injectClosed by default, although the portal labels Initial Users as an arrival rate.
Integrations
CI integration runs through the HyperExecute CLI, not per-tool plugins, and the CI/CD docs name twelve tools, including GitHub Actions, GitLab, Jenkins, Azure DevOps and CircleCI. Reports stay on the platform: Gatling uploads its HTML report through uploadArtefacts, artifacts download via --download-artifacts, and no APM correlation with Datadog, New Relic or Dynatrace is named.
Pros and cons
| Pros | Cons |
|---|---|
| Existing .jmx plans run without a rewrite, and folder upload carries CSV data files; load generators are managed and destroyed when a run ends, with per-license ceilings up to 8,000 concurrent virtual users on Pro and stackable licenses; one signed CLI drives JMeter, Gatling and k6 runs across twelve documented CI tools. | No built-in performance thresholds are published, and FailFast aborts on consecutive test failures, not latency or error rate; multi-region load generation is Enterprise only, leaving Free, Basic and Pro on a single region; without a Total Users override the .jmx user count replicates on every machine, so 250 users on three machines across two regions becomes 1,500. |
Pricing
- Performance Testing is metered per license in four plans.
- Free allows 100 max concurrent VUs, 100 VUH per month and a 40 minute max test duration.
- Basic allows 2,000 VUs and 2 hour tests, Pro allows 8,000 VUs and 6 hour tests, and Enterprise is customizable.
- Browser-based tests consume 10 VUH per virtual user.
Last verified: September 2026.
Verdict: Choose HyperExecute for managed JMeter and Gatling execution when teams already maintain those plans and want pipeline-driven runs. Look elsewhere if built-in regression thresholds matter more than reusing existing plans unchanged. This walkthrough of performance testing with HyperExecute shows the setup from a product view.

Note: Run the JMeter plans and Gatling simulations you already maintain on managed load generators, with no fleet to keep alive between tests. See performance tests at scale
7. BlazeMeter: Best for Hosted JMeter, Mocks And Test Data
BlazeMeter is Perforce's cloud performance testing platform. Its engines run on Taurus, so an uploaded JMeter .jmx file, Gatling simulation, k6 script, Locust file or Playwright test executes without rewriting. Protocol reach follows the script, and JMeter documents load testing over HTTP, FTP, JDBC, LDAP, JMS and mail protocols, while BlazeMeter publishes no protocol list of its own.
Two platform features sit beside the load generator. Service virtualization emulates web services to remove dependencies during testing, with transactions taken from an OpenAPI, Swagger, WSDL or HAR upload, recorded traffic or manual entry. Synthetic test data supplies values through Text, List, Date and Time and other functions bound into scripts as variables.
Key features
- Taurus Engines - BlazeMeter engines run on Taurus, which wraps JMeter, Gatling, k6, JUnit and Robot among others, so existing assets upload and run without translation.
- Failure Criteria - Thresholds compare a KPI against a fixed value or a stored baseline with a percentage offset, such as avg-rt>baseline+5%, and can stop the test as failed.
- Load Locations - The load distribution documentation lists 58 cloud locations across AWS, Google Cloud Platform and Microsoft Azure, and Dockerized private agents drive load from behind a firewall.
- Percentile Reporting - Reports show 90% line, 95% line and 99% line values alongside median, standard deviation, latency, error count and per-label bandwidth.
- Baseline Trends - Any report can be set as a baseline, and the Trend Charts tab plots later runs against it, while Request Stats can show change from baseline.
Load model
Load is defined by concurrency, not arrival rate. The web form sets Total Users, Ramp Up Time, Ramp Up Steps, Duration and a Limit RPS cap, and the Taurus YAML throughput setting applies an RPS shaper. BlazeMeter overrides a standard JMeter Thread Group but not an Ultimate or Concurrency Thread Group, and may override some non-default k6 executors, where constant-arrival-rate and ramping-arrival-rate live.
Integrations
Jenkins and TeamCity plugins call a /ci-status endpoint and map threshold violations onto build results, Azure DevOps marks a task Failed when failure criteria trigger, and Bamboo fails builds on violated thresholds. GitHub Actions uses the BlazeMeter Docker image. APM correlation covers AppDynamics, Dynatrace, New Relic and Datadog, with Datadog receiving test metrics.
Pros and cons
| Pros | Cons |
|---|---|
| Existing JMeter, Gatling, k6, Locust and Playwright assets run unchanged through Taurus, removing migration cost; failure criteria use a one-minute sliding window that evaluates every 10 seconds and can stop a run mid-flight; service virtualization and synthetic test data sit in the same platform, so dependency stubs and dynamic data need no separate tooling. | Load is concurrency-driven and Limit RPS only sets a maximum requests per second, so there is no documented open-model arrival-rate injection; published plan ceilings stop at 5,000 maximum virtual users on Pro with a limit of ten locations per test; engine sizing stays with the tester, who raises threads per engine against 75% CPU and 85% memory ceilings. |
Pricing
- Performance plans are Free Starter, Basic, Pro and Unleashed.
- Free Starter publishes 50 maximum virtual users and a 20 minute maximum test duration.
- Basic publishes 1,000 virtual users and a one hour maximum duration.
- Pro publishes 5,000 virtual users, 20 load generators and a five hour maximum duration.
- Unleashed lists every limit as customizable.
Last verified: September 2026.
Verdict: Choose BlazeMeter for hosted JMeter with service mocks when teams have an existing JMeter or Gatling library and want managed scale, test data and CI gating in one platform. Look elsewhere if the workload has to be modeled as an arrival rate rather than a user count.
8. Azure App Testing: Best for Apps Hosted on Azure
Azure App Testing is the current name for Azure Load Testing, Microsoft's fully managed load generation service. The Azure App Testing product page FAQ states existing resources keep working unchanged. It runs Apache JMeter and Locust scripts, or a URL-based test built from HTTP requests configured in the Azure portal, with no load generators to provision or patch.
Server-side correlation is both the differentiator and the constraint. Azure Monitor, including Application Insights and Container insights, feeds resource metrics from a published list of Azure resource types into the same dashboard as the client-side charts. Applications hosted on-premises or in other clouds can still be load tested, but only the client-side half of that picture appears.
Key features
- Managed Scale - Standard_D4d_v4 engines with four vCPUs and 16 GB of memory scale to 400 engine instances and 100,000 virtual users per test run.
- Fail Criteria - Up to 50 criteria per test compare response_time_ms, latency, error, requests_per_sec or requests against a threshold, across the whole test or one sampler.
- Auto Stop - A run halts when the error percentage passes a threshold during a time window, defaulting to 90 percent across any 60 second window.
- Azure Monitor Correlation - Server-side metrics from supported Azure resource types, including App Service, Cosmos DB, AKS and SQL Database, render beside client-side charts and accept fail criteria.
- Multi-Region Load - Up to five Azure regions generate load in one run, with a region comparison view, though load distribution is documented for public endpoints only.
Load model
Azure documents closed workload controls only. URL-based tests take a loadType of Linear, Step or Spike. JMeter tests inherit the .jmx thread group, with Microsoft recommending threads below 250 per script and total virtual users equal to threads multiplied by engine instances. Locust tests set total users and spawn rate, with up to 500 users per engine instance recommended. No arrival-rate executor or open injection profile is documented.
Integrations
CI triggers are the AzureLoadTest@1 Azure Pipelines task, the azure/load-testing@v1 GitHub Action, or az load test-run create in the Azure CLI. The Pipelines task succeeds only when the run finishes and every criterion passes. Results export as JMeter-format CSV and an HTML report, and Backend Listeners push to InfluxDB or Application Insights.
Pros and cons
| Pros | Cons |
|---|---|
| Existing .jmx and Locust scripts run unchanged, and full JMeter protocol support puts JDBC, message queue and TCP targets in scope; engine CPU, memory and network are charted, so generators can be ruled out as the bottleneck; a percentile threshold can gate a release through the Azure Pipelines task | Open workload modelling is undocumented, so pacing has to be approximated with in-script timers; server-side correlation covers only published Azure resource types, and server-side fail criteria cannot be configured from Azure Pipelines or GitHub Actions; the summary card surfaces only 90th percentile response time, and results files are not downloadable for runs above 45 engine instances or three hours |
Pricing
- Azure Load Testing is pay-as-you-go, metered in Virtual User Hours across two bands, 0 to 10,000 and 10,000 and above.
- From March 1st, 2026, each run has a minimum charge of 10 virtual users per engine for the run duration, or for 10 minutes if the run is shorter, and runs above that minimum bill on actual usage.
- No free Virtual User Hour allowance is published for load testing.
Last verified: September 2026.
Verdict: Teams running Azure-hosted applications who already own JMeter or Locust assets get managed scale, pipeline gating and server-side correlation in one service. Anyone needing arrival-rate injection or third-party APM correlation should look elsewhere.
9. OctoPerf: Best for Teams Standardizing on JMeter
OctoPerf wraps Apache JMeter in a web interface, a managed injection grid and a reporting engine. Scripts are built in a drag and drop action tree or imported as .jmx files. Samplers listed in the Apache JMeter component reference, such as JDBC Request or TCP Sampler, arrive as generic actions rather than native action types.
The platform runs as SaaS or fully on premise, with load generators that auto scale on AWS, DigitalOcean and Azure and Docker agents that test behind a firewall. Load is shaped around concurrent users rather than request rate, and rate control is reached only indirectly through pacing or a target hit rate per virtual user.
Key features
- JMX Round Trip - Imports .jmx projects and exports virtual users back to .jmx at any time, mapping samplers, controllers, extractors and timers to native actions.
- SLA Profiles - Thresholds carry a metric, a warning or critical severity, a From and To range and a During window, and attach to any HTTP request or container.
- Insights Engine - Sixteen named rules flag connect time drift, hit rate inflexion and error peaks, warning when a test ran under 50 virtual users or twenty minutes.
- Reporting Engine - Reports show percentile 90, 95 and 99 plus Apdex, with trend reports across up to 25 runs and comparisons over two to four results.
- MCP Server - A hosted Model Context Protocol endpoint exposes around 190 tools that let an AI agent run scenarios, read reports and migrate LoadRunner or NeoLoad projects.
Load model
OctoPerf uses a closed workload model. A load policy is a curve of inflexion points in concurrent users, with presets named Smooth, Sustained, Stress and Custom. The Policies tab offers Throughput, a target hit rate per virtual user, or Pacing, a minimum iteration duration. With Import Scenario enabled, Arrivals and FreeFormArrivals thread groups become concurrency curves via Little's Law at a fixed 1000ms response time.
Integrations
GitHub Actions, GitLab CI and Azure DevOps all drive tests through the Maven plugin, whose goals include octoperf:import-jmx and octoperf:execute-scenario and whose stopTestIfThreshold parameter accepts WARNING or CRITICAL. A Jenkins plugin adds an octoPerfTest pipeline step and pulls the JUnit report into the build.
Pros and cons
| Pros | Cons |
|---|---|
| Existing .jmx libraries run unchanged and virtual users export back to .jmx at any time, so adoption stays reversible; APM header injection for Dynatrace, AppDynamics and Instana supports correlation with server side data; the same product runs as SaaS or on premise, with Docker agents that test behind a firewall. | The workload model is closed only, and imported arrival based thread groups are flattened into concurrency; native protocol coverage is HTTP and HTTPS, with everything else imported as generic actions that cannot be created from scratch; real browser load is capped at 5 Playwright virtual users per load generator, against 1,000 for JMeter virtual users. |
Pricing
- Free caps tests at 50 concurrent virtual users, 20 minutes, 1 parallel run and 1 real browser virtual user.
- Unlimited Performance starts at 1,000 virtual users with unlimited duration and parallel runs.
- Pay-Per-Test also starts at 1,000 virtual users but allows one test of up to 1 hour.
Last verified: September 2026.
Verdict: Pick OctoPerf if a team already owns a .jmx library and wants a managed grid, an SLA gate and a reporting engine wrapped around it. Teams that need open model arrival rates should look elsewhere.
10. LoadView: Best for Real Browser Load Without Writing Code
LoadView is the load testing platform from Dotcom-Monitor, and tests run on managed cloud injectors. Web application tests drive real browser sessions rather than replaying raw HTTP, so rendering and client-side script execution land inside measured transaction time. JMeter test plans can be imported, but their JMeter Thread Group settings must be rebuilt as a LoadView scenario.
Documented targets include single web pages, HTTP/S, REST Web API, Postman collections, Selenium SIDE files, streaming media and WebSocket. Load comes from over 40 zones on AWS and Azure, and an on-premise add-on runs injectors inside the organization's own network. The platform suits teams that need browser-accurate numbers and have nobody writing injection code.
Key features
- EveryStep Recorder - Point and click recording turns a browser journey into a script, and the Script Code Editor allows C# edits with a Validate step.
- Three Load Curves - Load Step Curve ramps and holds user counts, Goal-Based Curve targets transactions per minute, and Dynamic Adjustable Curve moves load with a mid-test slider.
- Injector Density - Calibration puts 500 to 1,000 users on an HTTP injector against 8 to 25 on a browser-based one, and tests consume injectors.
- Threshold Gating - The Jenkins plugin takes an Error Threshold and an Average Time, and the Azure DevOps task takes a failed response rate and average response time.
- Report Comparison - Selected runs open in a comparison view overlaying charts from several tests, downloadable as an Excel summary or emailed as a PDF.
Load model
LoadView uses a closed workload model, with no arrival-rate executor published. The Load Step Curve builds concurrency from Start with, Raise by, Reach, Hold for and Lower by actions. The Goal-Based Curve recalculates concurrent users each cycle to hold a transactions per minute goal. The Dynamic Adjustable Curve moves Current Load toward Target Load via a runtime slider. User Behavior profiles set pacing between sessions.
Integrations
CI gating is documented for Jenkins through the LoadView-Run load test scenario post-build action, Azure DevOps through the LoadView-Testing pipeline task, and CircleCI through the dmtest2/dotcom2 orb. Web API access requires IP whitelisting. Dynatrace is the only documented APM link, filtering load traffic through an x-dynatrace request header and the DMBrowser User-Agent suffix.
Pros and cons
| Pros | Cons |
|---|---|
| Real browser execution on managed injectors across over 40 AWS and Azure zones, with no load generators to provision; three load curves, including a Goal-Based Curve that holds a transactions per minute goal; native thresholds on error rate and average response time that fail a Jenkins build or Azure DevOps step. | Custom C# added in the Script Code Editor goes to vendor technical support for approval before the script can be saved; Selenium support is SIDE file import only, and Selenium WebDriver integration is not supported; response time reporting stops at average duration and a single 90% Response Time value, with no p95 or p99. |
Pricing
- Plans are On-Demand, a Subscription in Starter, Professional and Advanced tiers, and Enterprise.
- Starter lists 1,000 concurrent HTTP users, 100 concurrent browsers and 30 load injector hours; Professional lists 10,000, 1,000 and 100; Advanced lists 30,000, 3,000 and 250.
- All three cap a single test at 4 hours.
- Signup includes up to 5 free tests.
Last verified: September 2026.
Verdict: Pick LoadView when load has to come from real browsers or streaming clients and nobody on the team writes injection code. Teams that own JMeter or Gatling assets, or gate on p95 and p99, will find it limiting.
11. OpenText Professional Performance Engineering: Best for Legacy and Packaged Application Protocols
OpenText Professional Performance Engineering, formerly LoadRunner Professional, is the on-premises edition of the LoadRunner family. Controller, VuGen and Analysis are installed on machines the team owns, and OpenText positions it for co-located teams running one test at a time. Controller also runs existing Apache JMeter, Gatling and Selenium assets.
Protocol coverage keeps the product on enterprise shortlists, reaching SAP GUI, Citrix ICA, RDP and RTE terminal emulation. Scripts are built in VuGen with TruClient browser recording and rule-based automatic correlation. Performance Engineering Aviator adds AI scripting assistance as a separate cloud service that VuGen connects to by subscription.
Key features
- Protocol Breadth - The product page claims 180+ protocols and technologies, and the Supported Protocols guide also covers Teradici PCoIP, Oracle NCA, Oracle 2-Tier and ODBC.
- Open-Source Execution - Controller runs JMeter .jmx, Gatling .scala and .jar, and Selenium .java scripts, but ignores Gatling inject and maxDuration schedule directives.
- SLA Gating - SLA rules cover Transaction Response Time by average, percentile and APDEX, plus Errors per Second, Total Throughput and Passed Transactions Ratio.
- Percentile Reporting - The Summary Report prints a configurable x Percent column, defaulting to the 90th, with pass, fail and stop counts per transaction.
- APM Correlation - Controller monitor categories include AppDynamics, Dynatrace, New Relic, Datadog and Prometheus, and SiteScope is bundled with the foundation SKU.
Load model
Controller builds closed-model scenarios in Real-world or Basic run mode from the schedule actions Start Group, Initialize, Start Vusers, Duration and Stop Vusers. Start Vusers releases a set number of Vusers every HH:MM:SS, which controls user arrival rather than request arrival. Goal-oriented scenarios chase Virtual Users, Pages per Minute, Hits per Second, Transactions per Second or Transaction Response Time targets. No open arrival-rate injector is documented.
Integrations
The Professional help center documents three CI systems: Jenkins, Azure DevOps and TeamCity. Jenkins and TeamCity pass or fail each scenario on its SLA, and the Azure DevOps plugin requires a self-hosted Windows agent with IIS. Other pipelines call CLIControllerApp.exe, and results export to InfluxDB for a downloadable Grafana dashboard.
Pros and cons
| Pros | Cons |
|---|---|
| Protocol coverage is the widest in this roundup, spanning SAP GUI, Citrix ICA and Oracle NCA, which HTTP-only tools cannot reach; SLA rules on average, percentile and APDEX drive build status through Jenkins, Azure DevOps, TeamCity or the CLI; Analysis adds HTTP status code breakdowns and Cross Result graphs for comparing multiple runs. | The team installs and maintains Controller and every load generator, including cloud generators in its own Amazon EC2 or Microsoft Azure account; the licence allows one Controller user at a time, located within the licensed Site; the closed workload model approaches throughput goals by adding Vuser batches roughly every two minutes rather than holding a fixed arrival rate. |
Pricing
- Professional is one of three editions, alongside OpenText Core Performance Engineering and OpenText Enterprise Performance Engineering.
- Licensing is by Virtual User quantity, as VU licences, VU+C products with unlimited Controller licences, or Virtual User Flex Days that permit unlimited runs within a 24 hour period.
- A community bundle covers development and proof-of-concept execution only.
Last verified: September 2026.
Verdict: Pick this when load has to reach SAP GUI, Citrix, terminal emulators or Oracle NCA and the team accepts running its own Controller and load generators. Teams testing only HTTP services will find lighter tools that scale without owned hardware.
12. Tricentis NeoLoad: Best for SAP and Enterprise Application Load Testing
Tricentis NeoLoad is a commercial load generation platform aimed at the enterprise application stack. Vendor documentation covers SAP GUI, Citrix, Oracle Forms and terminal emulation alongside HTTP, and one run can combine protocol traffic with RealBrowser measurement. Load runs on customer or NeoLoad cloud infrastructure, driven from a desktop Controller or NeoLoad Web.
Test assets exist in two interchangeable forms: a recorder and drag-and-drop designer that produce User Paths, and a documented YAML schema. Either form runs from NeoLoadCmd or the Python NeoLoad CLI, so pipelines need no separate script. It loses ground on workload modelling, where every documented load policy counts virtual users rather than arrival rate.
Key features
- Enterprise Protocols - SAP GUI with RFC and IDoc actions, Citrix, Oracle Forms, and RTE terminal testing covering TN3270, VT420 and TN5250 over SSH, Telnet or TLS.
- RealBrowser - Chromium, Firefox and WebKit user paths capture Largest Contentful Paint, Interaction to Next Paint and Cumulative Layout Shift in the same run as backend traffic.
- As-Code Projects - A documented YAML schema defines servers, variables, user paths, populations, scenarios and SLA profiles, and can override a recorded project per environment.
- SLA Thresholds - Named KPIs including avg-request-resp-time, perc-transaction-resp-time and error-rate accept warn and fail levels, evaluated per test or per interval, for pipeline gating.
- Percentile Reporting - The NeoLoad Web Values tab publishes Perc 50, Perc 90, Perc 95 and Perc 99 per transaction, and comparison dashboards cover four test results.
Load model
Every documented policy is a closed model controlling virtual user counts. Standard mode offers Constant, Ramp-up, Peaks and Custom, where Custom plots a virtual user curve or imports it from CSV, and Iteration mode repeats those shapes against an iteration count. The as-code equivalents are constant_load, rampup_load, peaks_load and custom_load. No arrival rate or requests-per-second executor is documented, so throughput targets rely on container pacing.
Integrations
Pipeline integrations include Jenkins, Azure DevOps, GitHub, GitLab and TeamCity, and the CLI emits JUnit XML through test-results junitsla and a JSON summary through test-results summary. APM correlation covers Datadog, Dynatrace, AppDynamics, New Relic and Prometheus. NeoLoad Web can execute uploaded JMeter projects, while Gatling connects only as a live result stream.
Pros and cons
| Pros | Cons |
|---|---|
| Protocol coverage spans SAP GUI, Citrix, Oracle Forms and TN3270 terminals plus JMS, MQTT and Kafka messaging; the same test exists as codeless design or YAML, and both run from the command line; SLA thresholds are machine-readable, and the CLI fastfail command can abort a run once violations pass a set percentage. | Load policies count virtual users rather than arrival rate, so throughput targets must be reverse engineered through pacing; Gatling simulations cannot be executed, and JMeter execution excludes Cloud Zones and multi-node runs; RealBrowser is documented at 5 to 10 virtual users per four-core generator and Citrix at 5 to 15, against 500 to 1,000 for simple HTTP. |
Pricing
- Prices are not published.
- The CLI documentation names FREE, Professional and Enterprise editions, and the FAQ lists Standard and Professional per-seat licences plus a Tricentis Edition shared licence.
- Licence server leases have minimums of 50 Web virtual users and one hour, Virtual User Hours exclude SAP GUI, and no concurrent virtual user ceiling is published.
Last verified: September 2026.
Verdict: Teams whose critical paths run through SAP, Citrix, Oracle Forms or mainframe terminals get coverage here that open-source tools cannot reach. Teams testing only HTTP APIs are buying protocol breadth they will never use.
13. Sitespeed.io: Best for Frontend Speed Regressions
Sitespeed.io is an MIT licensed web performance tool developed in the open since 2012. Its Browsertime engine drives real browsers, including Chrome, Firefox, Edge and Safari, and reports what a single visitor experienced. The metrics it collects cover Largest Contentful Paint, Cumulative Layout Shift, Total Blocking Time and Speed Index, alongside a HAR waterfall and a recorded video of the load.
It measures one synthetic user at a time, so it places no meaningful load on the server under test. That makes it a companion to a load generator. Teams running JMeter or k6 for server load add Sitespeed.io for the browser half, using a budget file to block render regressions in a pipeline.
Key features
- Real Browsers - Browsertime drives Chrome, Firefox, Edge and Safari on desktop, plus Chrome and Firefox on Android and Safari on iOS over USB, recording video each run.
- Performance Budget - A JSON budget file covering timings, googleWebVitals, requests, transferSize and thirdParty makes the run exit with a status above zero when any limit is breached.
- JUnit Output - The --budget.output flag writes junit.xml, budget.tap or budgetResult.json, which Jenkins reads through its Publish JUnit test result report post-build action.
- Statistical Compare - The compare plugin runs Mann Whitney U and Wilcoxon tests against a saved baseline to flag regressions that a median alone would hide.
- Connectivity Throttling - Profiles such as 4g, 3g, 2g, cable and custom run through the throttle engine, which uses tc on Linux and pfctl on Mac.
Load model
Sitespeed.io never generates concurrent load, and its configuration reference has no executors, thread groups, arrival-rate phases or injection steps. The only repetition control is -n, also written --browsertime.iterations, which loads the same page in sequence and defaults to 3. The --multi flag walks several URLs in one browser session, and the crawler options -d for depth and -m for maxPages widen page coverage rather than concurrency.
Integrations
Worked Docker examples cover GitHub Actions, Jenkins and Circle CI, while GitLab CI links out to GitLab's own docs. Metrics ship to Graphite or InfluxDB, with Grafana as the dashboard and alerting layer, though InfluxDB has no pre-made dashboards. Results can go to S3 or Google Cloud Storage. No APM vendor integration is documented.
Pros and cons
| Pros | Cons |
|---|---|
| Real browser measurement across Chrome, Firefox, Edge and Safari plus genuine Android and iOS hardware; a budget file returning a non-zero exit status and JUnit XML, TAP or JSON output makes pipeline gating straightforward; MIT licensed with no account, no seat limits and full ownership of result data. | Generates no server load, so it answers nothing about capacity and must be paired with a load generator; the full metric set depends on a self-managed stack of FFmpeg, Python, scipy, Graphite or InfluxDB and Grafana; browser coverage is uneven, since macOS Safari does not support HAR, Edge is experimental and Cumulative Layout Shift is Chrome-only. |
Pricing
- Open source under the MIT licence, with no paid tier, no plan names and no published usage caps.
- There is no vendor hosted service; the optional OnlineTest frontend is deployed by teams themselves and licensed AGPL-3.0.
- The practical ceiling is the team's own hardware plus Graphite or InfluxDB storage.
Last verified: September 2026.
Verdict: Pick Sitespeed.io to catch rendering regressions on real browsers and gate them in CI. It measures no server capacity, so treat it as the frontend half of a testing stack that still needs a load generator. The web performance testing guide explains which frontend metrics to budget.
Which Performance Testing Tools Simulate Realistic User Traffic?
Performance testing tools that support an open workload model simulate public web traffic most closely, because new virtual users keep arriving at a set rate even while the application slows down. Grafana k6 arrival-rate executors, Gatling open injection steps, Artillery arrival phases, and the experimental JMeter Open Model Thread Group all start load on a rate schedule.
A closed model runs a fixed number of virtual users instead, and each one waits for a response before starting its next iteration. The Gatling workload models guide matches closed models to systems that cap concurrent users, such as a call center or a ticketing site with a queue, and open models to most websites, where users keep arriving even when the application has trouble serving them.
| Tool | Open model (arrival rate) | Closed model (concurrent users) |
|---|---|---|
| Grafana k6 | constant-arrival-rate and ramping-arrival-rate executors | constant-vus executor |
| Gatling | constantUsersPerSec, rampUsersPerSec, and atOnceUsers injection steps | constantConcurrentUsers and rampConcurrentUsers; one injection profile cannot mix both models |
| Apache JMeter | Open Model Thread Group (experimental), with schedules such as rate(10/sec) random_arrivals(1 min) | Standard Thread Group; the Precise Throughput Timer paces threads but does not generate new ones |
| Locust | No arrival-rate mode; wait_time can only constrain throughput, not launch new users | Users with wait_time functions such as between, constant, and constant_throughput |
Coordinated Omission and Virtual User Hours
- Coordinated omission - a measurement bias in closed-model tests. Each virtual user waits for a response before sending its next request, so a slowing system receives fewer requests, the slow period is under-sampled, and high percentiles understate real latency. Gil Tene's wrk2 documentation describes the effect, and arrival-rate executors avoid it.
- Virtual user hours (VUH) - the billing unit that Grafana Cloud k6, Azure App Testing, and HyperExecute meter: virtual users multiplied by test duration in hours, so 100 virtual users for 30 minutes is 50 VUH as a baseline. Vendors adjust it. Grafana Cloud k6 billing charges browser virtual users at 10 times the standard rate, and Azure App Testing pricing sets a per-run minimum of 10 virtual users per engine for at least 10 minutes.
Open vs Closed Model: A k6 Test Run
The k6 open and closed models documentation explains that a closed-model test waits when responses slow down, so fewer new iterations start and the arrival rate tapers off.
To measure how much of a slowdown that waiting hides, the same k6 script ran twice against a local Node.js test server with a built-in slowdown:
- Test server - answers every request in 50 ms, except from second 20 to second 40 after the test starts, when each response takes 1 second.
- Run 1, closed model - the constant-vus executor with 5 virtual users for 60 seconds.
- Run 2, open model - the constant-arrival-rate executor at 100 iterations per second for 60 seconds, with up to 150 virtual users.
- Environment - k6 v2.2.0 on Windows, run on September 15, 2026, with the test server and k6 on the same machine.
// server.mjs: 50 ms responses, 1,000 ms responses from second 20 to 40 after /reset
import http from 'node:http';

let t0 = Date.now();
http.createServer((req, res) => {
  if (req.url === '/reset') {
    t0 = Date.now();
    res.end('reset');
    return;
  }
  const elapsed = (Date.now() - t0) / 1000;
  const delay = elapsed >= 20 && elapsed < 40 ? 1000 : 50;
  setTimeout(() => res.end('ok'), delay);
}).listen(3456, '127.0.0.1', () => console.log('listening on 127.0.0.1:3456'));
// closed.js (Run 1)
import http from 'k6/http';
export const options = {
scenarios: {
closed_model: {
executor: 'constant-vus',
vus: 5,
duration: '60s',
},
},
summaryTrendStats: ['avg', 'med', 'p(95)', 'p(99)', 'max'],
};
export function setup() {
http.get('http://127.0.0.1:3456/reset');
}
export default function () {
http.get('http://127.0.0.1:3456/');
}
// open.js (Run 2) is identical except for the scenario:
// open_model: {
// executor: 'constant-arrival-rate',
// rate: 100,
// timeUnit: '1s',
// duration: '60s',
// preAllocatedVUs: 20,
// maxVUs: 150,
// },Running k6 run --no-color -q closed.js and then k6 run --no-color -q open.js printed these end-of-test summaries, copied from the console without edits. Run 1, closed model:
  █ TOTAL RESULTS

    HTTP
    http_req_duration..............: avg=85.47ms med=60.77ms p(95)=67.07ms p(99)=1s max=1.01s
      { expected_response:true }...: avg=85.47ms med=60.77ms p(95)=67.07ms p(99)=1s max=1.01s
    http_req_failed................: 0.00%  0 out of 3510
    http_reqs......................: 3510   58.45147/s

    EXECUTION
    iteration_duration.............: avg=85.54ms med=60.77ms p(95)=67.11ms p(99)=1s max=1.01s
    iterations.....................: 3509   58.434817/s
    vus............................: 5      min=5         max=5
    vus_max........................: 5      min=5         max=5

    NETWORK
    data_received..................: 435 kB 7.2 kB/s
    data_sent......................: 246 kB 4.1 kB/s
Run 2, open model:
  █ TOTAL RESULTS

    HTTP
    http_req_duration..............: avg=359.14ms med=50.76ms p(95)=1s p(99)=1s max=1.01s
      { expected_response:true }...: avg=359.14ms med=50.76ms p(95)=1s p(99)=1s max=1.01s
    http_req_failed................: 0.00%  0 out of 5920
    http_reqs......................: 5920   98.577355/s

    EXECUTION
    dropped_iterations.............: 82     1.36543/s
    iteration_duration.............: avg=359.25ms med=50.8ms  p(95)=1s p(99)=1s max=1.01s
    iterations.....................: 5919   98.560704/s
    vus............................: 5      min=5         max=101
    vus_max........................: 102    min=20        max=102

    NETWORK
    data_received..................: 734 kB 12 kB/s
    data_sent......................: 414 kB 6.9 kB/s
The two end-of-test summaries, compared metric by metric:
| Metric | Closed model (constant-vus) | Open model (constant-arrival-rate) | Key takeaway |
|---|---|---|---|
| p95 response time | 67.07 ms | 1 s | The open model reveals the slowdown; the closed model hides it |
| p99 response time | 1 s | 1 s | The slowdown only surfaces at p99 in the closed model |
| Requests sent | 3,510 at 58.45/s | 5,920 at 98.58/s | The closed model sent 41% fewer requests over the 60-second run |
| Max active virtual users | 5 | 101 | The open model scaled up to hold the arrival rate |
| Dropped iterations | N/A | 82 | The open model reports load it could not start |
- Where the slowdown showed - in the closed-model run, the 1-second responses surfaced only at p99, because its 5 virtual users sent few requests while they waited.
- Virtual users - the open model scaled from 5 to 101 active virtual users during the slowdown, and k6 still counted 82 dropped iterations, which the k6 metrics reference defines as iterations not started due to lack of VUs.
- What to change - for public websites and APIs, drive load as an arrival rate taken from production traffic, and set thresholds on p99 as well as p95, since the closed run's slowdown surfaced only at p99.
Test Data and Full Scores
Two tools that both advertise an open workload model, Grafana k6 and Artillery, were pointed at the same target at the same arrival rate to see whether they report the same slowdown the same way. The target is a small Node.js server that answers every request in 50 ms, except between second 20 and second 40 of the run, when each response takes 1 second.
// server.mjs: 50 ms responses, 1,000 ms responses from second 20 to 40 after /reset
import http from 'node:http';

let t0 = Date.now();
http.createServer((req, res) => {
  if (req.url === '/reset') {
    t0 = Date.now();
    res.end('reset');
    return;
  }
  const elapsed = (Date.now() - t0) / 1000;
  const delay = elapsed >= 20 && elapsed < 40 ? 1000 : 50;
  setTimeout(() => res.end('ok'), delay);
}).listen(3456, '127.0.0.1', () => console.log('listening on 127.0.0.1:3456'));
Both runs use the same profile: 100 arrivals per second for 60 seconds, each arrival making one GET request, with the clock reset immediately before the run starts.
// k6-open100.js
import http from 'k6/http';

export const options = {
  scenarios: {
    open_model: {
      executor: 'constant-arrival-rate',
      rate: 100,
      timeUnit: '1s',
      duration: '60s',
      preAllocatedVUs: 20,
      maxVUs: 150,
    },
  },
  summaryTrendStats: ['avg', 'med', 'p(95)', 'p(99)', 'max'],
};

export function setup() {
  http.get('http://127.0.0.1:3456/reset');
}

export default function () {
  http.get('http://127.0.0.1:3456/');
}
# artillery-open100.yml
config:
target: "http://127.0.0.1:3456"
phases:
- duration: 60
arrivalRate: 100
name: "Open model: 100 arrivals per second"
http:
pool: 200
before:
flow:
- get:
url: "/reset"
scenarios:
- name: "Single GET against the slowdown server"
flow:
- get:
url: "/"Running k6 run --no-color -q k6-open100.js printed this end-of-test summary, copied from the console without edits:
  █ TOTAL RESULTS

    HTTP
    http_req_duration..............: avg=358.38ms med=50.54ms p(95)=1s p(99)=1s max=1.01s
      { expected_response:true }...: avg=358.38ms med=50.54ms p(95)=1s p(99)=1s max=1.01s
    http_req_failed................: 0.00%  0 out of 5920
    http_reqs......................: 5920   98.578749/s

    EXECUTION
    dropped_iterations.............: 82     1.365449/s
    iteration_duration.............: avg=358.55ms med=50.59ms p(95)=1s p(99)=1s max=1.01s
    iterations.....................: 5919   98.562098/s
    vus............................: 6      min=5         max=101
    vus_max........................: 102    min=20        max=102

    NETWORK
    data_received..................: 734 kB 12 kB/s
    data_sent......................: 414 kB 6.9 kB/s
Running npx artillery@2.0.34 run artillery-open100.yml against the same server printed this:
Summary report @ 12:55:31(+0530)
--------------------------------

http.codes.200: ................................................................ 6000
http.downloaded_bytes: ......................................................... 12000
http.request_rate: ............................................................. 100/sec
http.requests: ................................................................. 6000
http.response_time:
  min: ......................................................................... 38
  max: ......................................................................... 1019
  mean: ........................................................................ 369.4
  median: ...................................................................... 55.2
  p95: ......................................................................... 1002.4
  p99: ......................................................................... 1002.4
http.response_time.2xx:
  min: ......................................................................... 38
  max: ......................................................................... 1019
  mean: ........................................................................ 369.4
  median: ...................................................................... 55.2
  p95: ......................................................................... 1002.4
  p99: ......................................................................... 1002.4
http.responses: ................................................................ 6000
vusers.completed: .............................................................. 6000
vusers.created: ................................................................ 6000
vusers.created_by_name.Single GET against the slowdown server: ................. 6000
vusers.failed: ................................................................. 0
vusers.session_length:
  min: ......................................................................... 50.4
  max: ......................................................................... 1020.2
  mean: ........................................................................ 370.8
  median: ...................................................................... 56.3
  p95: ......................................................................... 1002.4
  p99: ......................................................................... 1002.4
Side by side, against the identical 20-second slowdown:
| What the run reported | Grafana k6 | Artillery |
|---|---|---|
| Requests completed | 5,920 | 6,000 |
| Mean response time | 358.38 ms | 369.4 ms |
| Median response time | 50.54 ms | 55.2 ms |
| 95th percentile | 1 s | 1,002.4 ms |
| 99th percentile | 1 s | 1,002.4 ms |
| Slowest response | 1.01 s | 1,019 ms |
| Failed requests | 0 | 0 |
| Arrivals it could not start | 82 dropped iterations | no equivalent metric in the summary |
- The measurements agree - two independently written tools put the mean at 358.38 ms and 369.4 ms and the 95th percentile at 1 s and 1,002.4 ms, a gap of about 3 percent on the same slowdown.
- The bookkeeping does not - k6 completed 5,920 of the 6,000 scheduled arrivals and reported the shortfall as 82 dropped iterations, because its virtual user pool had scaled to 101 against a 150 ceiling and ran out of spare users while responses were slow.
- Artillery started all 6,000 - it does not cap virtual users the way a k6 arrival-rate executor does, so nothing was dropped, and its summary carries no counter that would have reported a shortfall if one had happened.
- Why that matters - a dropped arrival is load your application never received, so a percentile calculated without it flatters the result; read the arrival-shortfall counter next to the percentiles, and raise maxVUs until it reaches zero before trusting the numbers.
- Environment - k6 v2.2.0 and Artillery 2.0.34 on Windows, run on September 16, 2026, with the test server and both load generators on the same machine.
The Same Kind of Plan on Managed Infrastructure
Both runs above needed a load generator on the machine doing the testing. The third run did not. Java is not installed on the machine used for this article, so an Apache JMeter plan was pushed to TestMu AI HyperExecute from the command line instead, and the plan ran on a provisioned Linux machine that installed JMeter, executed the test, and uploaded the results. The plan searches the Ecommerce Playground demo store with 5 threads for 30 seconds, with a 2 second think time between requests.
version: 0.1
runson: linux
concurrency: 1
autosplit: true
retryOnFailure: false
shell: bash

pre:
  - java -version
  - curl -sL -o jmeter.tgz https://dlcdn.apache.org/jmeter/binaries/apache-jmeter-5.6.3.tgz || curl -sL -o jmeter.tgz https://archive.apache.org/dist/jmeter/binaries/apache-jmeter-5.6.3.tgz
  - tar -xzf jmeter.tgz
  - mkdir -p results

testDiscovery:
  type: raw
  mode: static
  command: ls plans/*.jmx

testRunnerCommand: apache-jmeter-5.6.3/bin/jmeter -n -t $test -l results/result.jtl -j results/jmeter.log -e -o results/html

post:
  - echo "===== JMETER SUMMARY LINES ====="
  - grep -E "summary (+|=)" results/jmeter.log | tail -8
  - echo "===== STATISTICS JSON ====="
  - cat results/html/statistics.json

uploadArtefacts:
  - name: jmeter-results
    path:
      - results/**
JMeter's own end-of-run summary line, read back from the job's downloaded log, was:
summary = 61 in 00:00:30 = 2.0/s Avg: 242 Min: 200 Max: 990 Err: 0 (0.00%)The same run also produced a JMeter HTML dashboard, whose statistics file carries the percentile breakdown:
{
  "Search iphone" : {
    "transaction" : "Search iphone",
    "sampleCount" : 61,
    "errorCount" : 0,
    "errorPct" : 0.0,
    "meanResTime" : 242.7377049180328,
    "medianResTime" : 225.0,
    "minResTime" : 200.0,
    "maxResTime" : 990.0,
    "pct1ResTime" : 267.20000000000005,
    "pct2ResTime" : 271.7,
    "pct3ResTime" : 990.0,
    "throughput" : 2.1686575654152445,
    "receivedKBytesPerSec" : 299.26314804198665,
    "sentKBytesPerSec" : 0.3833271673243743
  },
  "Total" : {
    "transaction" : "Total",
    "sampleCount" : 61,
    "errorCount" : 0,
    "errorPct" : 0.0,
    "meanResTime" : 242.7377049180328,
    "medianResTime" : 225.0,
    "minResTime" : 200.0,
    "maxResTime" : 990.0,
    "pct1ResTime" : 267.20000000000005,
    "pct2ResTime" : 271.7,
    "pct3ResTime" : 990.0,
    "throughput" : 2.1686575654152445,
    "receivedKBytesPerSec" : 299.26314804198665,
    "sentKBytesPerSec" : 0.3833271673243743
  }
}- What the run returned - 61 samples, 0 errors, a mean response time of 242.74 ms, a median of 225 ms, and a throughput of 2.17 requests per second.
- The percentiles - 267.2 ms at the 90th, 271.7 ms at the 95th, and 990 ms at the 99th, where pct1ResTime, pct2ResTime, and pct3ResTime are JMeter's 90th, 95th, and 99th percentile fields.
- The 99th percentile is one request - the results file shows the slowest sample, at 990 ms, was the very first request of the run, and 746 ms of that was connection setup; across only 61 samples a single cold connection lands on the 99th percentile, which is why short runs overstate the tail.
- Percentiles are in the artifact, not the summary tiles - the platform's Summary tab reports average and 90th percentile response time, while the JMeter HTML dashboard produced by the same job carries the 90th, 95th, and 99th, so download the report artifact when you need the full tail.
- What it cost in time - the job finished in 49 seconds end to end, 35 seconds of which was test execution, with no load generator installed locally.
The Scores
Sorted by total out of 30. The numbered sections above group tools by how you run them, so this table is the like-for-like assessment. Each score comes from the vendor's own documentation, checked in a separate verification pass that lowered any score its evidence did not support.
| Tool | Protocols | Load model | Scripting | CI gating | Reporting | Managed scale | Total |
|---|---|---|---|---|---|---|---|
| Azure App Testing | 5 | 3 | 5 | 5 | 4 | 5 | 27 |
| Grafana k6 | 3 | 5 | 4 | 5 | 5 | 4 | 26 |
| Gatling | 4 | 5 | 5 | 4 | 4 | 4 | 26 |
| BlazeMeter | 4 | 3 | 5 | 5 | 5 | 4 | 26 |
| Tricentis NeoLoad | 5 | 3 | 3 | 5 | 5 | 4 | 25 |
| Artillery | 3 | 5 | 4 | 5 | 4 | 3 | 24 |
| OctoPerf | 3 | 3 | 5 | 4 | 5 | 4 | 24 |
| Apache JMeter | 5 | 4 | 4 | 3 | 4 | 2 | 22 |
| OpenText PPE (LoadRunner) | 5 | 3 | 3 | 4 | 5 | 2 | 22 |
| Locust | 3 | 3 | 5 | 4 | 4 | 2 | 21 |
| TestMu AI HyperExecute | 4 | 3 | 4 | 3 | 3 | 4 | 21 |
| LoadView | 4 | 3 | 2 | 4 | 3 | 5 | 21 |
| Sitespeed.io | 0 | 0 | 4 | 5 | 4 | 1 | 14 |
- Azure App Testing leads - it scored 27 by pairing unchanged JMeter and Locust scripts with pipeline tasks that fail on test criteria and a published ceiling of 100,000 virtual users per run, and it lost points only on load model and reporting.
- Three tools tie at 26 - Grafana k6 and Gatling earn full load model scores, as Artillery does, for their documented arrival-rate executors and open injection steps, while BlazeMeter earns full marks on scripting reuse, CI gating, and reporting.
- TestMu AI HyperExecute scored 21 - managed load generators and unchanged .jmx plans score well, but it loses points because no performance pass or fail thresholds are published, the JMeter path uses the standard Thread Group, and the Summary tab shows only average and 90th percentile response time.
- Sitespeed.io scored 14 by design - it generates no server load, so protocols and load model score 0, yet it still earns 5 for CI gating through performance budgets and belongs in a stack next to a load generator.
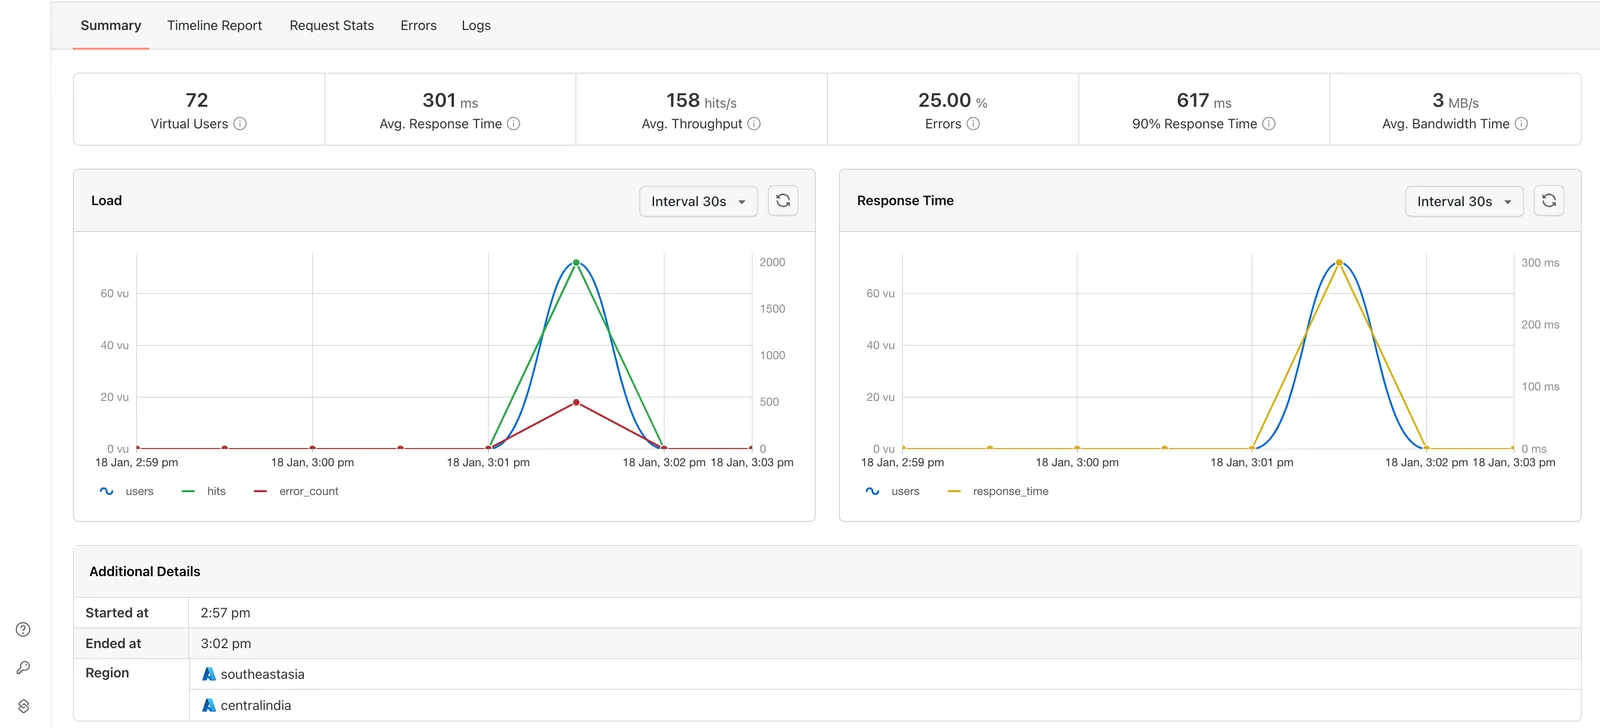

Free and Open Source Performance Testing Tools
An open source licence makes the load generator free, never the machines it runs on. The layer you eventually pay for differs by tool.
| Tool | Licence | What free covers | Where you start paying |
|---|---|---|---|
| Apache JMeter | Apache-2.0 | The full tool, every sampler, distributed mode, and the HTML dashboard | Never for the software; you pay for the machines that generate load |
| Grafana k6 | AGPL-3.0 | The CLI, all executors, thresholds, and the browser module | Grafana Cloud k6, whose free tier caps virtual user hours, for managed multi-region load |
| Gatling | Apache-2.0 (core) | The SDKs, open and closed injection, and the static HTML report on one machine | Gatling Enterprise for distributed load, native CI integrations, run trends, and APM exports |
| Locust | MIT | Python scenarios, the web UI, and master and worker distribution | No paid tier of its own; Azure App Testing is the documented managed option |
| Artillery | MPL-2.0 | The CLI, HTTP, WebSocket, and Playwright engines, and the ensure plugin | Artillery Cloud for shared reports, whose free plan caps monthly reports |
| Sitespeed.io | MIT | Browser measurement, performance budgets, and Graphite or InfluxDB output | Never for the software; it measures one synthetic user and needs no load fleet |
| Taurus | Apache-2.0 | One YAML format that drives JMeter, Gatling, Locust, k6, and more | Cloud execution, which delegates to BlazeMeter |
A workable free-first stack is k6 or Gatling for server load gated in CI, plus Sitespeed.io for frontend budgets. The paid gap that remains is sustained load beyond one machine, which is where a managed platform or a self-hosted distributed setup comes in.
Six Other Performance Testing Tools Considered
These six were checked against their vendors' live pages but left out of the scored list, mostly because they wrap another tool, target a narrow job, or publish too little to score fairly.
- Taurus - an Apache-2.0 wrapper that runs JMeter, Gatling, Locust, k6, and other executors from one YAML file. Left out because it generates no load itself and its cloud execution delegates to BlazeMeter.
- LoadNinja - SmartBear's cloud platform where each virtual user replays actions in a real browser, built with the InstaPlay Recorder. Left out because its product documentation was last updated in August 2024.
- Loader.io - a free SendGrid service for quick burst tests after you verify ownership of the target host. Left out because every test runs from one US-East datacenter with short test durations.
- WebLOAD - RadView's JavaScript and Java load tool with an automatic correlation engine, available as SaaS or self-hosted. Left out because it overlaps the enterprise suites above without a distinct load model or reporting advantage.
- IBM DevOps Test Performance - the renamed Rational Performance Tester, with record and playback for HTTP, SAP, Siebel, and Citrix. Left out because trials exist only at the DevOps Test suite level, not for the product alone.
- Appvance AIQ - a unified AI testing platform that redeploys functional scripts as load and soak tests. Left out because there is no free trial, only a paid Test Drive credited toward a licence.
Why Do Teams Need Performance Testing Tools?
Some defects only exist under concurrency. A functional test sends one request at a time, so it cannot see a failure that needs hundreds of simultaneous users to trigger. These are the ones a load test catches:
- Exhausted connection pools - requests queue for a free database connection, so latency climbs sharply once concurrency passes the pool size, even though every query is fast on its own.
- Queries that scale badly - a page that issues one query per item looks fine for one user and saturates the database when many users load it at once.
- Slow autoscaling - new instances take time to start, so a sudden spike can fail requests before capacity arrives, which only a spike test reveals.
- Memory growth - a small leak per request is invisible in a short test and exhausts memory after hours of steady load, which only a soak test reveals.
- Third-party rate limits - a payment, search, or maps API that throttles at volume turns into your outage when traffic peaks.
How Virtual Users Multiply Across Load Generators
In Apache JMeter distributed mode, a thread count multiplies across servers: the JMeter remote testing documentation states that each server runs the full test plan, so setting 1000 threads with 6 JMeter servers injects 6000 threads.
Managed platforms can behave the same way by default. The HyperExecute JMeter documentation walks through a 250-user .jmx plan run across 2 regions with 3 machines each: without overrides, every machine runs all 250 users, for 1500 users overall. Setting Total Users and the region split in the run form makes the platform divide the load instead.
- Decide the total first - take the target concurrent users and requests per second from production analytics, then divide by the number of generators, never the other way round.
- Size the thread group per server - in JMeter distributed mode, set each thread group to the target divided by the number of servers.
- Watch generator health - the HyperExecute JMeter documentation traces a job that errors out well before the target user count to load generator resource exhaustion and points to the Task Metrics CPU and memory graph, so rule out the generators before blaming the application.
- Split test data - give each generator its own rows of CSV data so parallel users do not replay the same accounts and hit cache-warm paths.
Note: Running JMeter plans on TestMu AI HyperExecute? Set Total Users and the region split in the run form so HyperExecute divides the load across machines, then check the virtual user count in the Summary report. Start testing on TestMu AI
What Is the Difference Between Web App and Mobile App Performance Testing Tools?
Web tools generate traffic against servers and measure browser rendering, while mobile tools measure what the app does to the device. Most mobile apps need both: a protocol tool such as JMeter or k6 to load the backend APIs, and on-device profiling to catch slow startup, dropped frames, and memory growth.
| Aspect | Web App Performance Testing Tools | Mobile App Performance Testing Tools |
|---|---|---|
| What is measured | Server response time, throughput, error rate, and browser metrics such as LCP | CPU, memory, frame rate, battery, and app startup time on the device |
| How load is created | Virtual users at the protocol level (JMeter, k6) or in real browsers (LoadView, NeoLoad RealBrowser) | Backend APIs are loaded with protocol tools while the app itself runs on a set of real devices |
| Network conditions | Latency and bandwidth throttling in the load profile or the browser | Cellular network profiles and fluctuating connectivity on the device |
| Environment spread | Browser and operating system combinations | Device models, OS versions, and hardware tiers |
| Example tools | Apache JMeter, Grafana k6, Gatling, Sitespeed.io | Android Studio Profiler, Xcode Instruments, Firebase Performance Monitoring |
For on-device metrics across many phones, TestMu AI's real device cloud captures CPU, memory, disk, frame rate, and network data for Appium tests on iOS and Android when you add the appProfiling capability, and Android runs also record app-not-responding events and cold and hot startup time. The mobile performance testing guide covers which of these metrics to track.

How Do You Choose a Performance Testing Tool?
Start from the constraint you cannot change: the protocol you must load, the language your team already writes, and who runs the load generators. The table maps common team situations to a starting tool.
| Your situation | Start with | Why |
|---|---|---|
| Existing JMeter plans and no appetite for maintaining generators | Azure App Testing, BlazeMeter, or TestMu AI HyperExecute | They run existing .jmx plans on load generators they provision for you |
| Developers own performance and ship through CI | Grafana k6 or Artillery | Thresholds and ensure checks exit non-zero, so a slow build fails like a broken test |
| A public website or API where users arrive regardless of response time | Grafana k6 or Gatling | Arrival-rate executors and open injection steps keep the request rate steady during a slowdown |
| Your team writes Python | Locust | User behavior is plain Python, and Azure App Testing can host it |
| A JVM stack that needs many users per generator | Gatling | Virtual users are lightweight messages rather than threads |
| SAP, Citrix, Oracle Forms, or mainframe | Tricentis NeoLoad or OpenText PPE | Both document enterprise and legacy protocols that open-source tools do not cover |
| The application runs on Azure | Azure App Testing | Azure Monitor server metrics sit next to client-side load results |
| Nobody on the team writes scripts | LoadView | A point-and-click recorder builds browser and HTTP load tests |
| Frontend speed matters more than server load | Sitespeed.io | Core Web Vitals and performance budgets per release |
Network reach overrides the table. If the application is not reachable from the public internet, a hosted cloud needs a private or on-premise load generator, so check that option before comparing features.

Conclusion
Shortlist two tools from the scores table that fit your team's language, then run the same short arrival-rate test in both against a staging copy of your most important user flow. Compare the percentiles, and check whether either tool reports arrivals it could not start, because a report that hides dropped load can make a slow build look fast.
If you already maintain JMeter or Gatling plans, push one to TestMu AI's cloud performance testing platform and set Total Users and the region split before the first run so the load divides across machines instead of multiplying. For Gatling simulations, the Gatling on HyperExecute guide covers users, duration, and regions for a first managed run.
Author

Garvit Sukhija
Blogs: 5

Garvit Sukhija is a Technical Product Manager at TestMu AI (formerly LambdaTest), where he leads the HyperExecute GUI, having spearheaded its development and pilot rollout to early adopters by integrating user insights and metric analysis into the go-to-market strategy. Before TestMu AI he owned the zero-to-one build of an enterprise SaaS platform for Earth Observation at Pixxel, where he designed billing, subscription, and IAM systems and led AI/ML model onboarding for over 10 solutions. Garvit holds a degree in manufacturing engineering and chemistry from BITS Pilani.
Reviewer

Japneet Singh Chawla
Reviewer
Japneet Singh Chawla is an Engineering Manager at TestMu AI (formerly LambdaTest), where he leads a team driving HyperExecute, the AI-native Test Orchestration Cloud Platform, and integrations with Cypress, Provar, Tosca, and Selenium, improving test execution efficiency and driving adoption across 500+ enterprise clients. He also spearheaded zero-downtime deployments that cut release-related downtime by 90%, and mentors new engineers into productive contributors. He brings 9+ years of experience building and scaling distributed systems, SaaS platforms, and developer tools, with deep hands-on backend engineering across Golang, Python, Node.js, Kafka, and Redis. Earlier at Sumo Logic he built award-winning developer tools, including a VS Code Parser Linter, and at Indus Valley Partners he was a founding member of the Sentiment Analyzer team, building ML-powered solutions for financial clients. Japneet holds an MCA in Computer Science from GGSIPU.


Performance Testing Tools FAQs
Did you find this page helpful?
More Related Blogs
TestMu AI forEnterprise
Get access to solutions built on Enterprise
grade security, privacy, & compliance
- Advanced access controls
- Advanced data retention rules
- Advanced Local Testing
- Premium Support options
- Early access to beta features
- Private Slack Channel
- Unlimited Manual Accessibility DevTools Tests