

Power Your Software Testing with AI Agents and Cloud
The Native AI-Agentic Cloud Platform to Supercharge Quality Engineering. Test Intelligently and Ship Faster.


- TestMu AI (Formerly LambdaTest)
- /
- Learning Hub
- /
- Performance Indicators: KPI Examples and Key Points
Performance Indicators: KPI Examples and Key Points
Improve software testing with Key Performance Indicators (KPIs). Learn their crucial role in ensuring quality and efficiency in testing processes.
Last Updated on:
Key performance indicators in software testing are the metrics that tell you whether your testing process is actually working: how effectively it finds defects, how fast it runs, and what it costs. They matter because catching a defect early in the Software Development Life Cycle (SDLC) is far cheaper than catching it in production.
The hard part is not collecting numbers. Most teams already have dashboards full of them. The hard part is picking the few that connect testing effort to a business outcome, and spotting the ones that are just activity counts dressed up as insight.
Software testing gives you plenty to measure, across load testing, stress testing, and every other approach in your testing methodologies. Without KPIs, that data tells you what happened rather than what to do about it.
This guide covers the four types of KPI, how they map to the seven pillars of quality assurance, and the indicators worth tracking across quality, velocity, and cost, with formulas and worked examples for each.
Understanding the key performance indicators
In software testing, the key performance indicator is the parameter that assesses the performance of the software application and test approaches used.
They play a crucial role in defining objectives for software applications and contribute to the evaluation of fundamental aspects of an organization’s software development and testing processes.
They give information on the application's working and the test approach's accuracy, which can be used to monitor and analyze the testing outcome. Based on this, the team decides how to improve the testing methodologies and enhance the functionality of the software applications.
When understanding key performance indicators, it is essential to note that no single hand could evaluate the effectiveness and quality of the software application testing. Instead, different indicators define health in diverse domains like quality, efficiency, and performance.
Some common examples of key performance indicators are defect density, execution time, response time, etc. Organizations leverage them to reflect their strategic goals and objectives.
Let us understand more about key performance indicators in the following section.
What are the 4 types of KPI?
Not every KPI answers the same question, and picking the wrong type is the most common reason a QA dashboard fills up without changing a single decision. KPIs fall into four broad classifications: strategic, operational, functional, and the leading versus lagging split that cuts across all three.
Understanding which type you are looking at tells you who the audience is, how often to review it, and what action it should trigger. A strategic KPI reviewed daily creates noise; an operational KPI reported to the board creates confusion.
| Type of KPI | What it answers | Software delivery or QA example | Typical audience |
|---|---|---|---|
| Strategic | Are we meeting the business outcome we committed to? | Release confidence measured as escaped defect rate per release; test automation ROI against the automation investment. | Senior management, stakeholders |
| Operational | Is our day-to-day process running at the pace it should? | Test cycle duration per sprint, build pass rate in the CI/CD pipeline, Mean Time to Resolution (MTTR) on open defects. | Test managers, DevOps and release engineers |
| Functional | Is this specific function pulling its weight? | Defect leakage rate owned by QA; code coverage owned by development; change failure rate owned by DevOps. | Department and team leads |
| Leading vs lagging | Does this predict an outcome, or report one that already happened? | Leading indicators: reviewed requirements, code coverage trend, automation coverage. Lagging indicators: escaped defects, production incidents, customer-reported bugs. | Both, depending on the parent KPI |
Leading indicators vs lagging indicators in software testing
Lagging indicators are the easiest to collect and the least useful for changing an outcome, because by the time they move, the release has already shipped. Escaped defect rate is the clearest example: it tells you the quality of a release you can no longer influence.
Leading indicators are harder to define but far more actionable. If reviewed requirements drop below your threshold in week one of a sprint, you can predict the defect leakage that will follow and intervene before it materializes.
Predictive analytics applied to historical test data uses exactly this relationship, correlating leading indicators against past lagging outcomes to forecast release risk while there is still time to act.
A healthy KPI set balances both. Track only lagging indicators and you are running a post-mortem; track only leading indicators and you never confirm whether the prediction held.
Key points on the key performance indicators
Here are some key points to remember about key performance indicators in software testing:
- It gives testers quantifiable metrics that evaluate the different aspects of software testing, like resource utilization, test coverage, etc.
- It allows evaluation of the quality of the software application by reflecting different measures like pass/fail rate, defect density, etc.
- Focuses on test process efficiency and flags high-risk areas. Data on test execution time, for example, shows which critical components to optimize.
- Some indicators, such as response time and error rates, directly impact user satisfaction, making them crucial for user-centric software.

Note: Track KPIs like pass rate and flakiness across every run with TestMu AI. Try TestMu AI Now!
Considering the critical points on key performance indicators, many may relate them to QA metrics. Even though they are related to each other, they hold crucial differences.
What is the difference between key performance indicators and QA metrics?
The QA metrics and key performance indicators are interrelated, but their concepts differ. Metrics are the more precise and detailed measurements showing how appropriately and accurately the software application functions and performs, such as response time and throughput.
Key performance indicators, on the other hand, relate to the complete test process and to the quality of the software applications.
For instance, a KPI related to your performance testing could be the percentage of users completing a transaction within a set time frame, while a metric in the same context might pertain to the average transaction duration.
| Aspect | Key Performance Indicators (KPIs) | QA Metrics |
|---|---|---|
| Purpose | Measure the overall performance, efficiency, and effectiveness of the testing process and software application. | Focus on quantifying various quality aspects and adherence to established standards and processes. |
| Nature | Typically, KPIs are high-level and strategic, often related to business goals and objectives. | QA metrics are more specific, granular, and technical, concentrating on quality attributes and process details. |
| Examples | Escaped defect rate per release; percentage of critical defects resolved within the agreed SLA; test automation ROI. | Defect density (defects per size of code or functionality); test case pass or fail rate; code review findings such as style violations. |
| Focus | Focus on the outcome and impact of testing efforts on the software project's success and user satisfaction. | Focus on assessing the quality of the software, adherence to QA processes, and identifying areas for improvement. |
| Timeframe | Often associated with project milestones or long-term goals. | Continuous monitoring throughout the Software Development Life Cycle. |
| Responsibility | Typically, KPIs interest project managers, stakeholders, and senior management. | QA metrics are primarily used by quality assurance and testing teams. |
| Measurement Units | Typically expressed as percentages, ratios, or other business-related units. | Measured using various technical and quality-related units, such as defects, test cases, lines of code, or time. |
| Actionability | KPIs often prompt strategic decisions and actions, such as resource allocation or project prioritization. | QA metrics drive tactical decisions and actions, such as defect resolution, test case refinement, or process improvement. |
Remember that KPIs and QA metrics serve different purposes but are both valuable in ensuring software quality and project success.
For a thorough grasp of KPIs and QA metrics, their functionality, and their vital role in securing software quality and project success, explore our software testing metrics tutorial for deeper insights.
Most of these KPIs are only as good as the run data behind them, which is where a cloud testing platform earns its place. TestMu AI is an AI-native test orchestration and execution platform that runs manual and automated tests at scale across 10,000+ real devices and 3,000+ browser and OS combinations.
If you want more detailed information on the number of tests passed or failed, try TestMu AI Test Analytics to know more about how this can be used in further sections with a better example.
In the following section, let us discover the importance of key performance indicators with software testing.
Why are key performance indicators important?
In software testing, just involving automation testing tools and technologies in the team can only address the need for the testing resource but may not help optimize the testing process efficiency.
Testers use key performance indicators that reflect their value and significance in assessing test process efficiency and facilitating improvements to optimize the process.
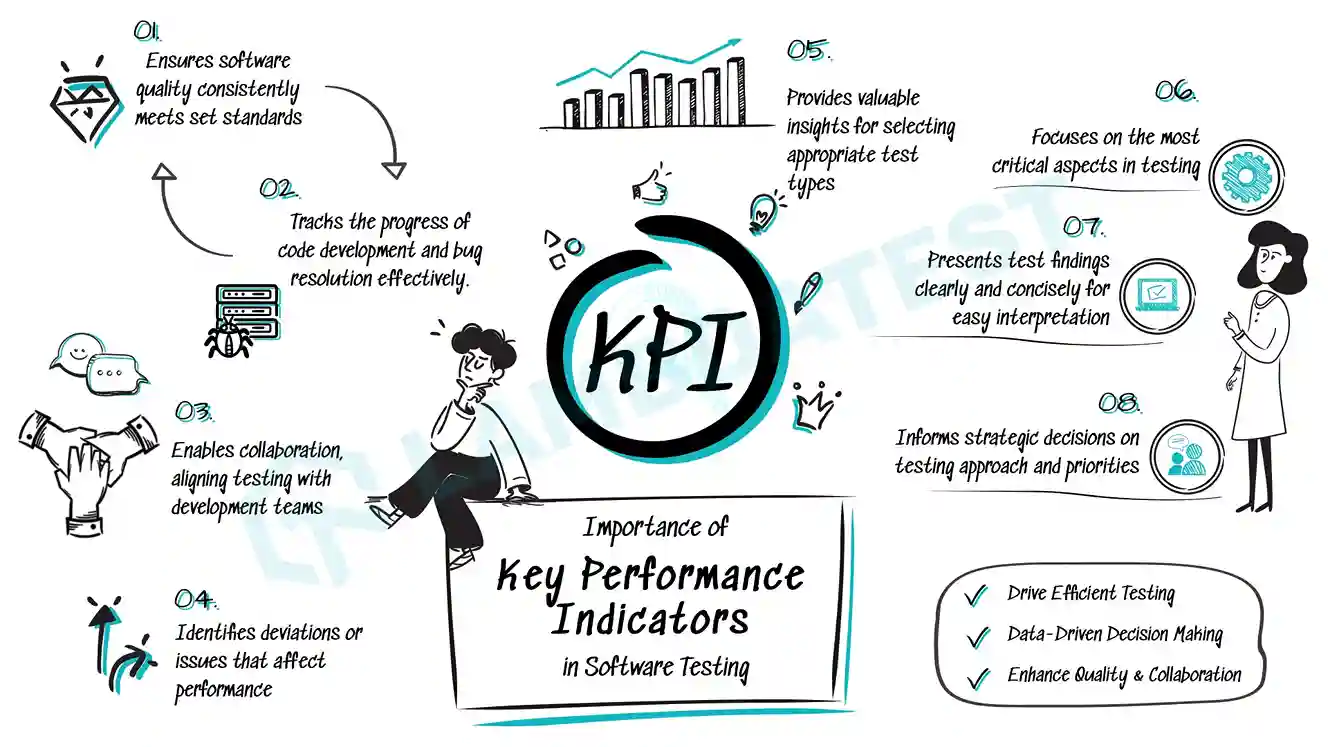
Here are some critical importance of key performance indicators:
- They point to the improvements worth making, using data-driven insight into how each test type performs, from performance testing to system testing.
- They give quantitative data on project progress, such as lines of code written and bugs found and fixed, which shows how far the test process has actually got.
- They confirm the build meets required standards. Defect density and code coverage expose what was found and what was tested, so teams can act before release.
- They inform decisions at every level. Test cycle duration and automation coverage tell you where to prioritize; shorter cycles and higher automation rates justify further investment in automation.
- Sharing metrics such as test case execution or resource utilization rates aligns testing and development teams around one objective.
- They let testers prioritize critical functionality early and surface significant risk in the test process, focusing effort on what matters most.
- They make reporting precise and concise, since findings can be presented as charts and graphs that are quick to compare.
- Comparing actual KPIs against target ones identifies deviations, anomalies, or issues that may affect performance.
In the software testing process, there are certain instances that you should know when key performance indicators may be helpful or may not be beneficial. Get this in detail from the following section.
When to use key performance indicators in software testing?
It is essential to leverage key performance indicators throughout the Software Development Life Cycle to evaluate the reliability of the testing process.
- Testing Process Improvement: Once you have successfully implemented and executed the testing process several times, measuring the key performance indicators to identify areas where your testing procedure could benefit from improvement is appropriate.
- Team Efficiency: Managing a large testing team means testing responsibilities are widely distributed. KPIs keep task allocation efficient and everyone aligned.
- Methodology Update: When updating your testing methodology, measuring KPIs against the original process proves advantageous. It helps you determine the objectives you aim to accomplish with the new testing methodologies.
- Post-Release Monitoring: Once an application is live, its performance still needs watching. KPIs like error rates flag the issues that must be fixed immediately.
Before evaluating key performance indicators, organizations should clearly understand their current testing process. This comprehension is crucial for selecting key performance indicators that reveal improvement areas. Using KPIs incorrectly can lead to testing errors without this clarity.
Where key performance indicators are not applicable?
While it's crucial to measure the efficiency of a test process to ensure it's on the right track, utilizing quality KPIs for assessing the testing process may not be practical in certain situations:
- In the initial stages of product testing: Before a first launch there is not enough data to evaluate. Focus on establishing the testing process rather than measuring it.
- For short testing cycles: If testing is a one-time affair and the application will not change much after launch, there are no further cycles to improve, so measuring effectiveness earns little.
- With limited budget constraints: Measuring KPIs costs time and effort. On a constrained budget, put that effort into a cost-effective testing process instead.
How do you align QA KPIs with the 7 pillars of quality assurance?
Most QA teams measure only the pillar that is easiest to instrument, which is test execution. That leaves planning, standards, and continuous improvement invisible, and it is usually where the real quality problems originate.
The seven pillars of quality assurance describe the full function rather than the testing stage alone. The discipline is to assign one or two high-level KPIs per pillar and resist the temptation to add more, because a pillar with six KPIs has no owner and no signal.
| Pillar | What it covers | KPI to measure it |
|---|---|---|
| Planning | Scope, risk assessment, and the test strategy agreed before work starts. | Reviewed requirements (%); test plan coverage against agreed scope. |
| Standards | Coding standards, entry and exit criteria, and definition of done. | Exit criteria adherence (%); code review findings per release. |
| Testing | Design and execution of manual and automated tests across the suite. | Covered requirements (%); test case effectiveness. |
| Defect management | How defects are triaged, routed, fixed, and verified. | Mean Time to Resolution (MTTR); defect closure rate. |
| Metrics | Whether the measurement system itself is trusted and acted on. | Rejected defects (%) as a proxy for reporting accuracy. |
| Continuous improvement | Retrospectives, process changes, and whether they actually land. | Process adherence and improvement (%); successful sprint ratio. |
| Tools | Test infrastructure, CI/CD integration, and automation tooling. | Test automation ROI; build pass rate in the pipeline. |
Read the table as a coverage check rather than a to-do list. If a pillar has no KPI against it today, that is a blind spot, and the defects escaping into production are more likely to trace back to it than to the pillars you already measure.
The key performance indicators
Before working through the individual indicators, it is worth separating a metric from a KPI. The two words get used interchangeably, and that is precisely how dashboards fill with numbers that nobody acts on.
A metric is any measurement you can take. A KPI is the narrow subset tied to a business outcome and a target you have committed to. Every KPI is a metric; most metrics are not KPIs.
| Aspect | Metric (e.g. test cases executed) | KPI (e.g. escaped defect rate) |
|---|---|---|
| What it tells you | That activity happened. | Whether that activity produced the outcome you wanted. |
| Has a target | Not necessarily. 400 tests executed is neither good nor bad on its own. | Always. The number only means something against a threshold or SLA. |
| Business context | None by itself. It measures effort, not value. | Tied directly to release confidence, cost, or customer impact. |
| What happens when it moves | Often nothing. It is reported, then scrolled past. | It triggers a decision: ship, hold, reallocate, or investigate. |
| Risk of gaming | High. Test counts and authored tests are easy to inflate without adding value. | Lower, because the outcome is what is measured, not the activity. |
The indicators below are grouped by the business value they serve, rather than listed flat. Quality KPIs answer whether the product is fit to ship, velocity KPIs answer how fast the team gets there, and cost and ROI KPIs answer what the testing effort is worth.
Key performance indicators in software testing are essential for measuring the quality and accuracy of software applications. These key performance indicators play a crucial role in the SDLC, as the testing team relies on them to ensure the reliability of their tests.
Here are the essential key performance indicators you should be aware of, grouped by the question each one answers for the business.
Quality KPIs: is the product fit to ship?
Quality KPIs are the ones that should gate a release. They measure defects that reached users, defects still open, and how much of the agreed scope was genuinely verified rather than merely touched.
Defect Detection Effectiveness (DDE)
Defect Detection Effectiveness for a testing phase signifies the proportion of identified defects within that phase relative to the total defects, presented as a percentage. It serves as a measure of the efficacy of individual steps.
If, for instance, the aggregate count of identified defects amounted to 120, with 30 being pinpointed during system testing, the DDE for system testing can be computed as follows: (30 ÷ 120) x 100 = 25%.
In addition, DDE also measures the total number or percentage of identified and fixed bugs concerning the total number of defects in the software application. This information makes it possible to check how effective the testing process is and address different software system issues.
DDE = (Defects detected in the specific phase ÷ Total defects) x 100
Example of DDE
Imagine your software goes through these testing phases before its deployment on production servers:
- Unit Testing, also called component testing
- Integration Testing
- System Testing
- Acceptance Testing
Let's suppose that following the deployment of the software in production, we have the following data:
| Phase | Defect | DDE | DDE cumulative |
|---|---|---|---|
| Unit testing | 25 | 25% | 25% |
| Integration testing | 30 | 30% | 55% |
| System testing | 20 | 20% | 75% |
| Acceptance testing | 10 | 10% | 85% |
| Production | 15 | 15% | 100% |
| 100 |
Insights Drawn from DDE
- More defects surfaced in integration testing (30) than unit testing (25), suggesting the unit tests need strengthening.
- Automation testing (unit plus integration) caught only 55% of the defects.
- A quarter of all defects reached users, found in acceptance testing (10%) or production (15%). That share points to weak internal testing.
How does it measure testing?
Here are some ways through which DDE serves as the crucial measure of the testing process:
- Testers and developers can have detailed information on the overall quality of the software application. For example, a high DDE measure is more comprehensive in testing as more defects are identified and addressed.
- The project manager uses DDE to keep a check on the progress of the testing process and, based on this, can make data-driven decisions. If there is a low DDE, it will show that more testing efforts are required to improve the quality of the software applications.
- It also helps in risk assessment in software testing. The low DDE shows some undetected issues or bugs that can interfere with production, leading to crucial issues and adversely affecting the user experience.
Significance
- Identifies deficiencies across testing phases.
- Potential for a substantial reduction in retesting efforts.
- Potential to lower the overall project costs.
- Enhances the productivity of the Quality Assurance team.
- Enable teams to identify trends and continuously improve their testing process, tools, and methodologies.
Defect Density
Defect Density corresponds to the count of verified defects within a software module during a specific timeframe or development phase, divided by the module's size.
It facilitates the determination of software readiness for release.
Defect Density is typically measured per thousand lines of code, often called KLOC.
A basic formula for determining Defect Density involves dividing the number of defects by the module's size, such as the number of lines of code.
Defect Density (DD) = (Number of Defects) / (Size of Module)
Example of Defect Density
Suppose you have added three modules to your software applications. Each module has the following count of identified glitches:
Module 1 = 10 bugs
Module 2 = 20 bugs
Module 3 = 10 bugs
Total bugs= 10+20+10 = 40
The total lines of code (LOC) for each module are as follows:
Module 1 = 10,000 LOC
Module 2 = 15,000 LOC
Module 3 = 10,000 LOC
Total Lines of Code = 10,000+15,000+10,000 = 35,000
The calculation of Defect Density is as follows:
Defect density = 40/35,000 = 0.00114 bugs/LOC = 1.14 bugs/KLOC
How does it measure testing?
- Defect density highlights the quality of the software component or module. For example, if the defect density is high, the module has more defects per unit of size, and issues must affect the software application’s functionality.
- The testing team can compare diverse types of modules within a software project. For example, the team can allocate more resources for a practical test process if an application component has a high defect density.
- A module with a high Defect Density can prompt teams to investigate the underlying causes. This can lead to improvements in coding practices and development processes.
Significance
Defect Density assists organizations in evaluating the software's quality. It can be used to determine the right time to release, or when a build transitions out of the alpha or beta phase once density falls below a set threshold.
Organizations use defect density during the system testing phase. With this, the team can pull out the issues in the code and address more substantial issues encompassing the entire program.
Applying it during development instead may pull the team's attention onto minor problems, potentially pushing the project beyond its deadlines.
Nonetheless, there is no universally fixed benchmark for bug incidence. Having one defect per thousand lines of code is generally considered an indicator of sound project quality.
Active Defects
A straightforward yet crucial key performance indicator, It measures the status of a defect. In this context, the term "active" can encompass states such as new, open, or fixed (awaiting re-testing). It enables the team to take necessary measures to improve and resolve defects.
The testing manager must establish a cut-off point beyond which prompt action is required to reduce functional defects. The general principle is that a lower count of functional defects signifies higher application quality at a given moment.
Whether it's 100 defects, 50 defects, or 25 defects, the chosen threshold will determine what is acceptable and what isn't. Any count exceeding the established threshold falls into the "Not OK" category and should be promptly addressed.
Example of Active Defect
For example, during the test process of the software application, it was found that users cannot reset their passwords through the “forget password” feature. This issue is marked as an active defect as it does not allow the application to function correctly.
The formula to calculate Active Defects is simple:
Active Defects = Number of Defects Open and Not Resolved.
How does it measure testing?
- Active Defects provide visibility into the progress of defect resolution during the testing phase. Over time, decreasing functional defects indicates that the development team addresses and resolves issues.
- If there is any active defect, it highlights the area that needs more attention by the team.
Significance
- By addressing active defects, the team can improve the developed software application's quality and analyze the test process's effectiveness.
- Active defect monitoring is a crucial activity to maintain the timeline for the release of the software application. This helps fix the defect in time and, in turn, allows timely release of the software application.
Covered Requirement
This key performance indicator signifies the proportion of requirements addressed by at least one test, which makes it the measure for evaluating alignment between test cases and requirements.
The responsibility falls on the test manager to ensure that corresponding test cases accompany every need, and corrective measures should be taken when there are unlinked requirements or test cases. The objective is to maintain a 100% alignment between requirements and test cases.
Percentage of Covered Requirements = (Tested Requirements / Total Requirements) x 100
Example of Covered Requirements
Suppose a software development project has different requirements listed in the document, like user registration and secure payment processing. Let's say there are 100 such requirements, the team creates a test case to validate each condition, and the QA team has tested 90 of them against the specified criteria.
Percentage of Covered Requirements = (90 / 100) x 100 = 90%
How does it measure testing?
The percentage of covered requirements highlights the comprehensiveness of the test performed for the application. If there is a high percentage of covered requirements, it will show that the testing process has been thorough.
Analyzing the covered requirement makes tracing the condition and test cases possible. With this, testers can ensure that each requirement is aligned with test coverage. It allows us to unearth untested and under-tested areas.
Significance
- Testers can ensure that developed software applications meet user requirements by measuring the high percentage of requirements in the software project.
- There will be a lowering of the risk of undetected defects.
- When testers track covered requirements, information on insufficient testing and the need to allocate more testing efforts can be fetched.
- It assures that all specified requirements have been validated.
Rejected Defects
One other significant indicator that falls within the scope of test monitoring and effectiveness is the ratio of defects rejected by the development team. Rejected defects are regarded as defects that have been identified in the test process and found that they are invalid during the review process.
This key performance indicator quantifies the proportion of defects turned down compared to the overall number of documented defects.
Should this percentage surpass the established threshold, it becomes imperative to pinpoint and address the underlying concern. It could entail providing additional training to software testers or enhancing the quality of requirement documentation.
Rejected Defects = Number of Defects Rejected
Example of rejected defects
Suppose in the software development project, a team of testers identified an issue or defect in the login functionality of the application. They reported it to the development team for review and fixing. However, out of 80 reported defects, the developer team determined that 20 of them were invalid and needed to be rejected as defects.
Now, let's calculate the "Rejected Defects" KPI:
Rejected Defects KPI:
- Total Defects Reported: 80
- Rejected Defects: 20
Number or Percentage of Rejected Defects = (Rejected Defects / Total Defects Reported) x 100
Number or Percentage of Rejected Defects = (20 / 80) x 100 = 25%
How does it measure testing?
- It tells the team how complete their defect identification process is. A high rejection count signals a problem in how defects are being reported.
- A lower percentage of rejected defects is generally preferable, as the defect reporting process is accurate, and valid issues are being identified and addressed promptly.
Significance
- The rejection of invalid defects helps maintain the integrity of the defect tracking system.
- When the team rejects defects that are not valid, the organization usually optimizes its test process and allocates the resources accordingly.
- The organization keeps the defect tracking system free of any invalid issues. And with this, it is ensured that the system can detect and address any real defects.
- Reporting the number or percentage of rejected defects provides transparency about the defect review process and highlights its effectiveness.
Reviewed Requirement
Several of the KPIs outlined so far concentrate on defect detection rather than defect prevention. The reviewed requirement leans towards being a "preventive KPI" rather than a "detective KPI."
This KPI centers on identifying needs (or user stories) that have undergone review to eliminate ambiguity, and it mainly involves the stakeholders responsible for assessing each requirement's completeness and accuracy.
Clear requirements result in better design choices and better use of resources. These key performance indicators ensure a subject matter expert has assessed each requirement before implementation, which contributes to precise development and testing and proves cost-effective in the long term.
Reviewed Requirements (%) = (Number of Reviewed Requirements / Total Number of Requirements) x 100
Example of reviewed requirements
For example, developing a software project or website has a set of documented requirements. The team of testers is responsible for ensuring these are reviewed and validated so that no error carries into the development process.
Say there are 200 documented requirements, and the QA team has successfully validated 180.
To calculate the percentage of reviewed requirements, you can use the formula:
Percentage of Reviewed Requirements = (Reviewed Requirements / Total Requirements) x 100
Percentage of Reviewed Requirements = (180 / 200) x 100 = 90%
How does it measure testing?
- If the reviewed requirements are high in number, it reflects that the requirement document is of good quality and ensures that the test will be accurate.
- The organization always aims to have a high percentage of reviewed requirements because it helps to ensure that the software project’s goal is accurately understood and there is clarity on what is required to be tested.
- With the indicator of the reviewed requirement, the team finds any potential issue or error in the requirement before the release of the software application.
Significance
- The review process allows for the early identification and resolution of ambiguities, contradictions, or gaps in the requirements, reducing the likelihood of late-stage defects.
- Involving business stakeholders in the review ensures that the software aligns with the organization's strategic objectives.
Want to build quality software that meets users' requirements? Dive deep into our blog on requirement analysis to discover the power of user requirements in delivering top-notch software and take your software development to the next level.

Severe Defects
While monitoring severe defects is a valuable KPI, ensuring the testing team applies safeguards when assigning defect severity is crucial. This indicator is designed to restrict the number of severe defects within an application at any given time.
Before implementing this metric, though, it is imperative to train the testing team to identify severe defects accurately. Without that, the threshold measures inconsistent severity labels rather than real risk.
Once you've established the necessary checks, you can set a threshold for these KPIs. Any defect with an Urgent or Very High-status defect should be included in this metric's count. If the total count surpasses 10, it should trigger a red flag.
Example of severe defects:
Let us consider the development of a mobile application. The testing team tests the app to detect bugs, then reports them to the development team to fix.
Say the QA team identified and reported 50 defects during testing. Each defect is assigned a severity level across four categories: Critical, High, Medium, and Low.
- Critical Defects: 10
- High Severity Defects: 15
- Medium Severity Defects: 15
- Low Severity Defects: 10
Now, let's calculate the "Severe Defects" KPI:
Severe Defects KPI:
- Critical Defects: 10
- High Severity Defects: 15
- Total Defects Reported: 50
Number or Percentage of Severe Defects = ((Critical Defects + High Severity Defects) / Total Defects Reported) x 100
Number or Percentage of Severe Defects = ((10 + 15) / 50) x 100 = (25 / 50) x 100 = 50%
How does it measure testing?
- Tracking severe defect key performance indicators helps measure the overall quality of the software being tested. If the percentage of severe defects is high, it shows increased issues or errors in the application that need more attention and resolution.
Significance
- Severe defects have a high potential to negatively impact users' experience, security, or ability to use the software effectively. Identifying and resolving them is essential for user satisfaction.
- These key performance indicators allow the detection of severe defects in the early stage of development of software applications. Therefore, the team lowers the risk of critical issues in the production environment.
Velocity KPIs: how fast does the team get there?
Velocity indicators measure throughput: how much of the plan has been worked through, and how quickly. They are the most commonly tracked numbers in QA and the most commonly misread, because every one of them measures activity rather than outcome.
Treat these as supporting context for your quality KPIs, not as goals in their own right. A team can double its authored tests and executed instances while shipping exactly the same number of escaped defects.
| Velocity KPI | Formula | What it tells you | Where it misleads |
|---|---|---|---|
| Authored tests | Number of test cases or scripts prepared in a given period. | Test design throughput, and whether new requirements are getting matching coverage. | Rewards volume over value. Track it against the number of requirements, never on its own. |
| Test instances executed (%) | (Executed test instances / Total test instances) x 100 | How far through the test execution plan you are. | Says nothing about build quality, which depends on test case design and test data. |
| Number of tests executed | Total test cases executed on a build, manual and automated. | Raw execution capacity within a time frame. | A high count with low coverage means you are re-running easy paths. |
| Passed tests (%) | (Number of successful test cases / Total test cases) x 100 | Suite stability and how effective test arrangements are at capturing issues. | A near-perfect pass rate usually signals weak tests rather than a healthy build. |
| Defects fixed per day | Number of defects resolved and closed in a day. | Defect resolution throughput across the team. | Deeply subjective, since one hard defect can outweigh ten trivial ones. |
| Average test execution time | (Total time spent on test execution) / (Number of test cases executed) | Testing time projections for release planning and scheduling. | Shrinks when you drop slow, high-value end-to-end tests. |
| Time to test | End time of testing - Start time of testing | How quickly a new feature moves from test start to test complete. | A long time to test may signal feature complexity, not team inefficiency. |
Watch our tutorial on test analytics and observability suite to get insights on your test cases and analyze your overall performance.

Subscribe to the TestMu AI YouTube channel for more videos on Selenium automation, Cypress testing, and Playwright testing, and upgrade your testing skills!
How do MTTR and escaped defect rate measure release quality?
Two KPIs do more to describe release confidence in a CI/CD pipeline than any count of executed tests: Mean Time to Resolution (MTTR) and escaped defect rate. One measures how quickly you recover when something breaks; the other measures how often you find out from your users rather than your tests.
Together they answer the only question a release manager actually has. If a defect ships, how bad is it and how fast can we close it?
Mean Time to Resolution (MTTR)
MTTR measures the average elapsed time from a defect being reported to that defect being resolved and verified. It replaces the older, vaguer notion of defect resolution time with a term that DevOps, SRE, and QA teams all read the same way.
Unlike defects fixed per day, MTTR is not gameable by picking off easy tickets, because it averages the clock time on every defect including the hard ones.
MTTR = Total time spent resolving defects / Number of defects resolved
Example of MTTR
Suppose your team closed 8 critical defects in a sprint. The cumulative time from report to verified fix across all 8 was 64 hours.
MTTR = 64 / 8 = 8 hours per critical defect.
That single number is what you compare against your SLA. If you have committed to a 4-hour resolution on critical issues, an MTTR of 8 hours means you are missing the commitment on average, not occasionally.
Why MTTR drives release confidence in CI/CD
- In a CI/CD pipeline, shipping frequently is only safe if recovery is fast. A low MTTR is what makes a high deployment frequency a reasonable risk rather than a reckless one.
- Always segment MTTR by severity. A blended figure across critical and low-severity defects hides the number that matters and flatters the team.
- Set the threshold from the SLA you have committed to customers, not from a published benchmark. There is no universal target, and a good MTTR for a payments platform is a poor one for an internal tool.
- Track it as an operational KPI reviewed per sprint. As a lagging indicator it confirms whether your defect management pillar is functioning.
Escaped defect rate (defect leakage rate)
Escaped defect rate, also called defect leakage rate, measures the proportion of defects that your testing missed and that users or production monitoring found instead. It is the single most honest measure of whether your test suite is doing its job.
Where DDE tells you how well each phase catches defects, defect leakage rate tells you what got past all of them.
Escaped Defect Rate (%) = (Defects found after release / Total defects found before and after release) x 100
Example of escaped defect rate
A release had 90 defects caught across unit, integration, system, and acceptance testing. After the release went live, users and production monitoring reported a further 10.
Escaped Defect Rate = (10 / 100) x 100 = 10%.
Ten percent of everything wrong with that release was discovered by a customer. Whether that is acceptable is a business decision, which is exactly what makes it a strategic KPI rather than a QA metric.
How escaped defect rate impacts release confidence
- It is the clearest lagging indicator of test suite quality. A rising leakage rate means your coverage numbers are describing tests that do not find real defects.
- Weight it by severity. One escaped critical defect matters more than twenty escaped cosmetic ones, so track critical leakage as its own threshold.
- Read it alongside MTTR. A team with 10% leakage and a 2-hour MTTR is in a far stronger position than one with 4% leakage and a 3-day MTTR.
- Use it as the release gate. Coverage and pass rate describe effort; leakage describes what your customers actually experienced.
How do you measure test automation KPIs and ROI?
The number of automated tests is the most reported and least useful automation KPI in existence. On its own it is a vanity metric: it tells you what the team built, not what the business got back.
A team can automate 2,000 tests that duplicate each other, run against stable code paths, and never fail. The count looks excellent and the business value is close to zero. Automation KPIs only mean something when grouped into coverage, efficiency, and business impact, and when the last group is the one you report upward.
Coverage and scope: how much does automation reach?
These indicators describe how much of the suite automation reaches. They are leading indicators, useful for spotting gaps early, but they say nothing about whether the automated tests are worth running.
| KPI | Formula | How to read it |
|---|---|---|
| Automation coverage (%) | (Number of automated test cases / Total number of test cases) x 100 | Start with a modest threshold such as 20% and raise it as the QA team matures. The right ceiling depends on the product and the cost of maintaining the suite. |
| Automated requirement coverage (%) | (Requirements covered by at least one automated test / Total requirements) x 100 | More meaningful than raw test counts, because it maps automation to agreed scope rather than to scripts. |
| Code coverage (%) | (Lines of code executed by tests / Total lines of code) x 100 | Identifies untested code paths. High coverage with high leakage means the tests execute code without asserting behavior. |
Efficiency and velocity: what does automation cost you?
These indicators describe what automation costs you in time and maintenance. They are where most automation programs quietly fail, because a flaky suite consumes more engineering hours than the manual testing it replaced.
| KPI | Formula | How to read it |
|---|---|---|
| Automated test pass rate (%) | (Automated tests passed / Automated tests executed) x 100 | Separate genuine failures from flaky ones. A suite that fails randomly trains the team to ignore red builds. |
| Test suite execution time | Total wall-clock time for a full automated run. | Directly gates deployment frequency in a CI/CD pipeline. Parallel execution across real browsers and devices is the usual lever here. |
| Test maintenance effort | Engineering hours spent fixing broken tests / Total automation hours | The cost line most ROI calculations forget. If it climbs past a third, the suite is a liability. |
Business impact: test automation ROI
This is the group that translates test effectiveness into real business value, and the one that belongs in front of senior management. Test automation ROI compares what automation saved against what it cost to build and maintain.
Test Automation ROI (%) = ((Cost of manual execution saved - Cost of automation) / Cost of automation) x 100
Where the cost of automation is the sum of tool and infrastructure spend, initial scripting effort, and ongoing maintenance effort, all converted to a common currency.
Example of test automation ROI
A regression suite of 700 automated tests runs 40 times a year. Executing it manually would take 60 hours per cycle at $40 per hour, so manual execution saved is 60 x 40 x $40 = $96,000.
Scripting cost 400 hours at $60 per hour ($24,000), maintenance ran to 200 hours ($12,000), and tooling and infrastructure cost $14,000. Total cost of automation = $50,000.
Test Automation ROI = (($96,000 - $50,000) / $50,000) x 100 = 92%.
Note what this calculation does not capture: the cost of defects the automated suite caught before release. Pair ROI with escaped defect rate so the value of prevention shows up alongside the labor saving.
Reporting automation KPIs upward
- Lead with ROI and escaped defect rate. Coverage and test counts are supporting evidence, not headlines.
- Report maintenance effort honestly. An ROI figure that excludes the cost of fixing flaky tests is not an ROI figure.
- Tie suite execution time to deployment frequency. That is how automation KPIs connect to DevOps outcomes a business audience already cares about.
- Review ROI quarterly rather than per sprint. It is a strategic KPI, and sprint-level noise makes it meaningless.
Suite execution time is usually the constraint that decides whether these numbers work. Running tests in parallel across cloud infrastructure with real browsers and devices is what keeps a growing regression suite from throttling your release cadence.
Bonus Key Performance Indicators
Different QA teams assess various key performance indicators based on their objectives for monitoring, controlling, or enhancing their processes. You can establish these indicators on different timeframes, be it weekly, monthly, annually, or any other defined period.
The indicators below are grouped by the same three categories used throughout this guide. Pick the one or two per category that map to a decision you actually make, and leave the rest.
Additional quality KPIs
| KPI | Formula | How to read it |
|---|---|---|
| Test case effectiveness (%) | (Number of defects found by test cases / Total test cases executed) x 100 | Higher effectiveness means test cases are well-designed for defect detection rather than merely numerous. This is the KPI that exposes a suite padded with tests that never fail. |
| Test case quality (%) | (Number of high-quality test cases / Total test cases) x 100 | Scores written test cases against predefined criteria: fault-focused design, coverage of both success and failure scenarios, precise test data, and clearly stated expected results. |
| Quality ratio (%) | (Number of defect-free components / Total tested components) x 100 | A quick status read for test managers. If it drops between two iterations without new test cases being added, recent fixes or features are hurting the system. |
| Unresolved vulnerabilities | Total identified vulnerabilities - Vulnerabilities remediated | A security indicator best segmented by severity. Combine it with MTTR to judge how effective your security response actually is. |
Additional velocity and process KPIs
| KPI | Formula | How to read it |
|---|---|---|
| Defect closure rate (%) | (Number of closed defects / Total fixed defects) x 100 | Measures how efficiently testers verify and close fixed defects, which sharpens release cycle estimates. Read it next to MTTR rather than instead of it. |
| Defect resolution success ratio (%) | (Successfully resolved and verified defects / Total defects) x 100 | Catches the reopen problem. If nothing is reopened you are at 100%, and a falling ratio means fixes are not holding. |
| Successful sprint ratio (%) | (Number of successful sprints / Total sprints) x 100 | A high ratio suggests the project is moving in the right direction. Useful for spotting where in the process improvement is needed. |
| Process adherence and improvement (%) | (Improvement initiatives implemented / Improvement initiatives planned) x 100 | The only KPI that measures the continuous improvement pillar. High adherence drives efficiency and consistency in project execution. |
Conclusion
The role of key performance indicators in software development and testing cannot be ignored. This guide has covered the four types of KPI, how they map to the seven pillars of quality assurance, and the indicators worth tracking across quality, velocity, and cost.
The distinction that matters most is the one between a metric and a KPI. Counting authored tests, executed instances, and automated scripts measures effort.
Escaped defect rate, MTTR, and test automation ROI measure whether that effort was worth anything, and those are the three numbers that belong in front of the people funding your testing.
Start small. Assign one or two KPIs per pillar, set thresholds from your own SLAs rather than from industry benchmarks, and drop any indicator that has never once changed a decision. A short dashboard people act on beats a long one they scroll past.

Author

Nazneen Ahmad
Blogs: 39


Nazneen Ahmad is a freelance Technical Content SEO Writer with over 6 years of experience in crafting high ranking content on software testing, web development, and medical case studies. She has written 60+ technical blogs, including 50+ top-ranking articles focused on software testing and web development. Certified in Automation Basic and Advanced Training - XO 10, she blends subject knowledge with SEO strategies to create user focused, authoritative content. Over time, she has shifted from quick, keyword-heavy drafts to producing content that prioritizes user intent, readability, and topical authority to deliver lasting value.
Reviewer

Rajas Nawar
Reviewer
Rajas Nawar is a Community Contributor at TestMu AI (formerly LambdaTest), where he authors software-testing content for QA engineers and testers. His articles cover black box testing, state transition testing, CI/CD test case templates, and software-testing interview questions, giving testing teams practical guides and ready-to-use templates for their quality assurance work.


Key Performance Indicators FAQs
Did you find this page helpful?
More Related Learning Hubs
TestMu AI forEnterprise
Get access to solutions built on Enterprise
grade security, privacy, & compliance
- Advanced access controls
- Advanced data retention rules
- Advanced Local Testing
- Premium Support options
- Early access to beta features
- Private Slack Channel
- Unlimited Manual Accessibility DevTools Tests