

Power Your Software Testing with AI Agents and Cloud
The Native AI-Agentic Cloud Platform to Supercharge Quality Engineering. Test Intelligently and Ship Faster.


- TestMu AI (Formerly LambdaTest)
- /
- Blog
- /
- k6 Testing Tutorial: Load & Browser Testing With Grafana k6
k6 Testing Tutorial: Load & Browser Testing With Grafana k6
A hands-on k6 testing tutorial covering installation, load testing scripts, browser testing, HTML reporting, cloud execution, and GitHub Actions CI/CD.
Last Updated on:
Grafana k6 is an open-source load testing tool that scripts virtual users in JavaScript and runs them from the command line, so a load test can live in the same repository as the code it checks.
Picture an eCommerce site before Black Friday. Load testing shows whether login and checkout hold up at the expected peak, and k6 extends that performance testing into a real browser.
This tutorial builds one login test and runs it three ways: locally with an HTML report, on cloud browsers, and in GitHub Actions on every push. The scripts use the current k6/browser API from k6 v2.2.0.
TL;DR
- Grafana k6 is an open-source load testing tool that scripts virtual users in JavaScript.
- k6 load tests measure response times, error rates, and throughput to find the capacity limits of an application.
- The k6 browser module measures frontend performance in a real Chromium browser alongside API load tests.
- Since k6 v0.52, browser tests import k6/browser instead of the removed k6/experimental/browser module.
- k6 tests can run on every push in GitHub Actions using grafana/setup-k6-action and grafana/run-k6-action.
Why is Load Testing important?
Slowdowns and crashes during a sale or product launch cost revenue at the exact moment traffic peaks, and the damage to brand trust lasts beyond the lost orders.
Load testing reveals those failures before real users do:
| What load testing finds | Why it matters |
|---|---|
| Capacity limits | Shows the user load the system handles before performance drops, which drives capacity planning |
| Performance bottlenecks | Exposes slow responses, high resource use, and scaling issues to fix first |
| Stability problems | Surfaces crashes and resource exhaustion that only appear under sustained load |
| Response under concurrency | Measures how response times change as concurrent users grow |
| User experience at peak | Confirms the application stays responsive when traffic is highest |
Features of k6
Grafana k6 (previously known as Load Impact) is a modern open-source load testing tool written in GO, using which you can easily assess the performance and scalability of the applications by simulating real-life user traffic.
k6 uses JavaScript as its scripting language, which makes it highly accessible to developers and testers familiar with JavaScript. It provides a straightforward and flexible scripting interface for defining test scenarios and simulating user behavior.
Below are some of the main features of k6.
- Testing Capabilities
k6 is optimized for running high-load tests such as spike tests, stress tests, and soak tests. It helps assess the reliability and performance of APIs, microservices, and websites under different load conditions.
- Supports both Browser and API Load Testing
Apart from API load testing, you can also perform browser-based performance testing using k6's browser feature. This allows for catching issues specific to browsers and identifying performance bottlenecks related to client-side rendering and interactions. You can also integrate k6 with cloud-based digital experience testing platforms like TestMu AI to perform automated testing and get the flexibility to run your test on different OS and browser (Chromium) versions.
Visit our support documentation to get started with k6 testing with TestMu AI.
You can go through the below video on the k6 testing tutorial.
Subscribe to our TestMu AI YouTube Channel to get the latest updates on tutorials around Selenium testing, Cypress testing, and more.
- Metrics and Results
k6 offers comprehensive metrics and results both during and after the execution of the test. It captures information such as response times, throughput, error rates, and latency, allowing you to analyze and interpret the performance of their application under different load scenarios.
- Test Execution
k6 supports command-line execution and integration into existing Continuous Integration (CI) pipelines like GitHub Actions/Jenkins. This enables accelerated feedback, ensuring timely insights and improvements. k6 scripts can also run on TestMu AI's HyperExecute, which documents a k6 integration driven from its YAML file and CLI.
- Community and Support
k6 has an active and growing community of users and contributors with 31.5k stars and 1.6k forks on GitHub. There is extensive documentation available, including guides, examples, and a knowledge base, to help users get started and troubleshoot any issues they may encounter.

Note: Perform k6 testing across 3,000+ real browser and OS combinations. Try TestMu AI Today!
k6 Installation
k6 installation is very easy compared to other tools available in the market. With just a single command, the installation process is completed, eliminating the need to deal with multiple extensions. Now, let's learn the process of k6 installation on different operating systems.
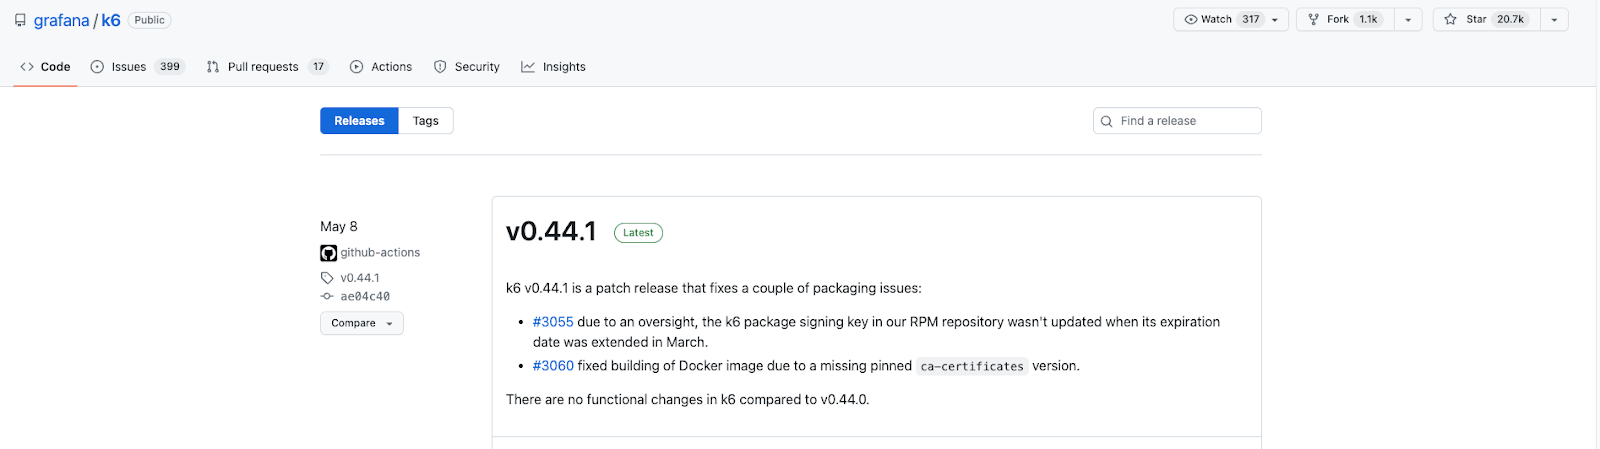
At the time of writing this k6 testing tutorial, the current version of k6 is v2.2.0. Always check the k6 GitHub releases page for the latest version before installing.
Mac
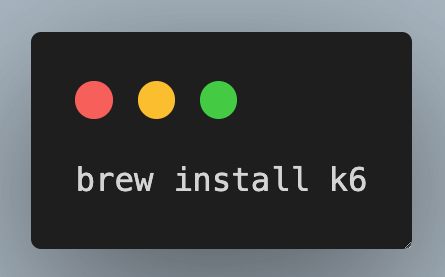
To install on Mac, use the below command.
Windows
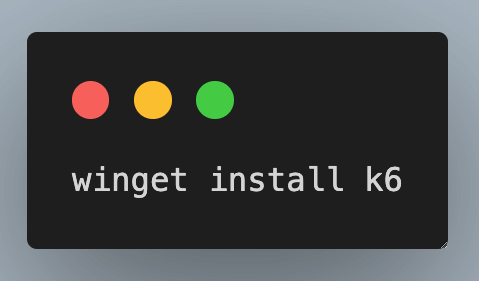
To install on Windows, run the below command (if you are using Windows Package Manager).
Or click on the link for the direct installation.
Installation using Docker
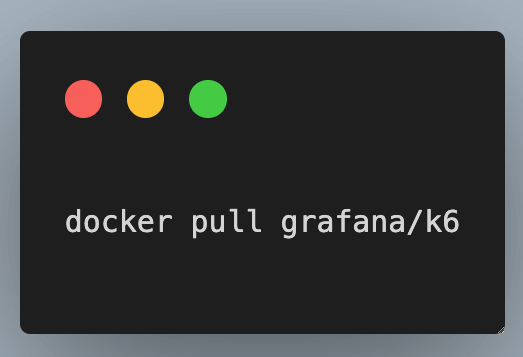
Once you have downloaded k6, run the command k6 version on the terminal/command prompt to verify the installation.

Below is the screenshot from the official k6 GitHub Repo where you can verify the latest version of k6.
This k6 testing tutorial focuses on scriptable, code-based k6 tests.
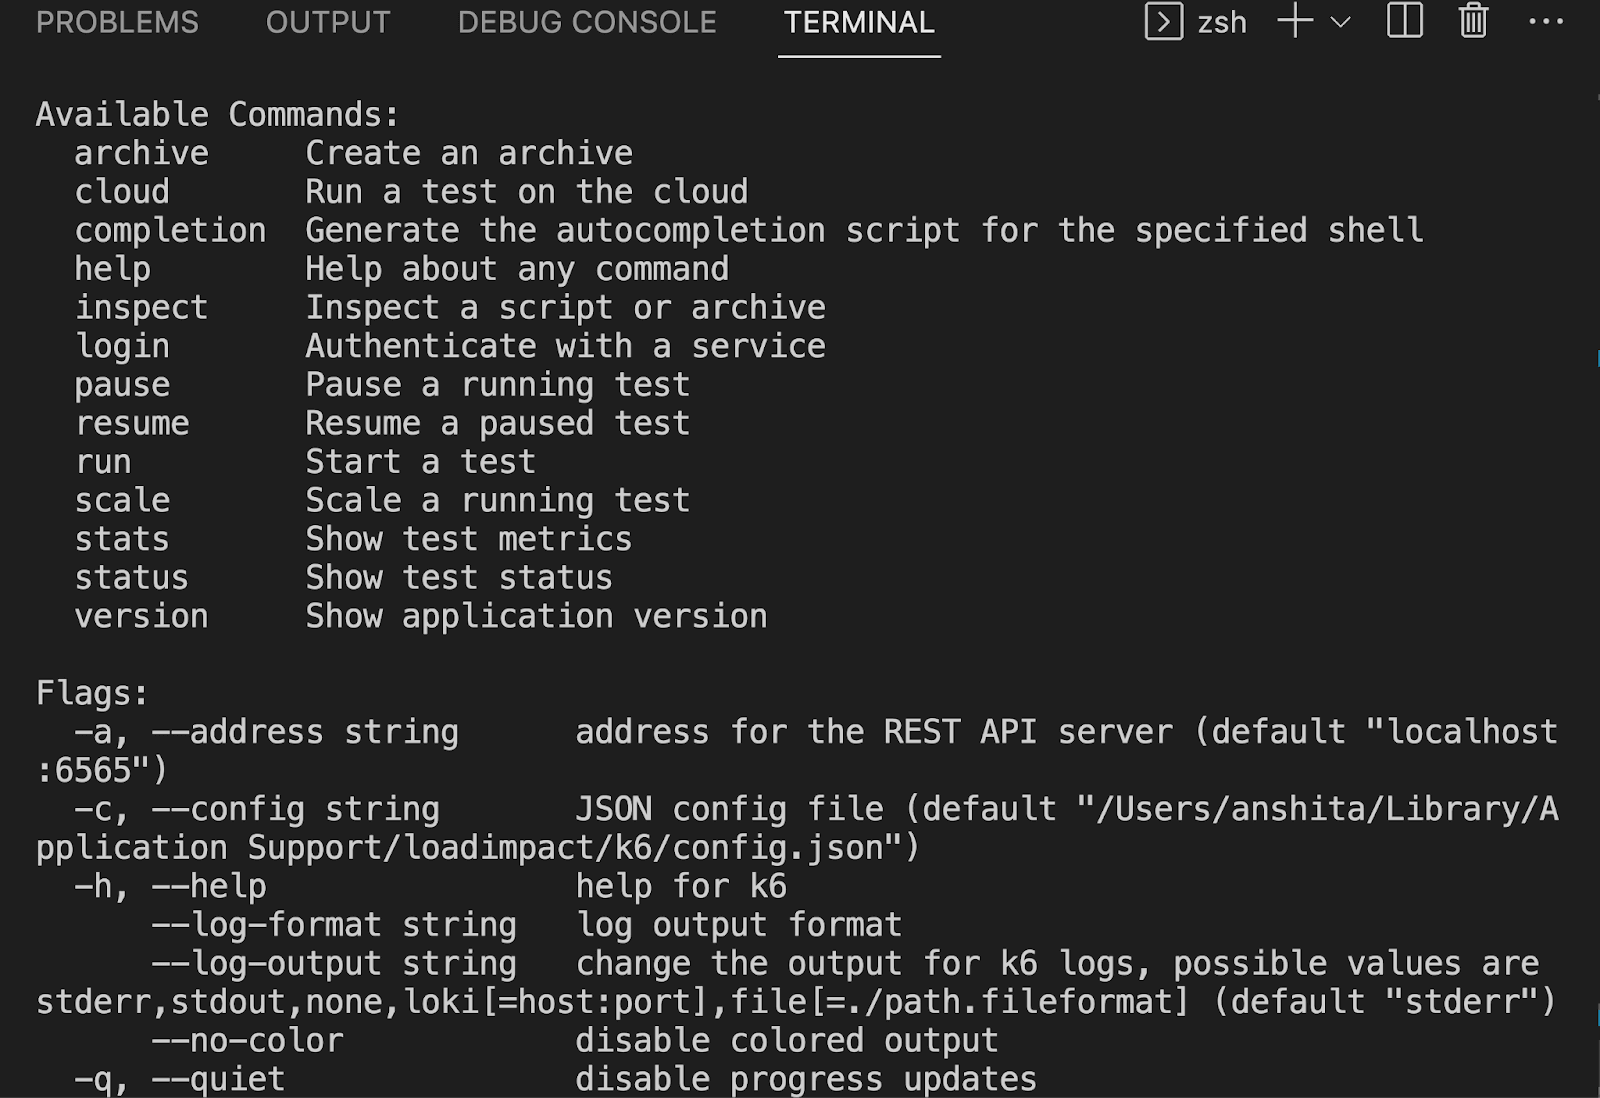
To know about all available k6 commands, enter the command k6 --help in the terminal/command prompt.
Performing Load Testing on browsers using k6
Browser testing is a valuable approach to evaluate performance at the browser level and assess user experience. It allows you to discover issues that might remain unnoticed if you only conduct testing at the backend level.

In addition to the API load testing, k6 can also run browser tests. This valuable approach enables the evaluation of performance at the browser level and provides insights into the user experience. By incorporating browser testing into your testing strategy, you can uncover potential issues that may go unnoticed if testing is solely conducted at the backend level.
Below are the key benefits of doing performance testing on browsers.
- Understanding Frontend Impact
Browser testing aids in evaluating the responsiveness of the front end of your application by simulating numerous concurrent requests from APIs. It provides insights into how the user interface performs under high-load conditions.
- Measuring Page Load Time
Browser-level testing allows you to gather metrics specific to browsers, such as the Total Page Load Time, Time to Interaction (TTI), and Speed Index. This information helps you evaluate the speed at which your web pages are rendered and identify potential bottlenecks that impact user experience.
Additionally, browser testing can incorporate the evaluation of Core Web Vitals, a set of specific metrics defined by Google to measure key aspects of user experience. These metrics include Largest Contentful Paint (LCP), which measures how long it takes for the largest element of a page to load, Interaction to Next Paint (INP), which measures how quickly a page responds to user interactions and replaced First Input Delay as a Core Web Vital in 2024, and Cumulative Layout Shift (CLS), which quantifies the visual stability of a page ensuring that elements don't unexpectedly move or shift.
By integrating Core Web Vitals into your browser testing approach with k6, you can gain a deeper understanding of how these vital performance metrics impact user experience.
- Ensuring Interactivity
The purpose of browser testing is to confirm that all elements on the front end of your application function as intended, allowing for seamless user interaction with buttons, forms, dropdowns, and other interactive components.
- Identifying Slow-loading Elements
Through browser testing, you can detect loading spinners or other elements that may take an excessive amount of time to disappear. By observing these insights, you can optimize the elements leading to improving the overall user experience. By taking proactive measures to address these issues, you can ensure a smoother and more enjoyable browsing experience for your users.
Key Takeaway: k6 browser testing measures frontend performance under load, including page load time and Core Web Vitals, and catches interactivity or slow-loading element issues that backend-only testing misses.
How to write your first k6 testing script?
By now, you must have understood why we should perform load testing on the browser. Now, it's time to write our first k6 testing script.
Prerequisite: The script uses the k6/browser module, built into k6 v0.52 and later, so no extension is needed. The module drives a local Chrome or Chromium through the Chrome DevTools Protocol.
Now, let's write a k6 testing script for the login flow, where we will perform the load testing with five virtual users and for ten iterations. In the test case, we will see both flows for the passed test case and failed test case so that when your test fails, you know what error you get in the command prompt.
Test Case
- Open URL https://ecommerce-playground.lambdatest.io/index.php?route=account/login.
- Enter the username and password in the designated input fields.
- Click on the Submit button to initiate the login process.
- After the login attempt, verify that the text My Account is displayed, indicating that the user has successfully logged in.
Implementation
Create a file named browserTest.js and paste the code below. It runs the login test case with 5 virtual users sharing 10 iterations.
import { browser } from 'k6/browser';
import { check } from 'k6';
import { htmlReport } from 'https://raw.githubusercontent.com/benc-uk/k6-reporter/2.4.0/dist/bundle.js';

export const options = {
  scenarios: {
    login: {
      executor: 'shared-iterations',
      vus: 5,
      iterations: 10,
      options: {
        browser: { type: 'chromium' },
      },
    },
  },
};

export default async function () {
  const page = await browser.newPage();

  try {
    await page.goto('https://ecommerce-playground.lambdatest.io/index.php?route=account/login');
    await page.screenshot({ path: 'screenshots/browserTestScreenshot.png' });

    await page.locator('#input-email').type('lambdatest.Cypress@disposable.com');
    await page.locator('#input-password').type('Cypress123!!');
    await Promise.all([
      page.waitForNavigation(),
      page.locator('input[value="Login"]').click(),
    ]);

    const heading = await page.locator('.breadcrumb-item.active').textContent();
    check(heading, {
      'Verify user is logged In': (text) => text === 'Account',
      'Verify the text': (text) => text === 'Test',
    });
  } finally {
    await page.close();
  }
}

export function handleSummary(data) {
  return {
    'TestSummaryReport.html': htmlReport(data),
  };
}
Folder Structure
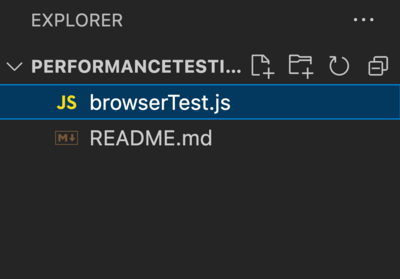
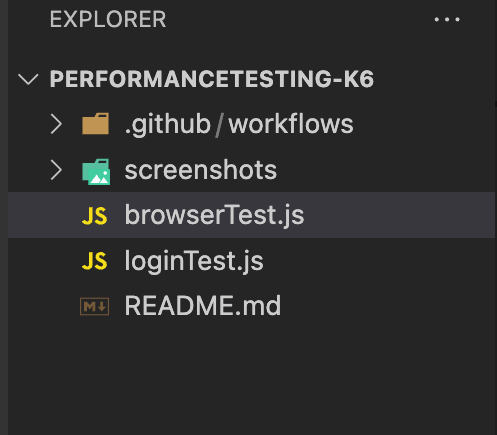
In k6, the folder structure for a test script named browserTest.js typically follows a common convention. Here's an example of a possible folder structure for the browserTest.js script:
Code Walkthrough
Step 1: Import the modules
The browser object comes from the built-in k6/browser module, check comes from k6 for assertions, and htmlReport builds the HTML report covered in the next section.
import { browser } from 'k6/browser';
import { check } from 'k6';
Step 2: Configure the scenario
Browser tests run inside a scenario. The shared-iterations executor splits 10 iterations across 5 virtual users, so the script runs 10 times in total, not 10 times per user.
scenarios: {
  login: {
    executor: 'shared-iterations',
    vus: 5,
    iterations: 10,
    options: {
      browser: { type: 'chromium' },
    },
  },
},
The browser.type option is required. Without it, k6 does not start a browser for the scenario.
Step 3: Open a page
Each iteration opens a new page with browser.newPage(). The finally block closes the page even when a step throws, so failed iterations do not leak browser tabs.
const page = await browser.newPage();

try {
  // test steps
} finally {
  await page.close();
}
Step 4: Navigate and log in
Browser methods in k6 are asynchronous, so each call is awaited. The screenshot saves the login page to the screenshots folder. Promise.all() starts waiting for navigation before the click, which avoids missing a fast page load.
await page.goto('https://ecommerce-playground.lambdatest.io/index.php?route=account/login');
await page.screenshot({ path: 'screenshots/browserTestScreenshot.png' });
await page.locator('#input-email').type('lambdatest.Cypress@disposable.com');
await page.locator('#input-password').type('Cypress123!!');
await Promise.all([
  page.waitForNavigation(),
  page.locator('input[value="Login"]').click(),
]);
Step 5: Verify the result with checks
The script reads the breadcrumb text once, then runs two checks against it. The first expects Account and passes. The second expects Test and fails on purpose, to show how a failure appears.
const heading = await page.locator('.breadcrumb-item.active').textContent();
check(heading, {
  'Verify user is logged In': (text) => text === 'Account',
  'Verify the text': (text) => text === 'Test',
});
A failed check does not stop the test. k6 records the result and moves on, which is why load tests use checks instead of hard assertions.
Execution
From the folder that contains the script, run:
k6 run browserTest.jsBrowser tests run headless by default. To watch the browser while the test runs, set K6_BROWSER_HEADLESS to false:
# macOS or Linux
K6_BROWSER_HEADLESS=false k6 run browserTest.js

# Windows PowerShell
$env:K6_BROWSER_HEADLESS="false"; k6 run browserTest.js
The same k6 run command runs API load tests too. Only scripts that import k6/browser start a browser.
Terminal
A run of this script on k6 v2.2.0 printed the summary below. Your timings will differ, but the check counts will match:
checks_total.......: 20     0.787076/s
checks_succeeded...: 50.00% 10 out of 20
checks_failed......: 50.00% 10 out of 20

✓ Verify user is logged In
✗ Verify the text
  ↳  0% - ✓ 0 / ✗ 10

iterations..................: 10     0.393538/s
vus_max.....................: 5      min=5        max=5

browser_http_req_failed.....: 0.00%  0 out of 327
browser_web_vital_fcp.......: avg=2.49s    min=2.1s     med=2.46s    max=2.8s
browser_web_vital_lcp.......: avg=2.52s    min=2.1s     med=2.53s    max=2.8s
browser_web_vital_ttfb......: avg=1.27s    min=1.05s    med=1.24s    max=1.54s
Ten iterations with two checks each produce 20 check results: all 10 login checks pass and all 10 deliberate failures fail. The browser metrics also report Core Web Vitals for every page load.
Executing reporting on a local machine
Reporting is an essential aspect of testing as it provides a summary of the test results with a visual representation of test data, such as graphs and charts. It is also a means of communication and collaboration among team members.
You can share test reports with your team members or your management and discuss the performance issues, if there are any, based on the report. Adding reporting enhances your ability to analyze, communicate, and optimize the performance of your application.
In k6, you can get the HTML Report using k6 HTML Report Exporter v2, which generates a file containing the test summary data of the test after your test execution is completed.
Implementation
Step 1: Import htmlReport
Import the htmlReport function from the k6-reporter bundle. Pin a release tag, such as 2.4.0, instead of main so a new release cannot change the report unexpectedly.
import { htmlReport } from 'https://raw.githubusercontent.com/benc-uk/k6-reporter/2.4.0/dist/bundle.js';Step 2: Export handleSummary
Add a handleSummary function outside the default function. k6 calls it once at the end of the test and writes each returned key as a file.
export function handleSummary(data) {
  return {
    'TestSummaryReport.html': htmlReport(data),
  };
}
The browserTest.js script above already includes both pieces.
Code Walkthrough
The data argument holds every metric and check result from the run. htmlReport(data) turns that data into a single HTML page, and the key TestSummaryReport.html sets the file name.
Returning a file from handleSummary replaces the default terminal summary. To keep both, also return a stdout key built with the textSummary helper from the k6 jslib.
Execution
Run the test with the same command:
k6 run browserTest.jsOnce your test is executed completely (pass or fail), a report will be generated at the root level of your project with the name passed in the test script. In this case, the report would be saved by the name TestSummaryReport.html.
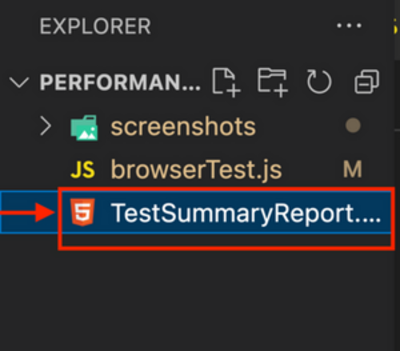
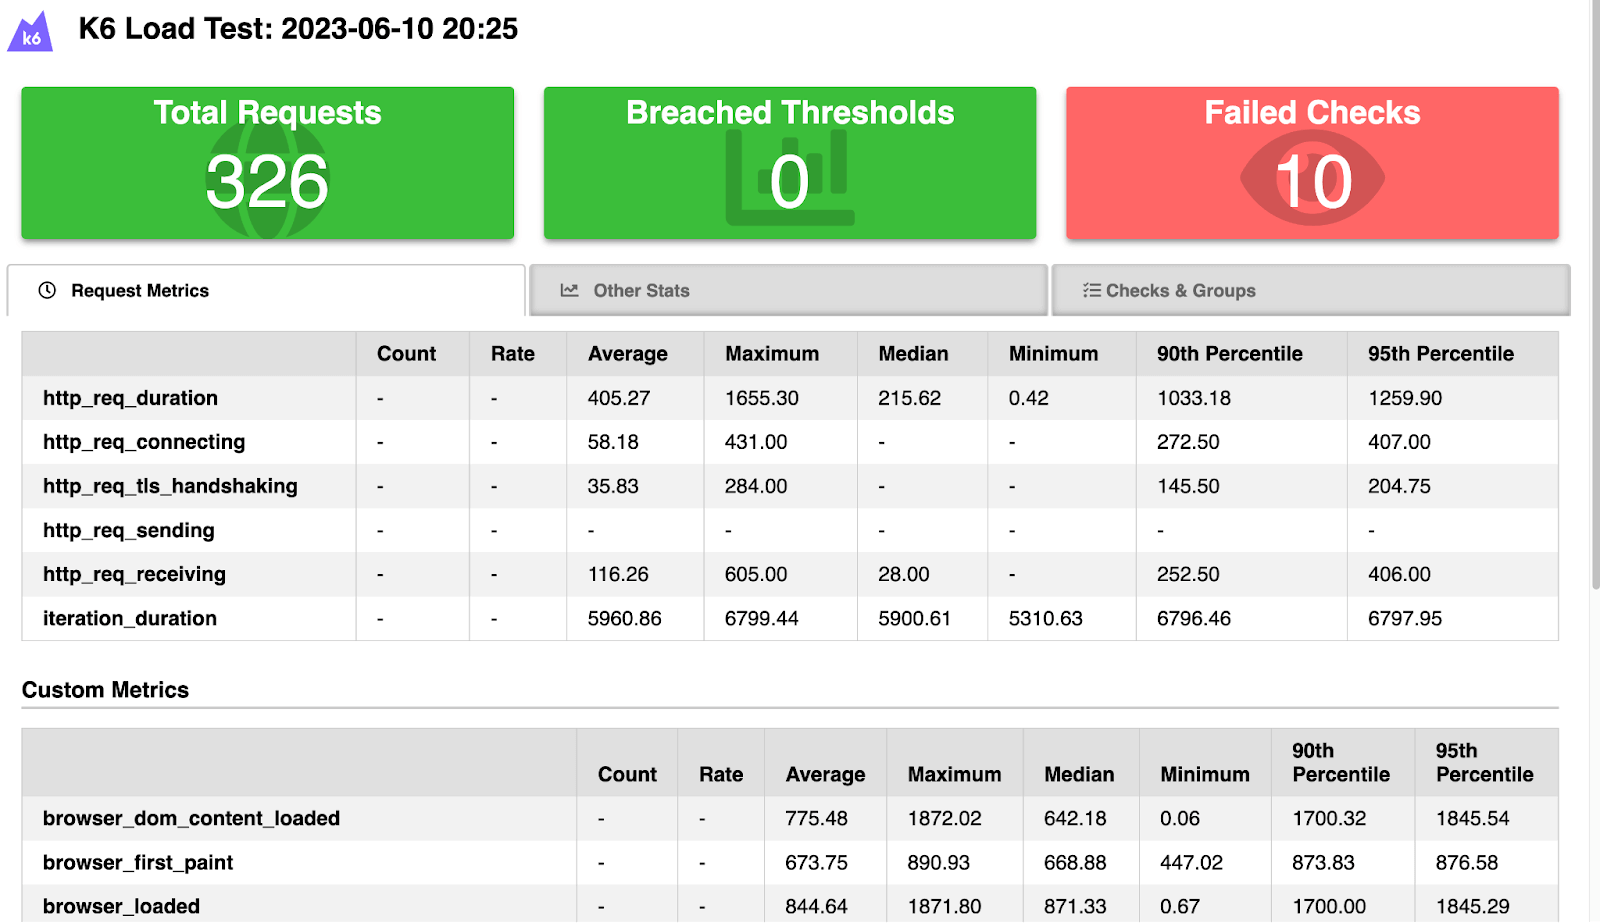
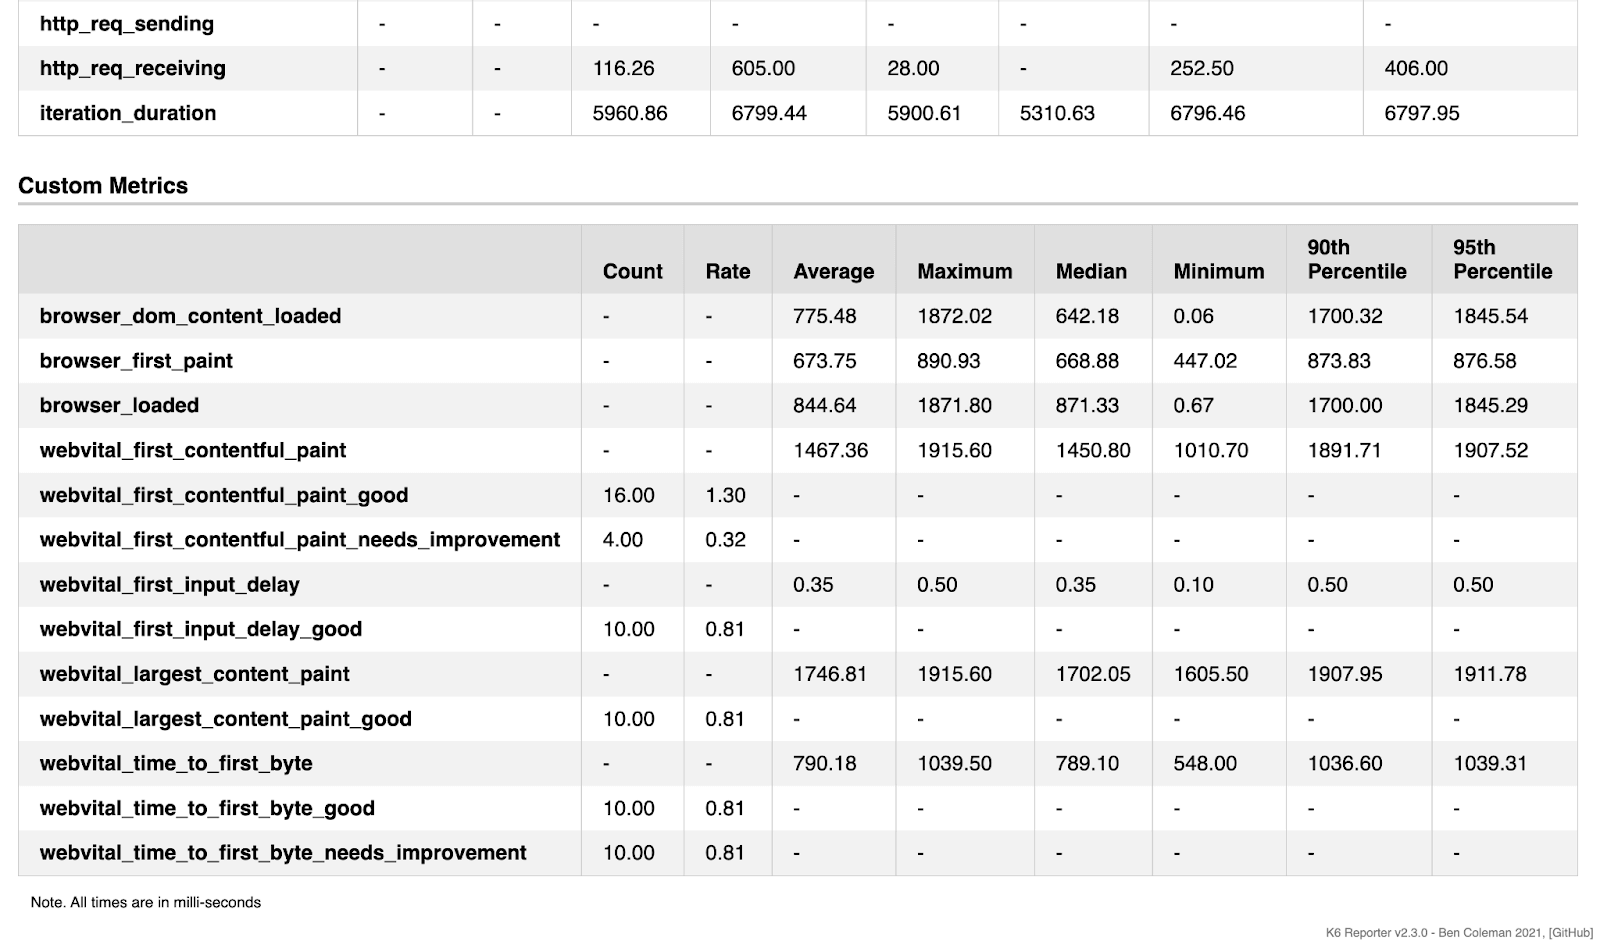
The report would look something like below. It has three tabs.
The first tab is Request Metrics, where you can view the HTTP requests and their 90 and 95 percentile.
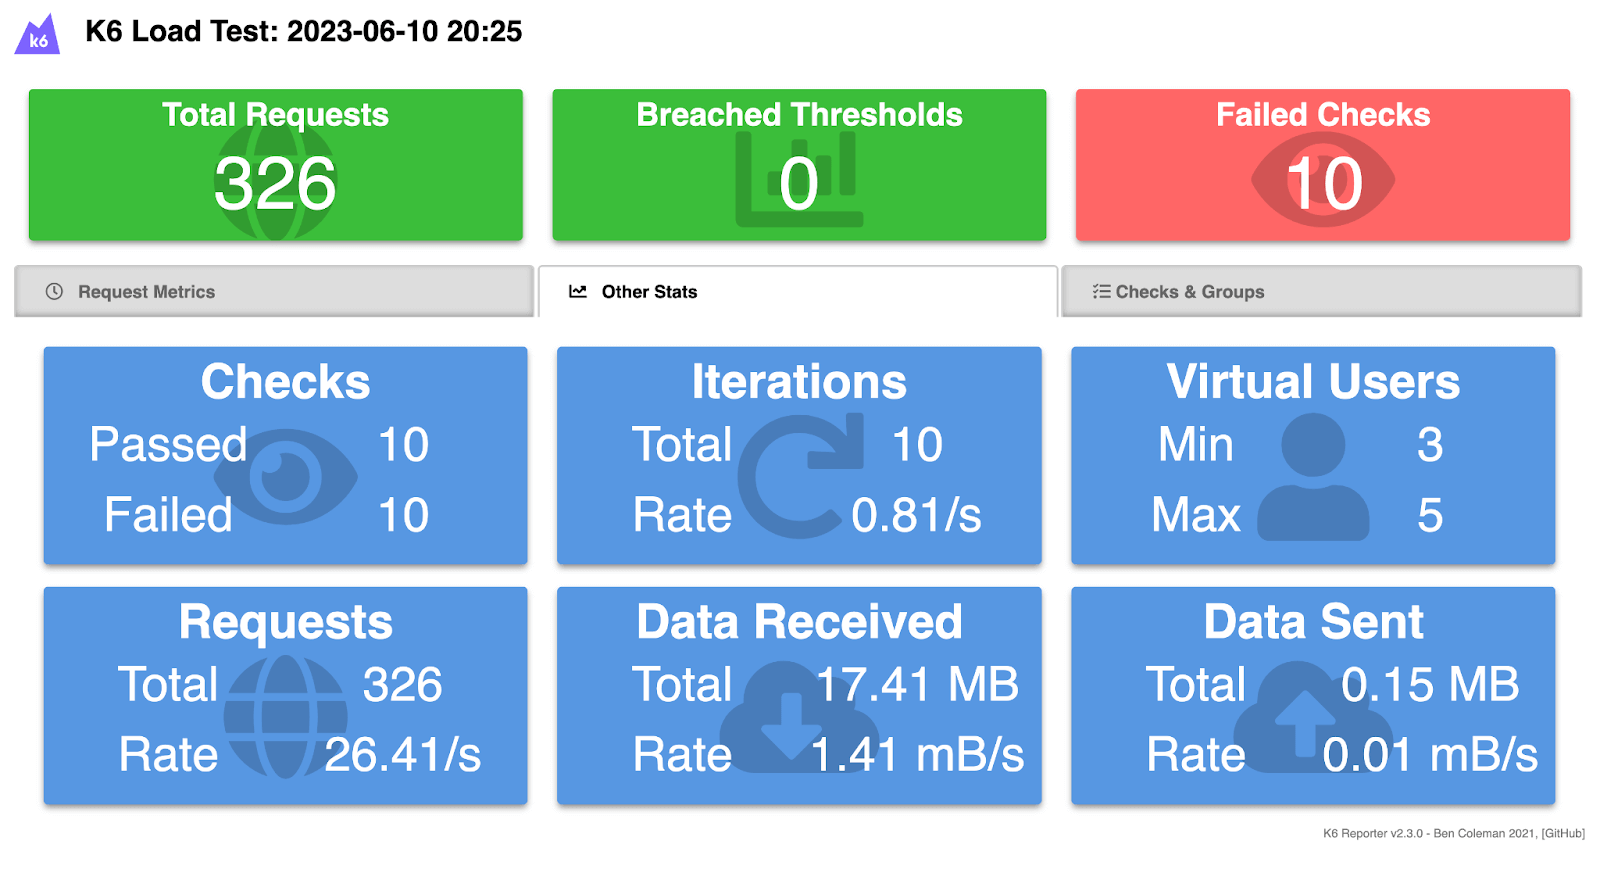
The second tab is Other Stats, which shows all the information with requests to how many iterations were made, how many virtual users were passed, and how many checks (or assertions) got executed.
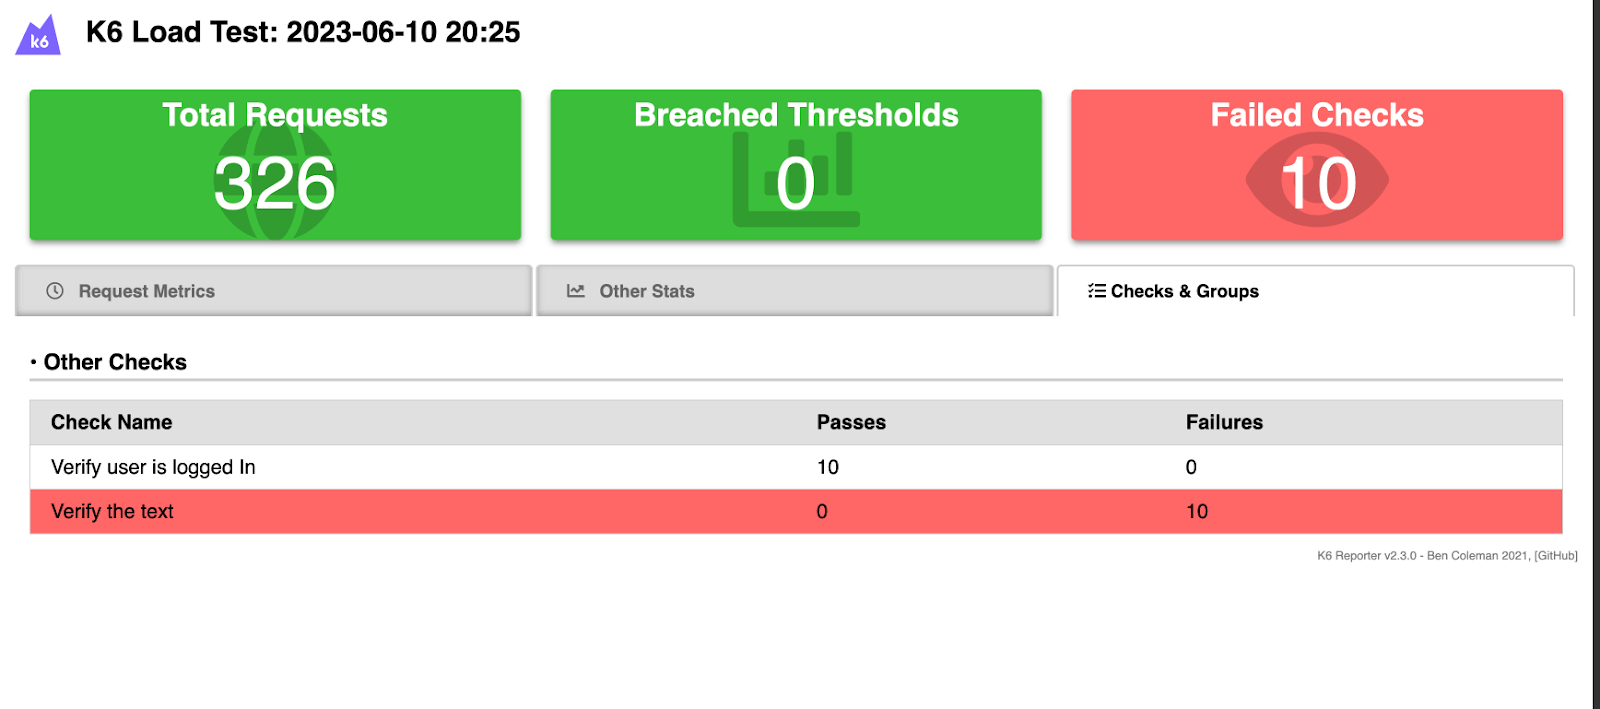
The last tab is Checks & Groups. It displays the information only related to checks/assertions present in the test. In the given example, there are two checks: one verifies if the user is logged in, and the other verifies the displayed text.
The example includes both a passing and a failing check, so the tab shows 20 check results: 10 passes for the login check and 10 failures for the deliberate one.
Below is the screenshot of the HTML Report displaying one check as passed and the other as failed.
How to perform k6 testing on the cloud?
While k6 offers an array of powerful features, performing k6 browser testing on the cloud with a digital experience testing platform like TestMu AI gives you the advantage of seamless browser and OS version management. You can easily examine every step of the test run with comprehensive logs.
As a tester, one of your key responsibilities is to ensure that your web application remains stable and functional even under heavy user loads across different browser and operating system versions. And this issue can be resolved by integrating k6 with a cloud platform where porting effort is minimal, and benefits are much more in the way that you get recordings and detailed logs of each test execution.
Let's configure the test case and understand it with a real example.
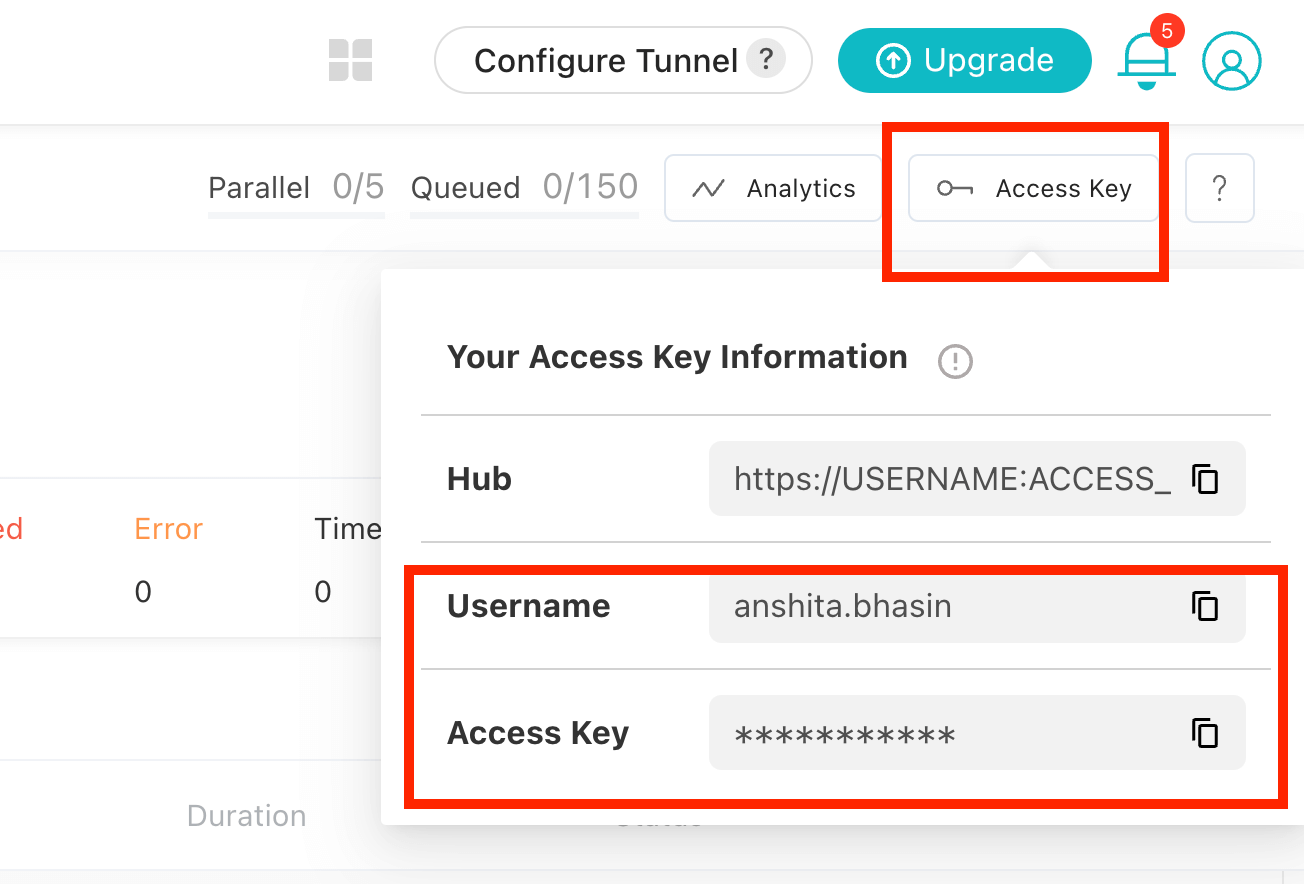
To perform k6 testing on TestMu AI, you need to set your TestMu AI username and access key in the environment variables. Click the Access Key button at the top-right of the Automation Dashboard to access it.
Windows
set LT_USERNAME=LT_USERNAME
set LT_ACCESS_KEY=LT_ACCESS_KEY
macOS/Linux
export LT_USERNAME=LT_USERNAME
export LT_ACCESS_KEY=LT_ACCESS_KEY
With the credentials set, reuse the login test from the previous section.
Test Scenario
Run the login flow with 3 virtual users sharing 4 iterations on Chrome (latest) on Windows 11, then repeat the run on macOS.
- Open URL https://ecommerce-playground.lambdatest.io/index.php?route=account/login.
- Enter the username and password in the designated input fields.
- Click on the Submit button to initiate the login process.
- After the login attempt, verify that the text My Account is displayed, indicating that the user has successfully logged in.
Implementation
Save the script below as cloudTest.js. The test logic is identical to browserTest.js. Only the load settings and the report name change.
import { browser } from 'k6/browser';
import { check } from 'k6';
import { htmlReport } from 'https://raw.githubusercontent.com/benc-uk/k6-reporter/2.4.0/dist/bundle.js';

export const options = {
  scenarios: {
    login: {
      executor: 'shared-iterations',
      vus: 3,
      iterations: 4,
      options: {
        browser: { type: 'chromium' },
      },
    },
  },
};

export default async function () {
  const page = await browser.newPage();

  try {
    await page.goto('https://ecommerce-playground.lambdatest.io/index.php?route=account/login');
    await page.screenshot({ path: 'screenshots/browserTestScreenshot.png' });

    await page.locator('#input-email').type('lambdatest.Cypress@disposable.com');
    await page.locator('#input-password').type('Cypress123!!');
    await Promise.all([
      page.waitForNavigation(),
      page.locator('input[value="Login"]').click(),
    ]);

    const heading = await page.locator('.breadcrumb-item.active').textContent();
    check(heading, {
      'Verify user is logged In': (text) => text === 'Account',
      'Verify the text': (text) => text === 'Test',
    });
  } finally {
    await page.close();
  }
}

export function handleSummary(data) {
  return {
    'TestReport.html': htmlReport(data),
  };
}
Code Walkthrough
The script itself contains no cloud settings. Current k6 connects to a remote browser when the K6_BROWSER_WS_URL environment variable holds a WebSocket URL, so the connection lives outside the code.
For TestMu AI, that URL is the k6 endpoint with your capabilities appended as URL-encoded JSON. The capabilities choose the browser, platform, build name, and session logs:
{
  "browserName": "Chrome",
  "browserVersion": "latest",
  "LT:Options": {
    "platform": "Windows 11",
    "build": "k6 Build",
    "name": "k6 login test",
    "user": "<your username>",
    "accessKey": "<your access key>",
    "video": true,
    "console": true,
    "network": true
  }
}
Keeping the connection in an environment variable means the same script runs locally and on the cloud without edits.
Execution
Build the WebSocket URL from your credentials, then run the script. The commands below run in Bash on macOS or Linux, or in Git Bash on Windows, and need Node.js for the URL encoding:
CAPS='{"browserName":"Chrome","browserVersion":"latest","LT:Options":{"platform":"Windows 11","build":"k6 Build","name":"k6 login test","user":"'"$LT_USERNAME"'","accessKey":"'"$LT_ACCESS_KEY"'","video":true,"console":true,"network":true}}'

export K6_BROWSER_WS_URL="wss://cdp.lambdatest.com/k6?capabilities=$(node -p 'encodeURIComponent(process.argv[1])' "$CAPS")"

k6 run cloudTest.js
To cover the second configuration, change platform to macOS Sequoia in the capabilities and run the same commands again.
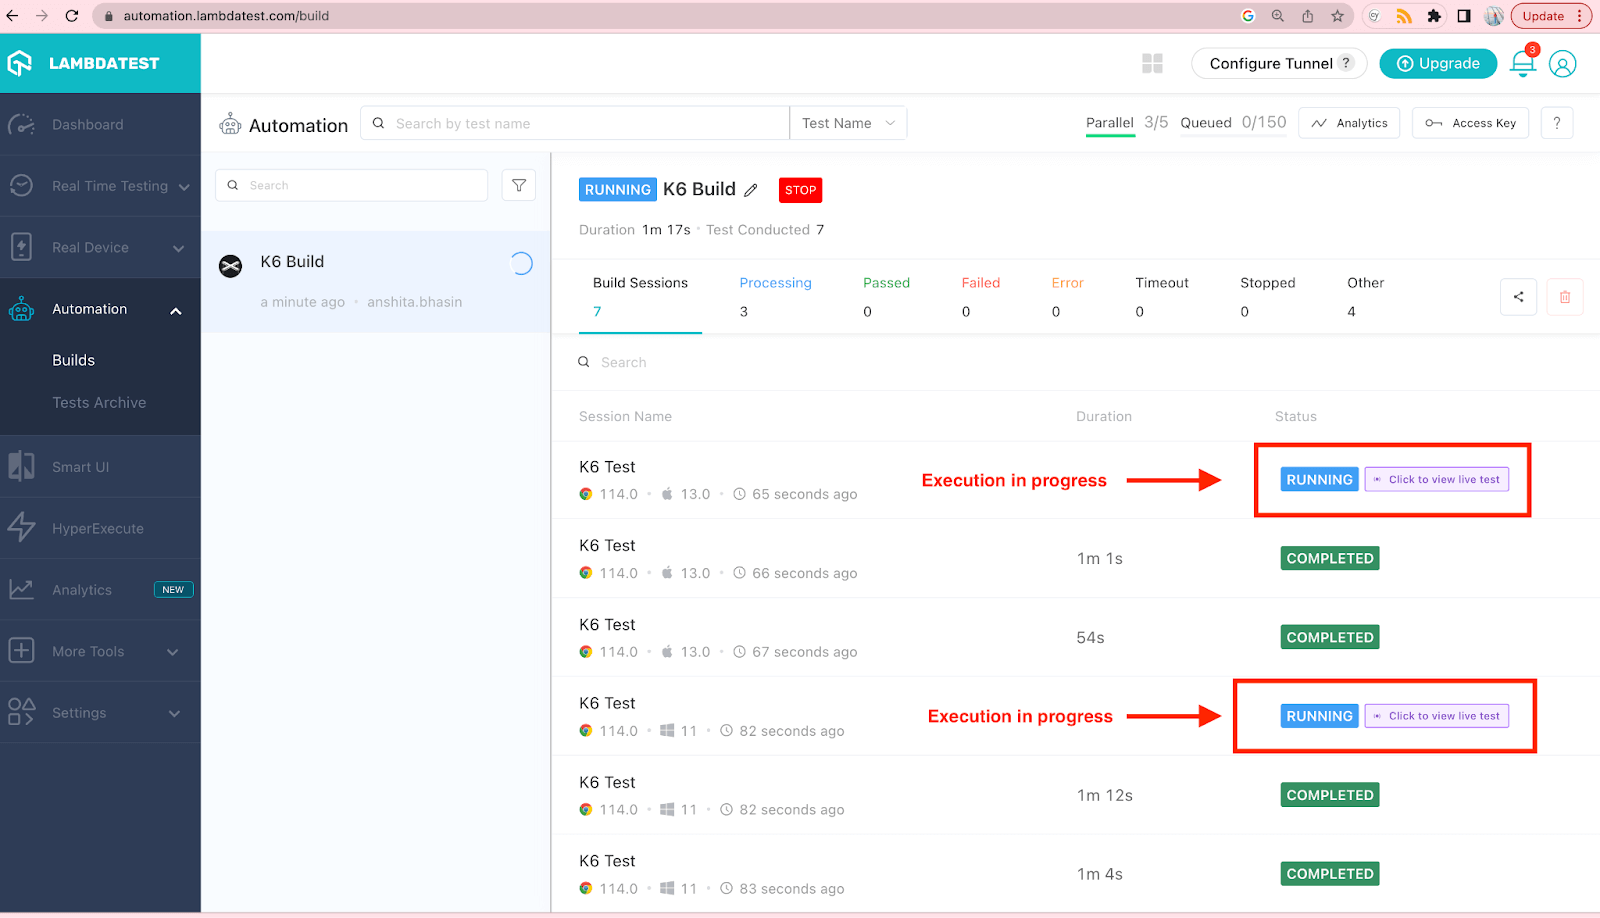
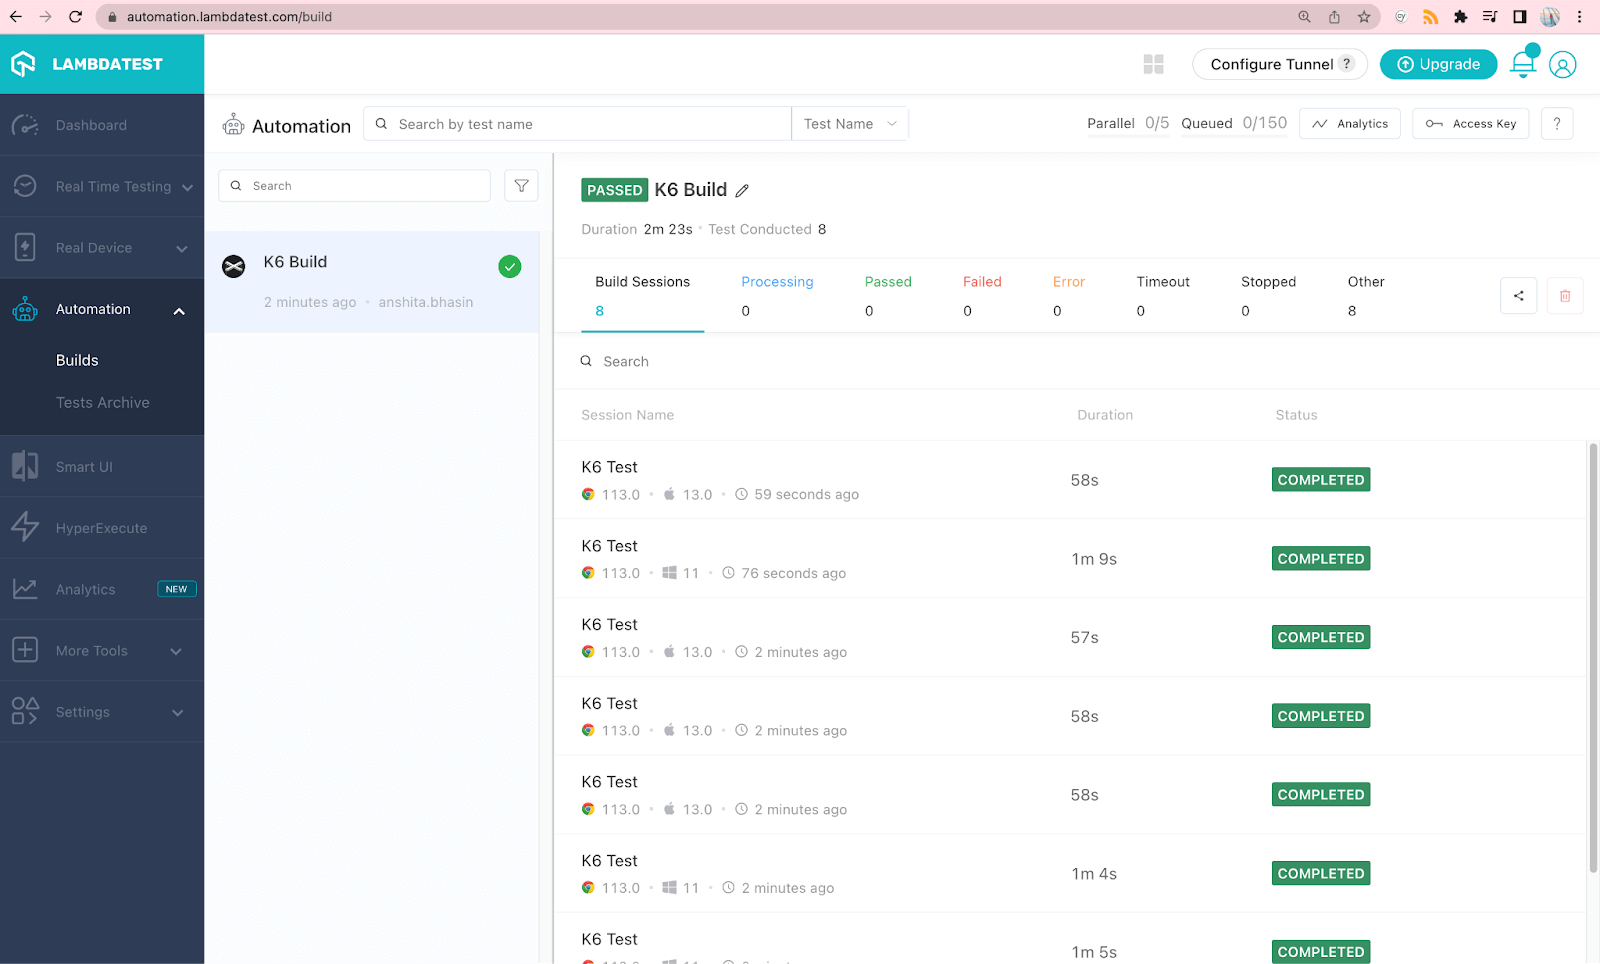
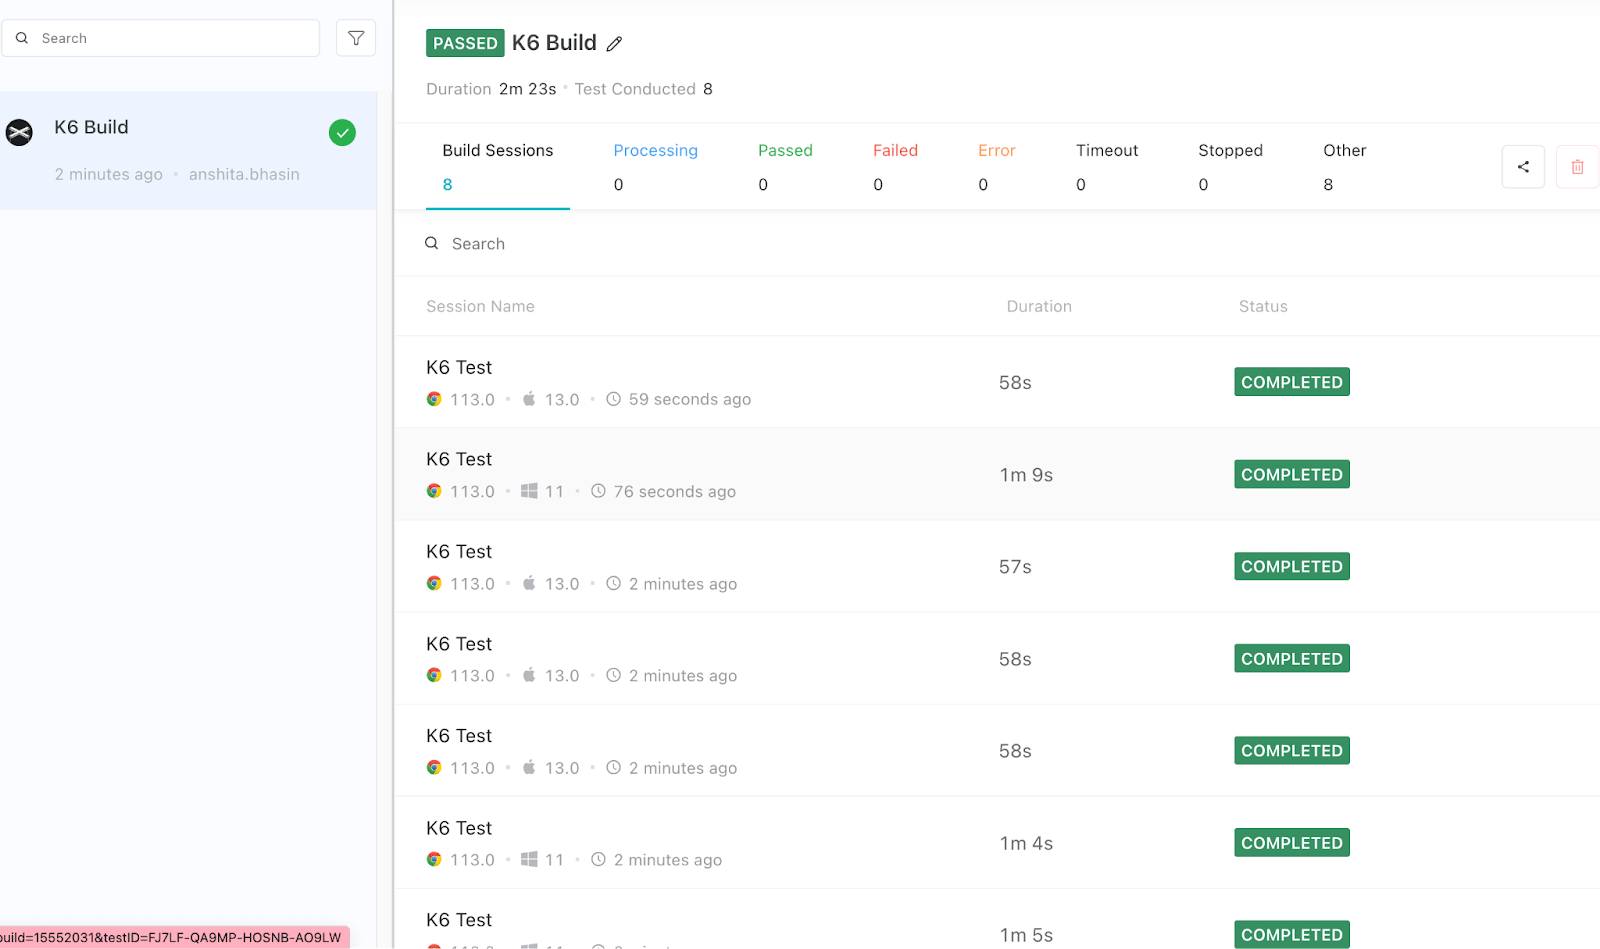
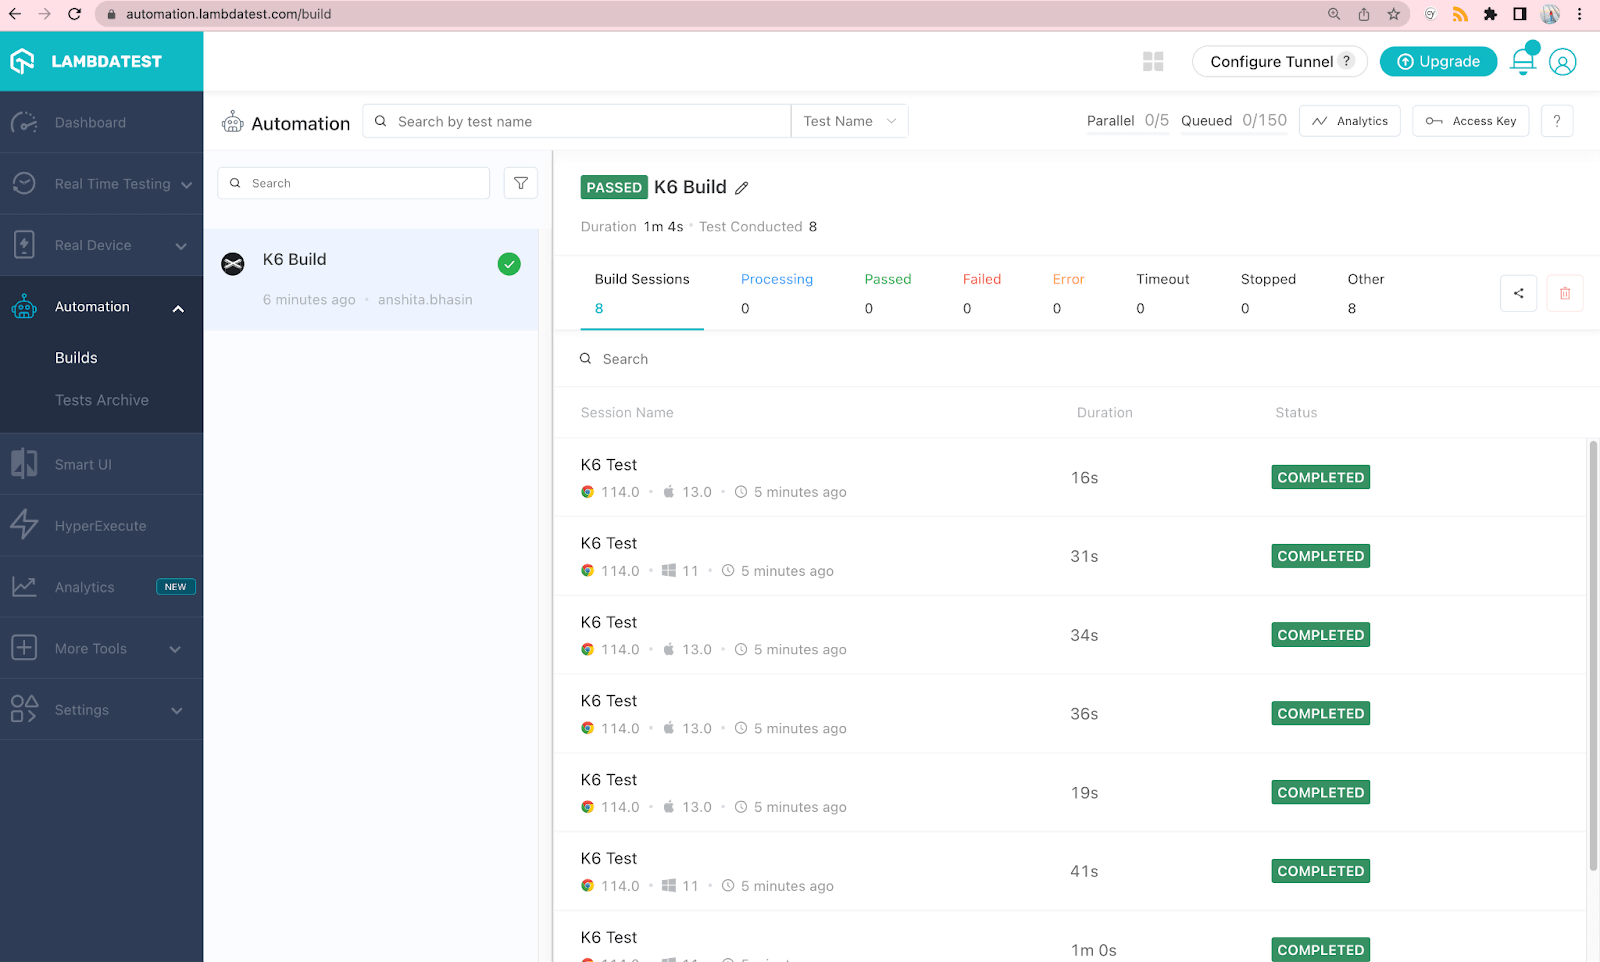
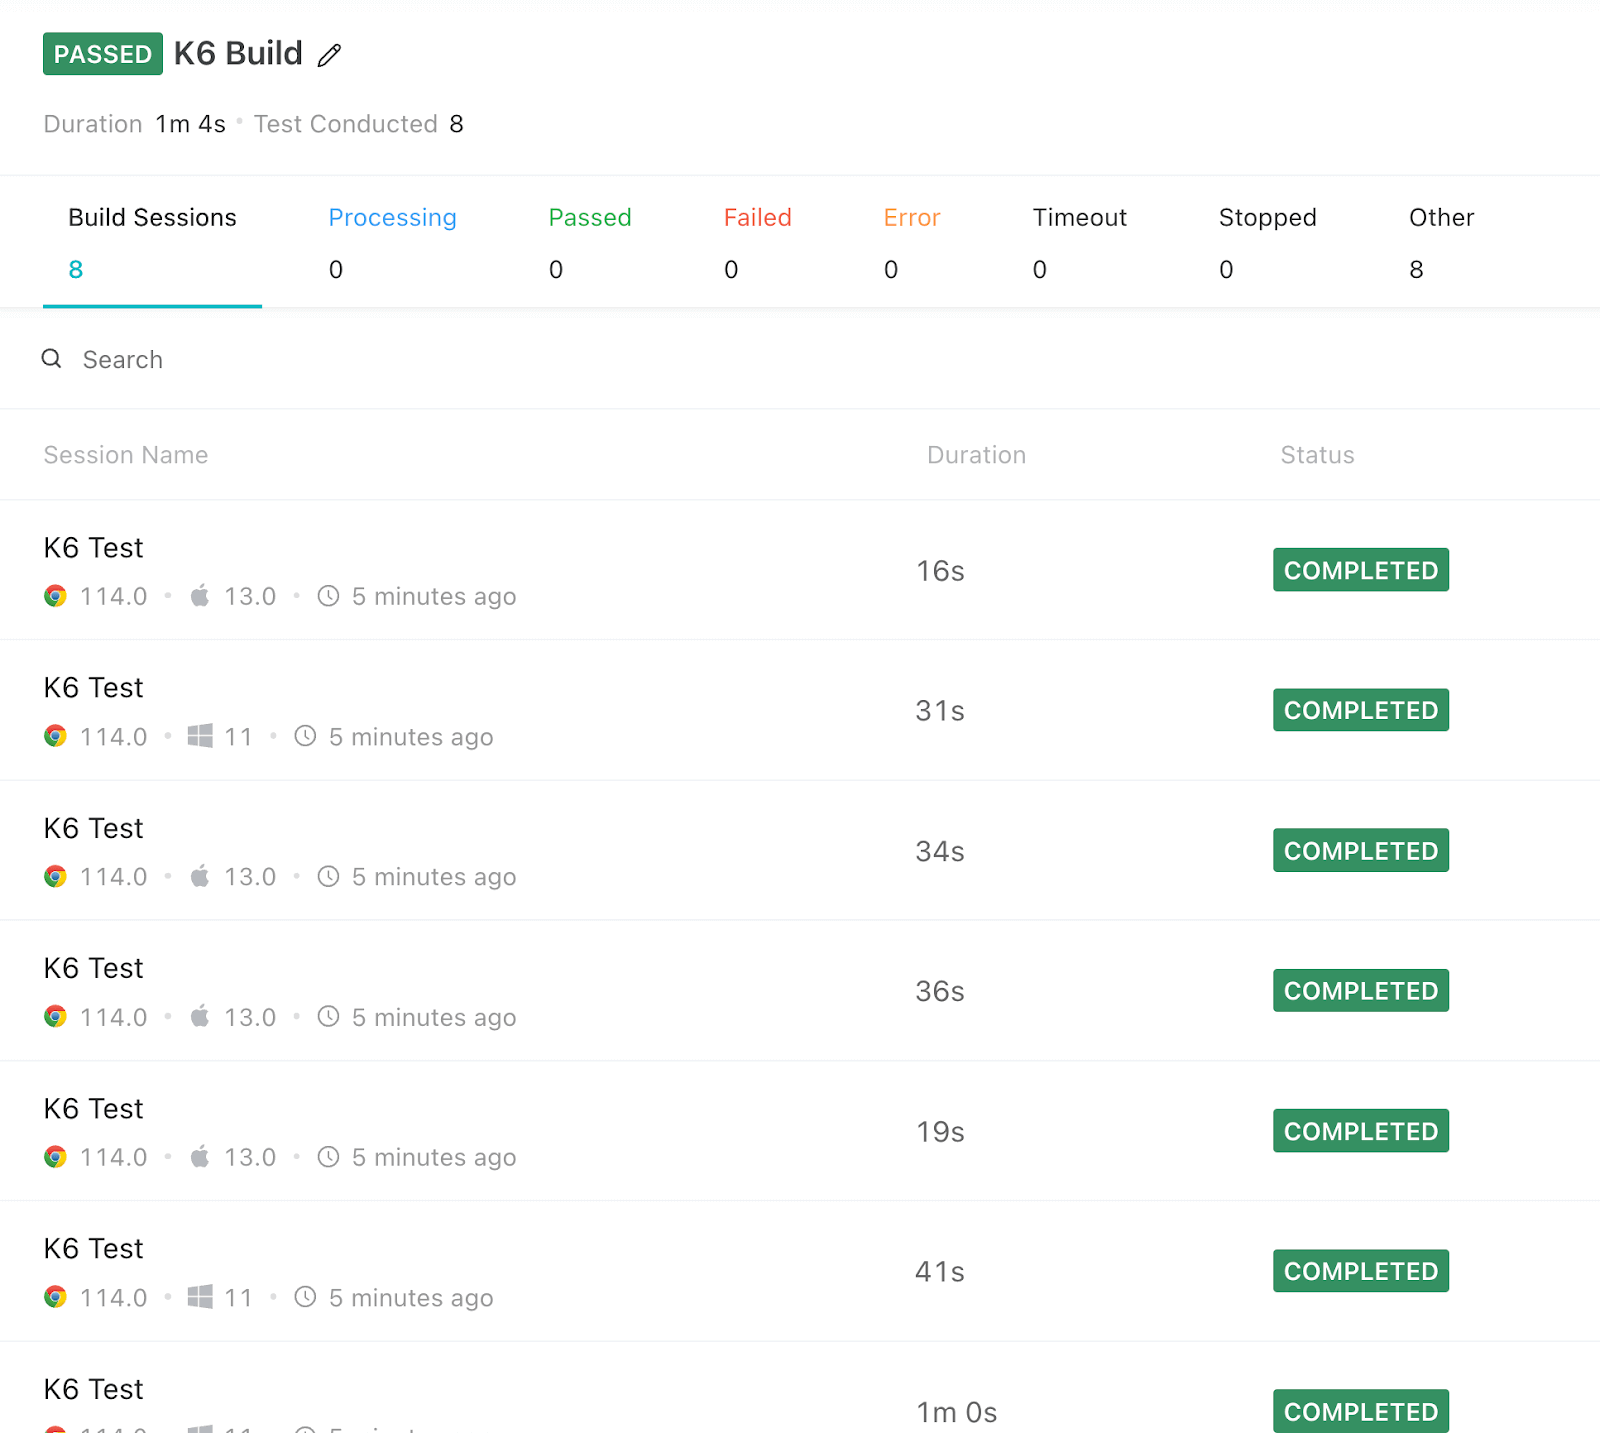
After running the command, you can view the test run on TestMu AI Dashboard (just like shown in the screenshot below).
Execution in Progress
Completion of Execution
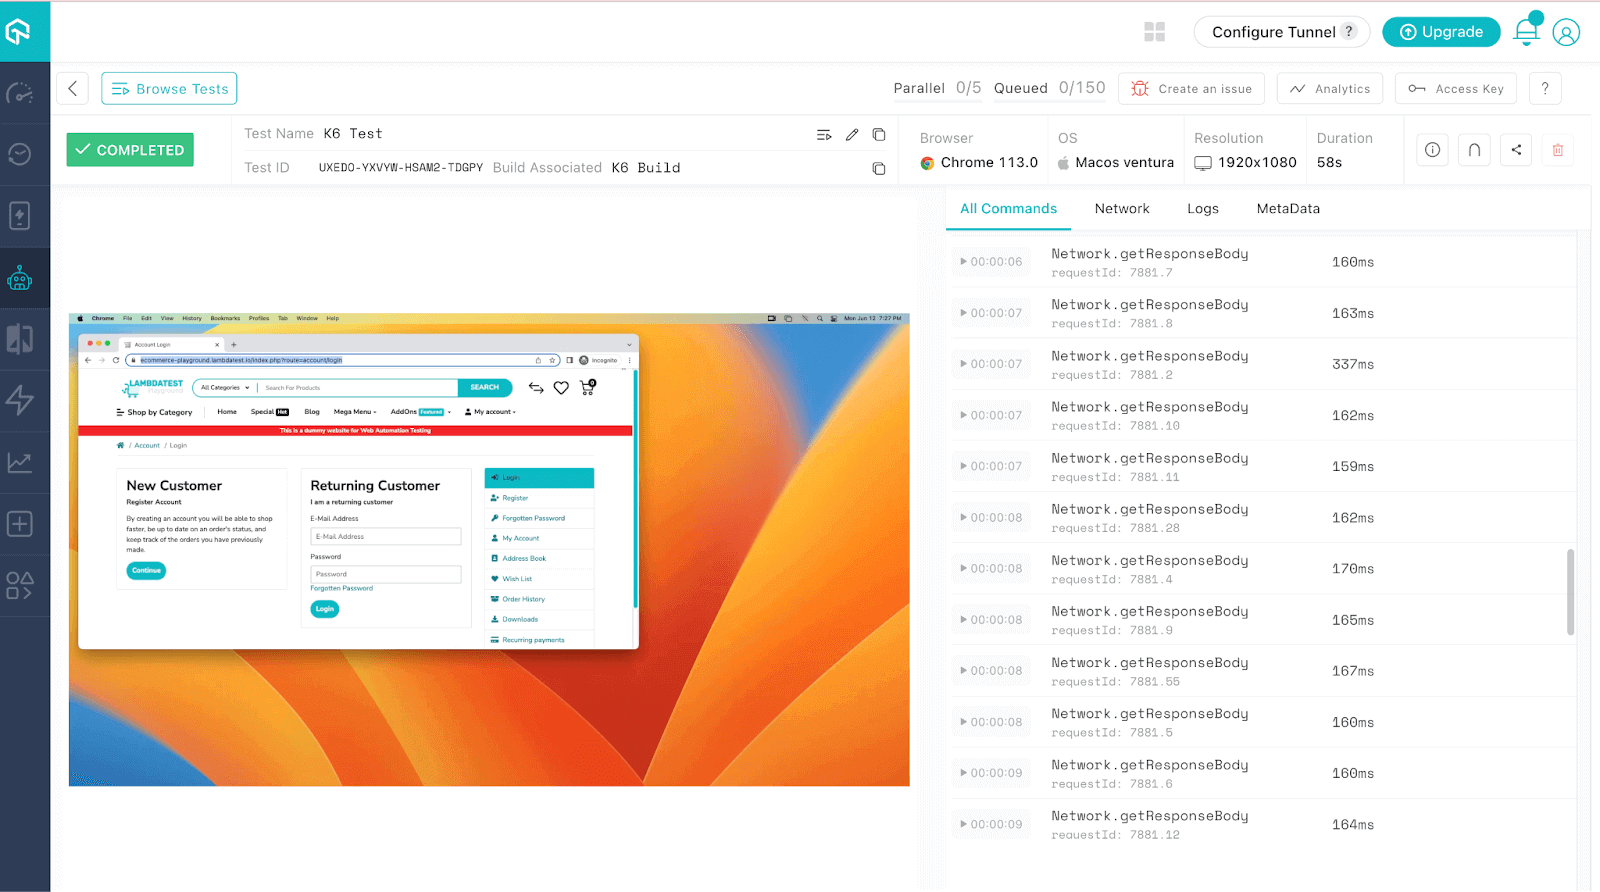
You can also view the logs by clicking the session name of the respective test, just like shown below.
Reporting
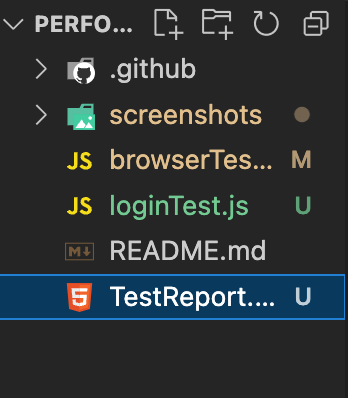
Once you perform k6 testing on a cloud platform, the generated report will be saved in your project's folder with the specified name mentioned in the code. To locate the report, you need to check the folder and search for the name specified within the handleSummary() function.
In the given example, the report name specified is TestReport.html. Therefore, you should look for a file named TestReport.html within your project's folder to find the generated report.
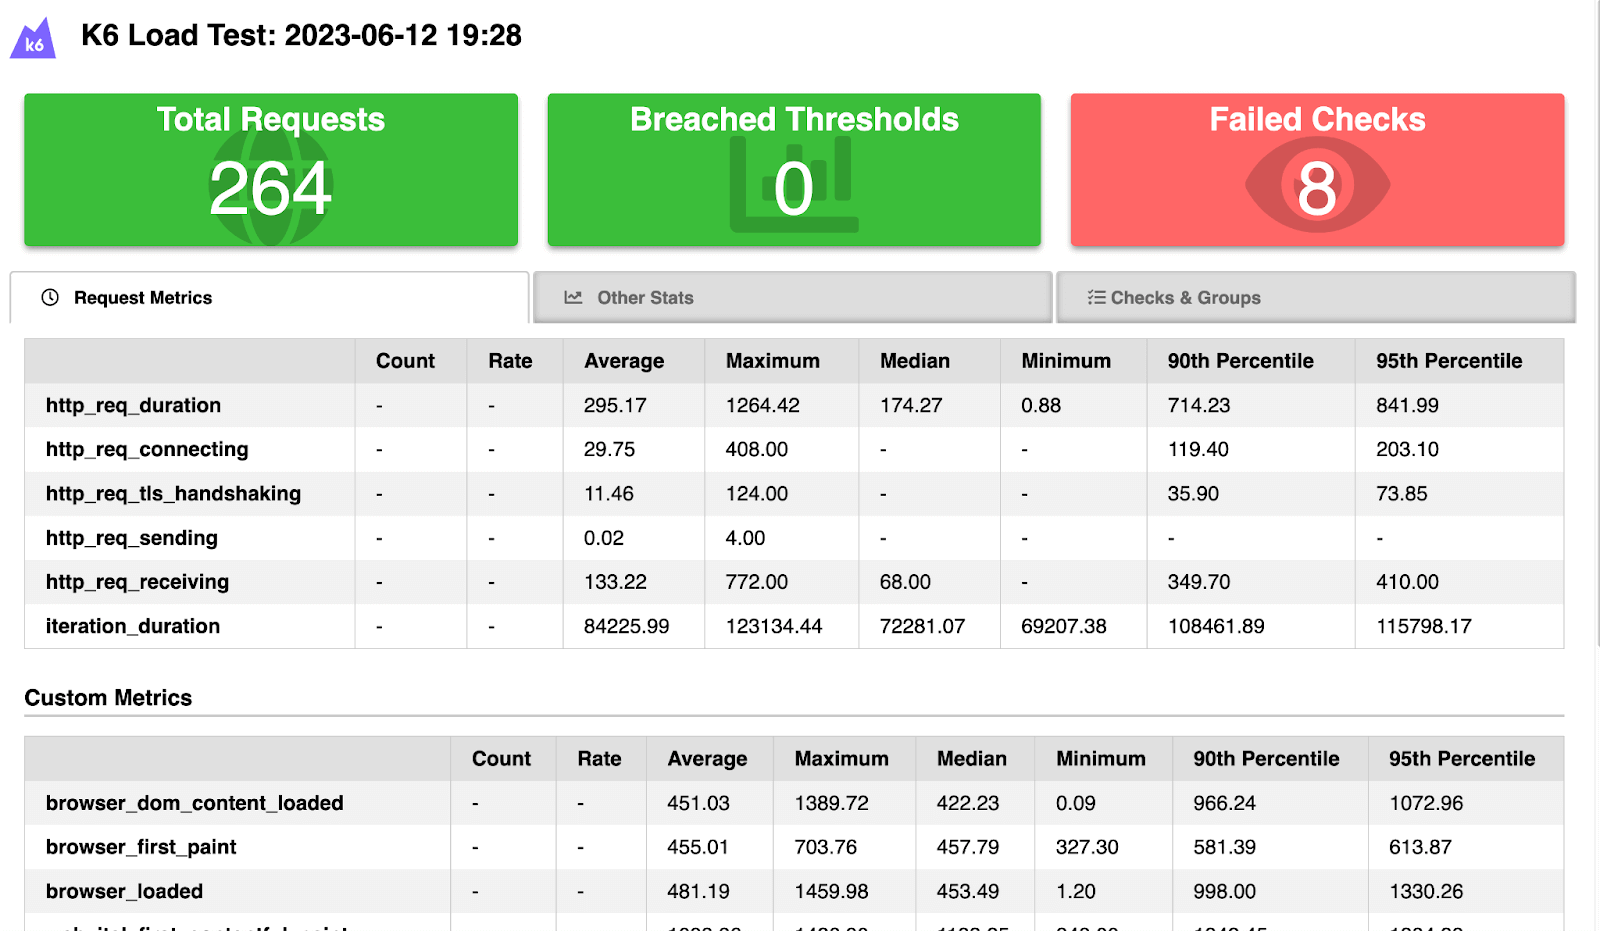
Next, open the report in your browser, and you will observe that the report appears similar to the example below, featuring three tabs. The first tab, named Request Metrics, allows you to examine all the HTTP requests that were made.
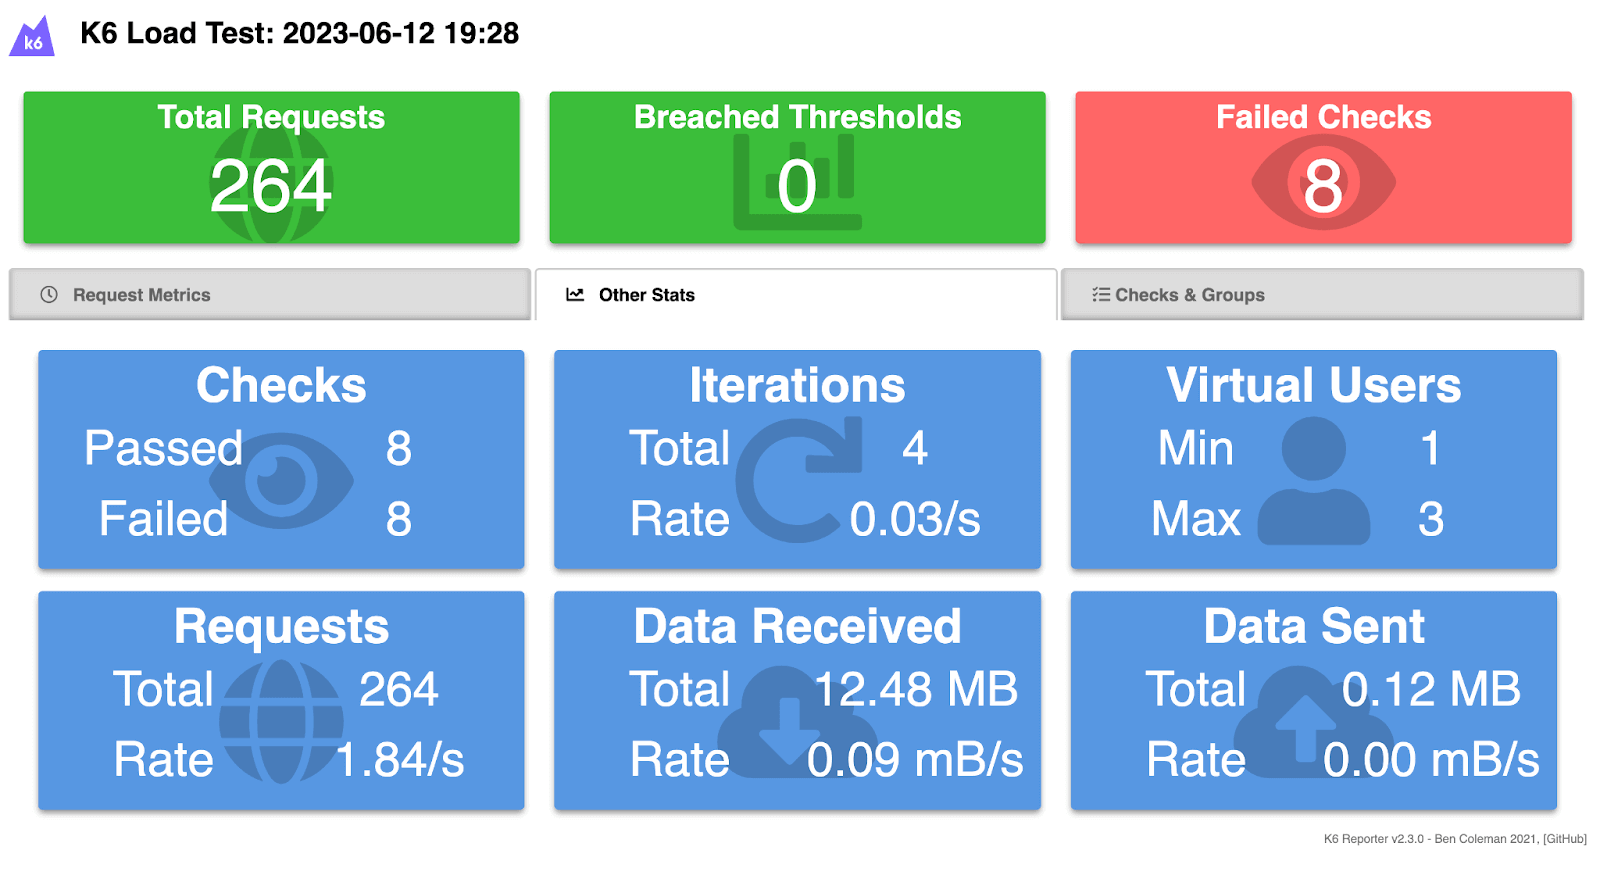
The second tab is labeled Other Stats and provides comprehensive information regarding the test execution. It displays details such as the number of iterations performed, the count of virtual users involved in the test, and the total number of checks or assertions executed. This tab offers a holistic view of the test's overall performance and validation metrics.
In the screenshot below, the total number of iterations is 4 and the count of virtual users is 3, matching the settings in cloudTest.js.
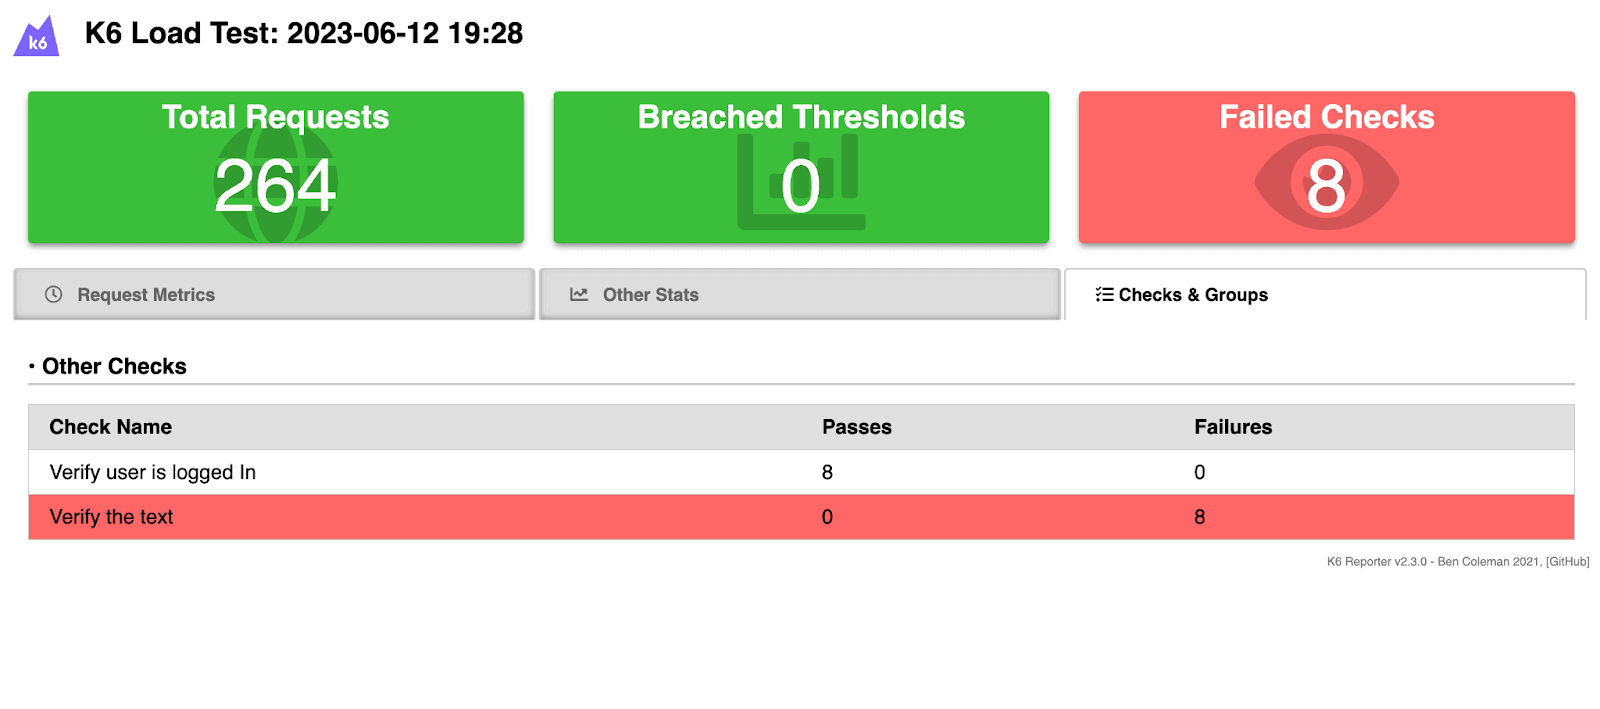
The final tab, labeled Checks & Groups, presents information related to checks or assertions. In the screenshot below, you can observe that two checks are displayed that match the count of checks passed in the test. Of these checks, one has passed, while the other has failed.
Each run executes two checks per iteration, so 4 iterations produce 8 check results for each platform you run.
As mentioned earlier in the test, there are two checks: one that has passed and another intentionally designed to fail. This deliberate failure allows us to examine the behavior and capture the details of a failed test case as well.
Performing k6 testing on CI/CD: GitHub Actions
The core principle of Continuous Integration (CI) and Continuous Delivery (CD) is to ensure that the integration of changes into your application does not introduce new bugs or disrupt existing functionalities. And to simplify this process of incorporating performance testing into your CI/CD pipelines. k6 provides seamless integration with various CI/CD tools such as Jenkins and GitHub Actions.
As part of this k6 testing tutorial, we will learn k6 integration with GitHub Actions. GitHub Actions is a Continuous Integration (build, test, merge) and Continuous Delivery (automatically released to the repository) (CI/CD) platform. It automates and executes various workflows, including building, testing, and merging code changes.
GitHub Actions uses workflows defined in .yml files placed under the .github/workflows directory in your GitHub Repository. These workflows define the automated processes triggered by specific events, such as creating a pull request or pushing code to a remote branch.
Some of the features of GitHub Actions are:
- Ease of setup. There is no installation required as it is on the cloud
- Support of multiple languages and frameworks
- Provides actions to every GitHub event
- It can be shared via GitHub Marketplace
Setup GitHub Actions
In the root of your project, create .github/workflows/build.yml (it has to be in the same sequence).
Follow the below steps to create it in your project.
Step 1
Go to your terminal and enter the command mkdir .github.

Step 2
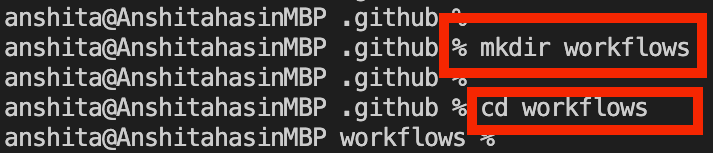
Now, navigate to .github (using cd .github) and add workflows folder to it (using mkdir workflows), just like shown in the screenshot below.
Step 3
After creating .github/workflows, create a file (.yml format) using the command touch build.yml.

Now, the workflows folder with the file (Example: build.yml) would be visible within the .github directory, as shown below.

After creating a build.yml file, let's add code to trigger the CI/CD on every code push in your Git Repository. Copy the below code to the .yml file (Example: build.yml)
name: K6 Performance Tests
on:
  push:

jobs:
  performance-tests:
    runs-on: ubuntu-latest

    steps:
      - name: Checkout Code
        uses: actions/checkout@v4

      - name: Setup k6
        uses: grafana/setup-k6-action@v1
        with:
          browser: true

      - name: Run browser k6 test
        uses: grafana/run-k6-action@v1
        with:
          path: browserTest.js

      - name: Upload Report
        uses: actions/upload-artifact@v4
        with:
          name: k6-browser-report-summary
          path: TestSummaryReport.html

      - name: Run k6 test on TestMu AI
        uses: grafana/run-k6-action@v1
        env:
          K6_BROWSER_WS_URL: ${{ secrets.LT_K6_WS_URL }}
        with:
          path: cloudTest.js

      - name: Upload Report
        uses: actions/upload-artifact@v4
        with:
          name: k6-cloud-report-summary
          path: TestReport.html
Now if you add this above workflow to your repo, and push your code on the main branch, you should be able to see a workflow under the Actions tab in your GitHub Repository.
Note: Grafana's original grafana/k6-action is now archived. The current recommended approach splits installation and execution into two actions, grafana/setup-k6-action and grafana/run-k6-action, which the workflow above uses.
Code Walkthrough
The workflow named K6 Performance Tests runs on every push, in a single job called performance-tests on an ubuntu-latest runner. It has six steps:
- Checkout Code - Pulls the repository with actions/checkout@v4.
- Setup k6 - Installs k6 and, with browser: true, the browser dependencies on the runner using grafana/setup-k6-action.
- Run browser k6 test - Runs browserTest.js headless on the runner with grafana/run-k6-action.
- Upload Report - Saves TestSummaryReport.html as the k6-browser-report-summary artifact.
- Run k6 test on TestMu AI - Runs cloudTest.js against the cloud browser in K6_BROWSER_WS_URL.
- Upload Report - Saves TestReport.html as the k6-cloud-report-summary artifact.
Store the full WebSocket URL, including your encoded credentials, as a repository secret named LT_K6_WS_URL. Secrets keep the access key out of the workflow file and the job logs.
Implementation
The workflow reuses the two scripts from earlier sections, so no new test code is needed. Keep browserTest.js and cloudTest.js at the repository root, as shown below:
GitHub runners have no display, which is why browser tests there must stay in the default headless mode.
Execution
Using the above code, you can execute your test case on both GitHub Actions and the cloud platform. Within the context of CI/CD, two tests are performed: one is executed on GitHub, while the other is conducted on TestMu AI.
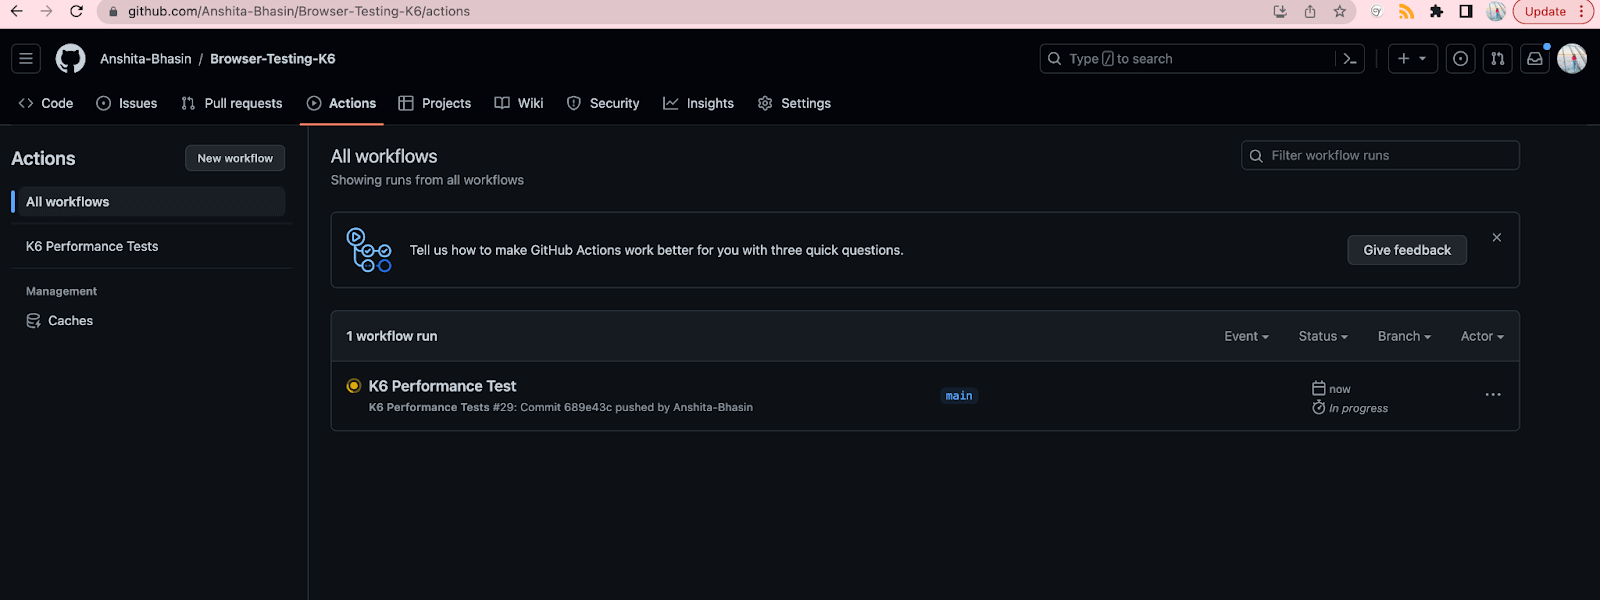
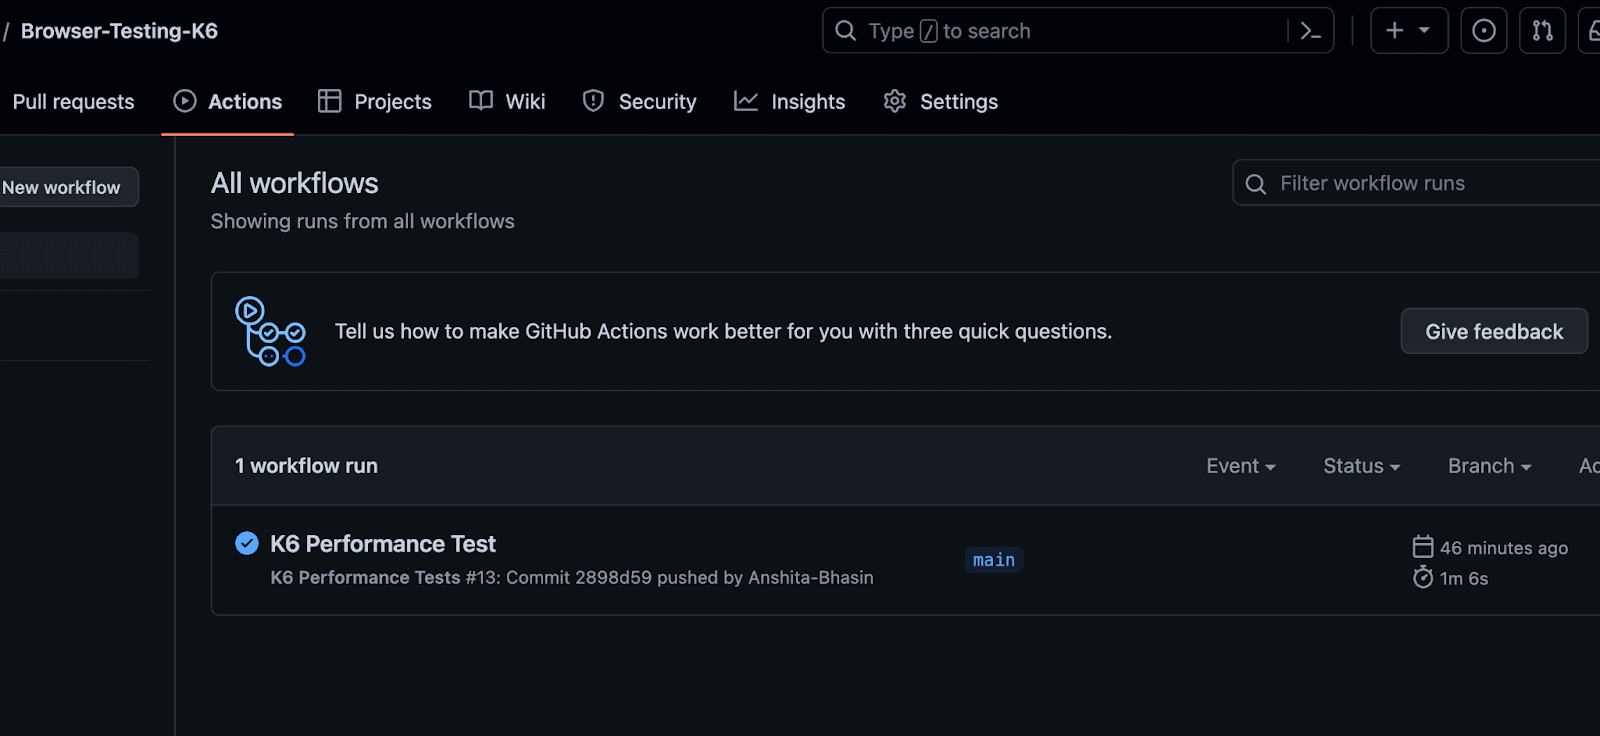
After the execution is completed, you will be able to see the passed workflow under the Actions tab, just like shown below in the execution screenshot.
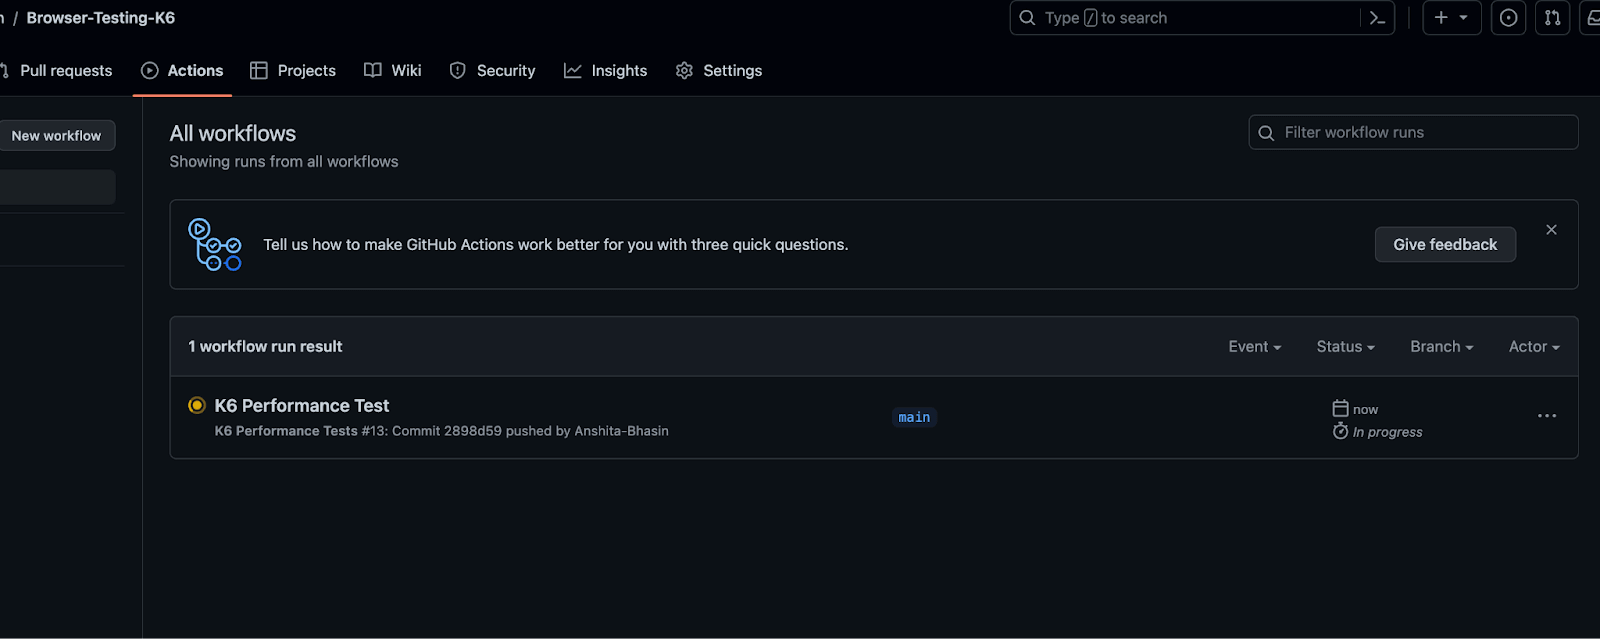
Go to your GitHub Repository and navigate to the Actions tab (refer to the below screenshot). On the Actions tab, you will be able to see the build running ( like shown below). Click on it to view the logs.
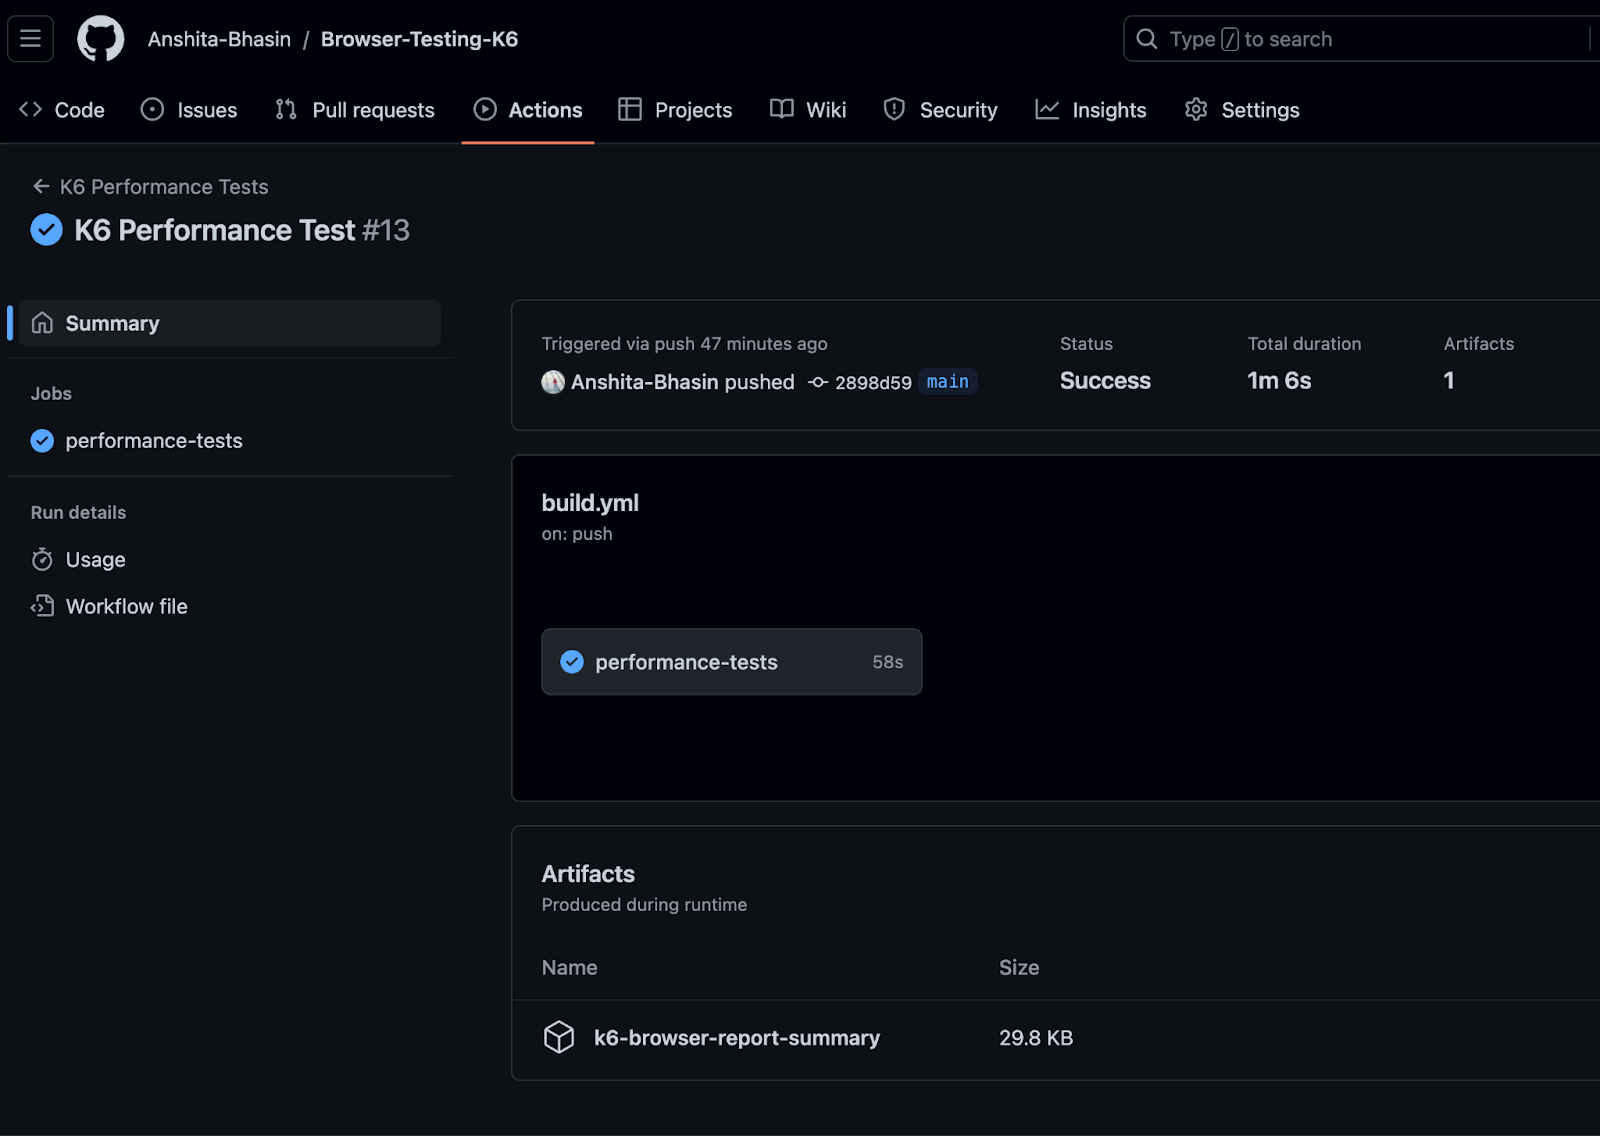
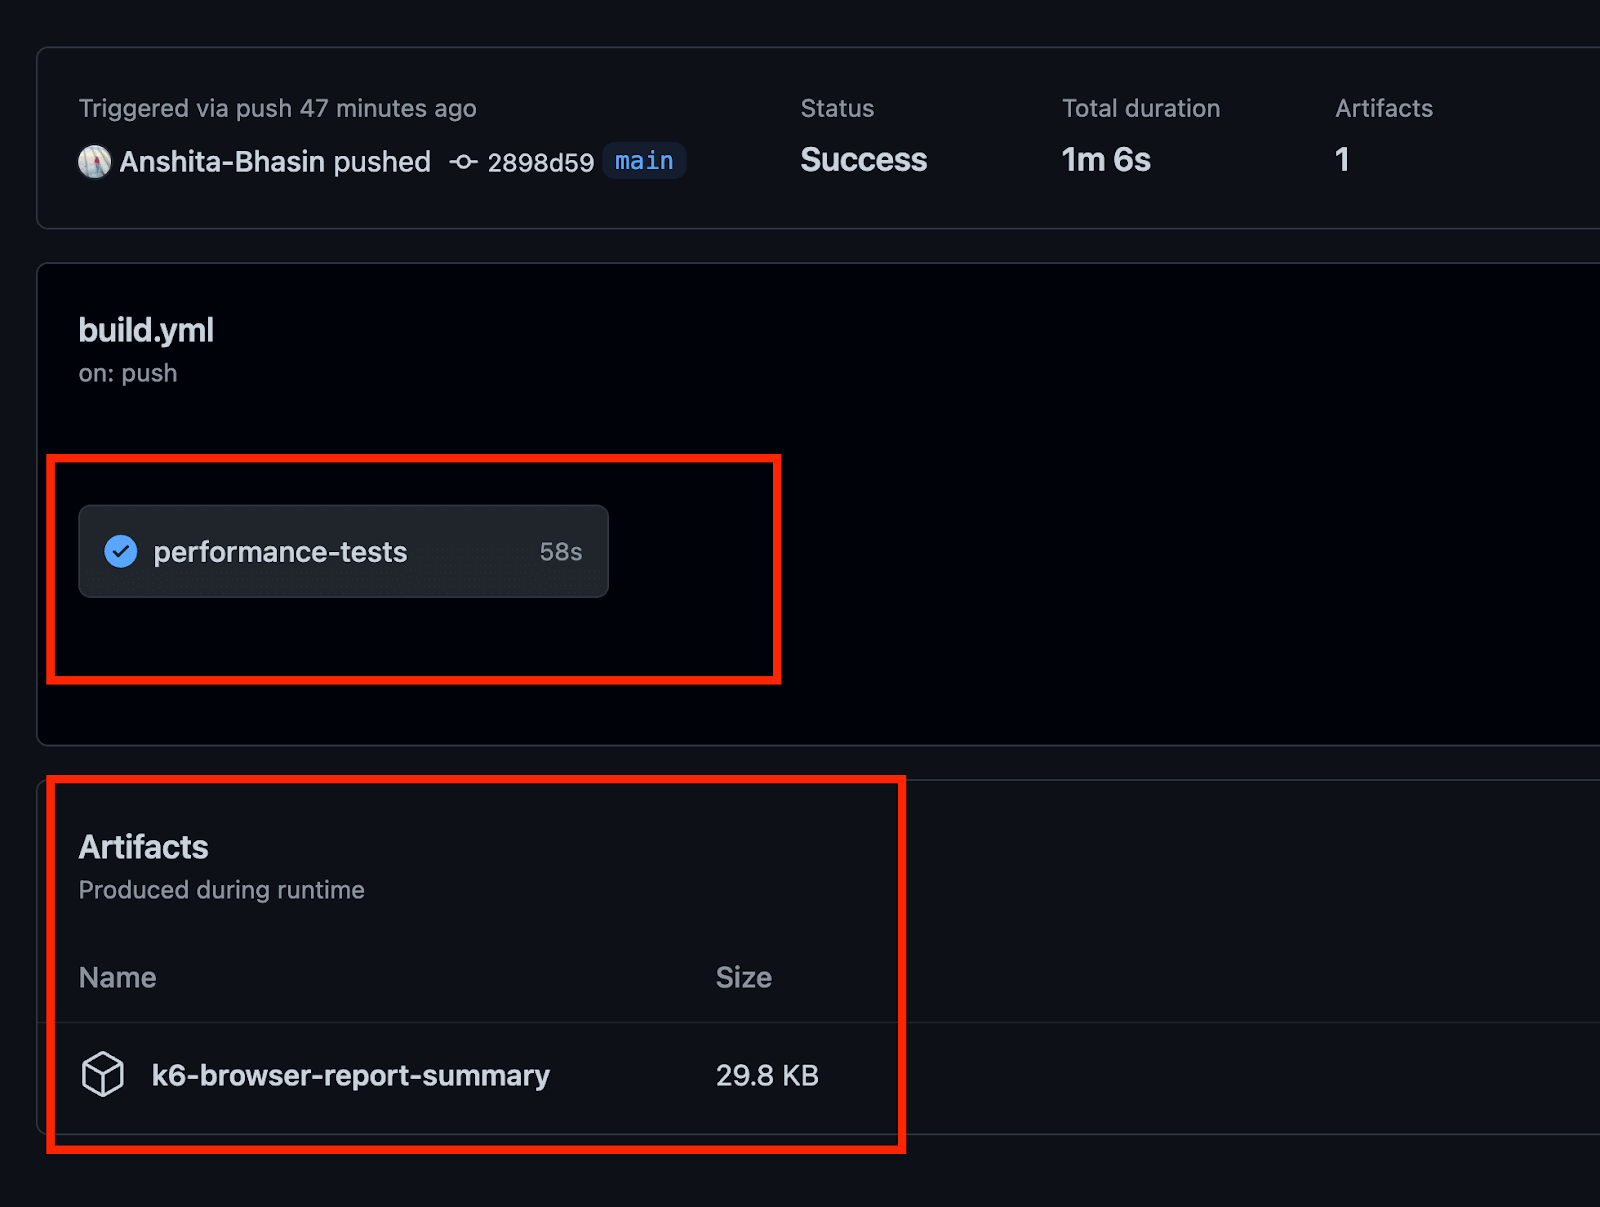
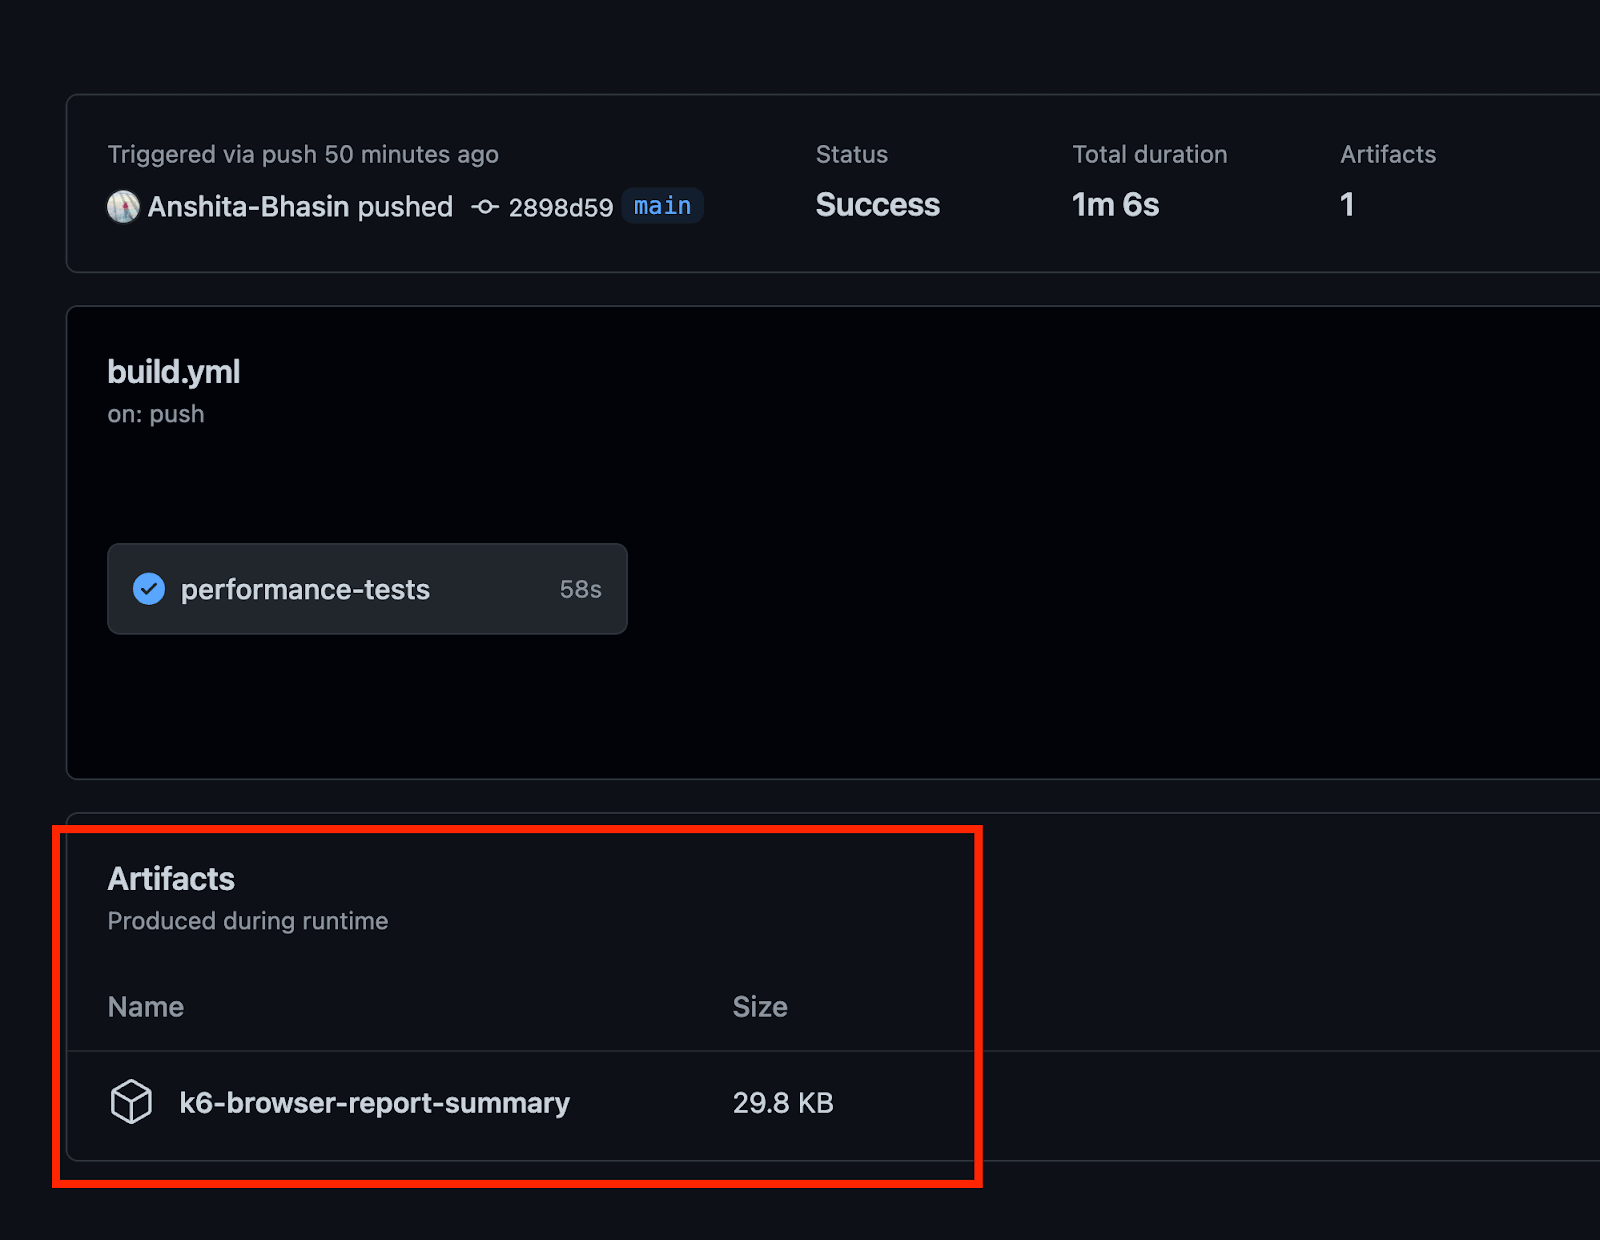
If you click on the workflow run, you'll see details such as the commit, the status, the time duration, and the report in zip format.
You can also view the logs about setting up the job and completing it by clicking the build.yml file.
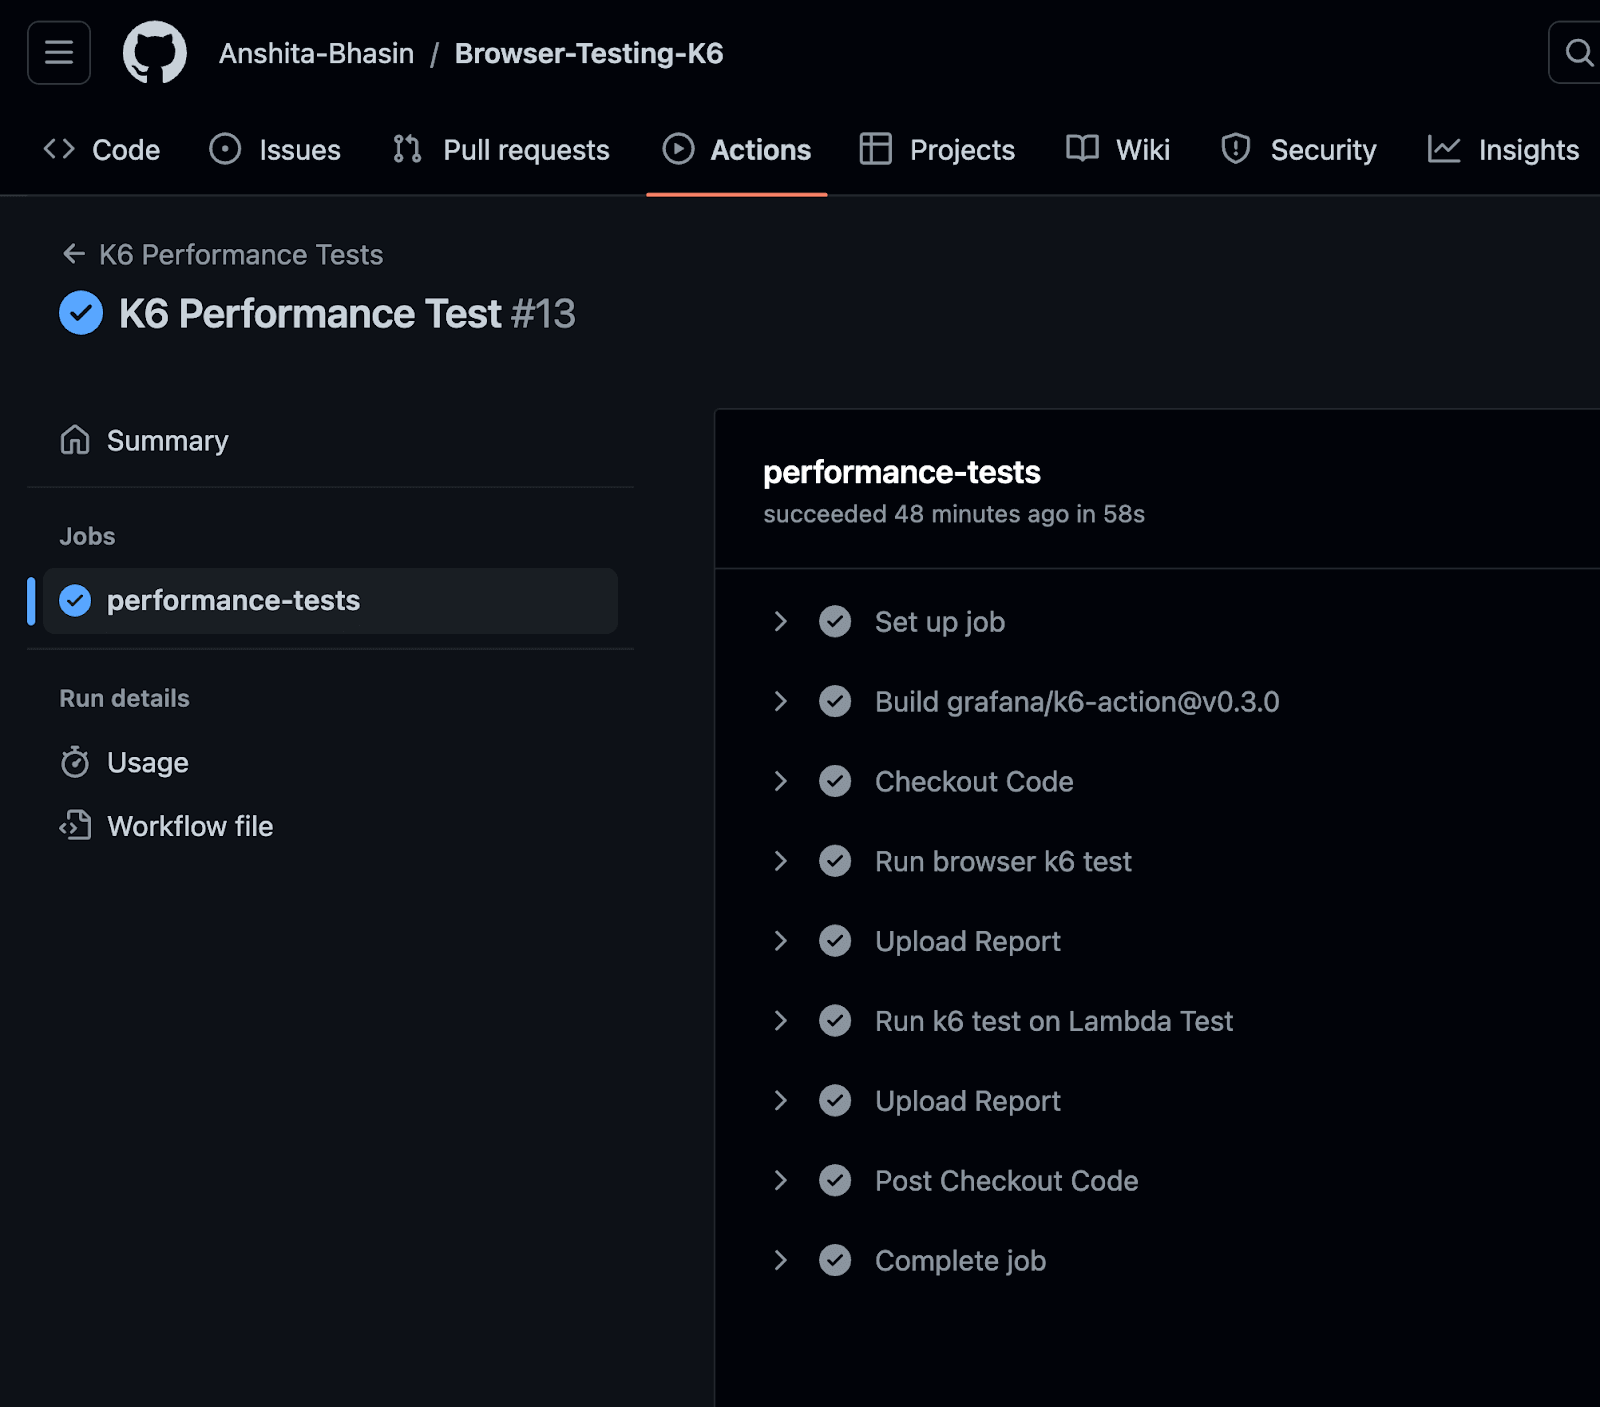
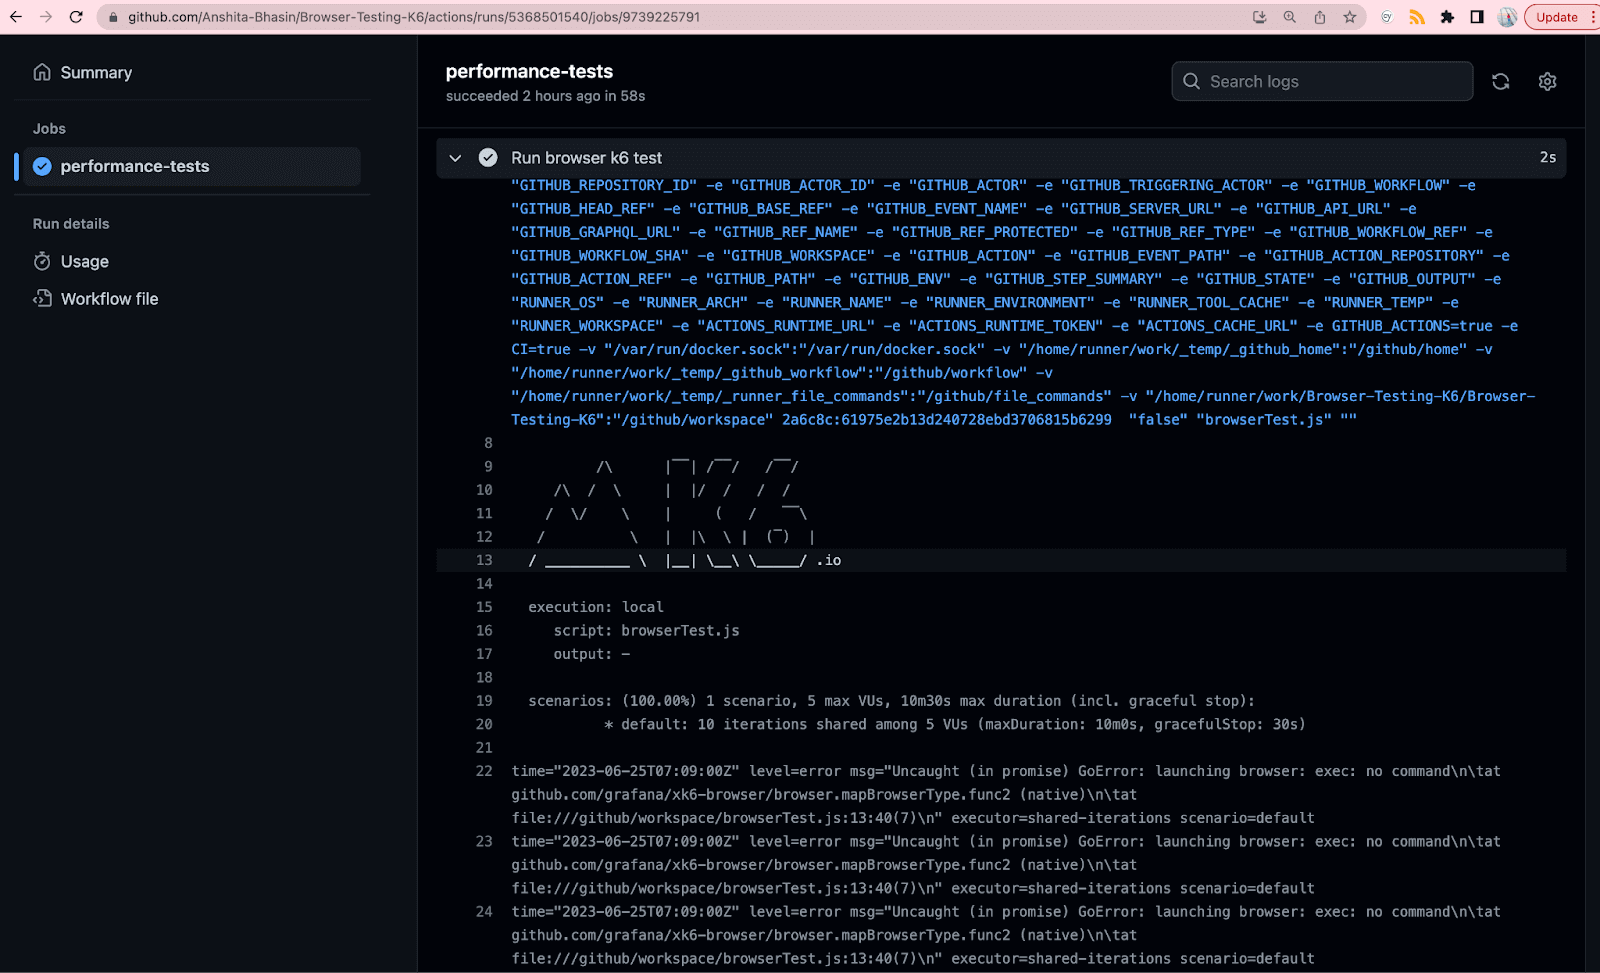
You can expand any of the steps and view the detailed log. Below is the detailed log of steps.
Run browser k6 test
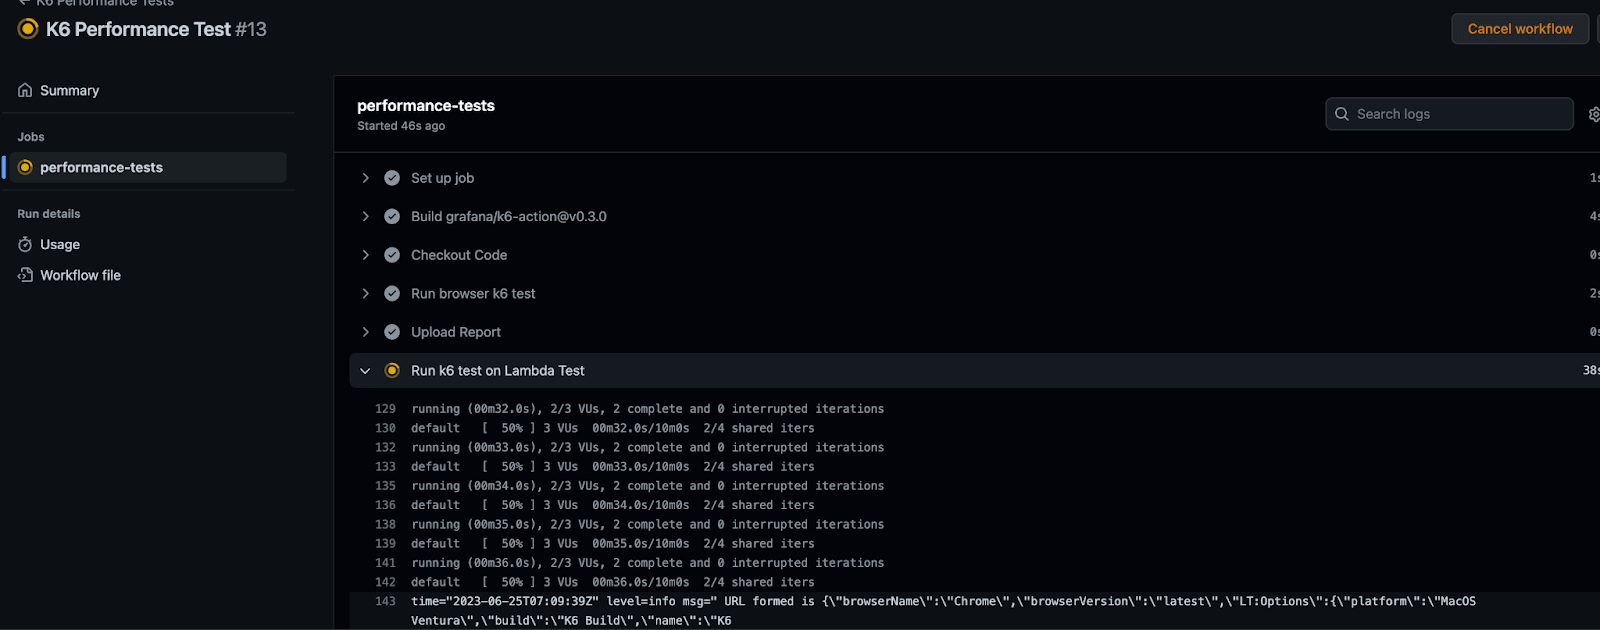
Perform k6 testing on TestMu AI
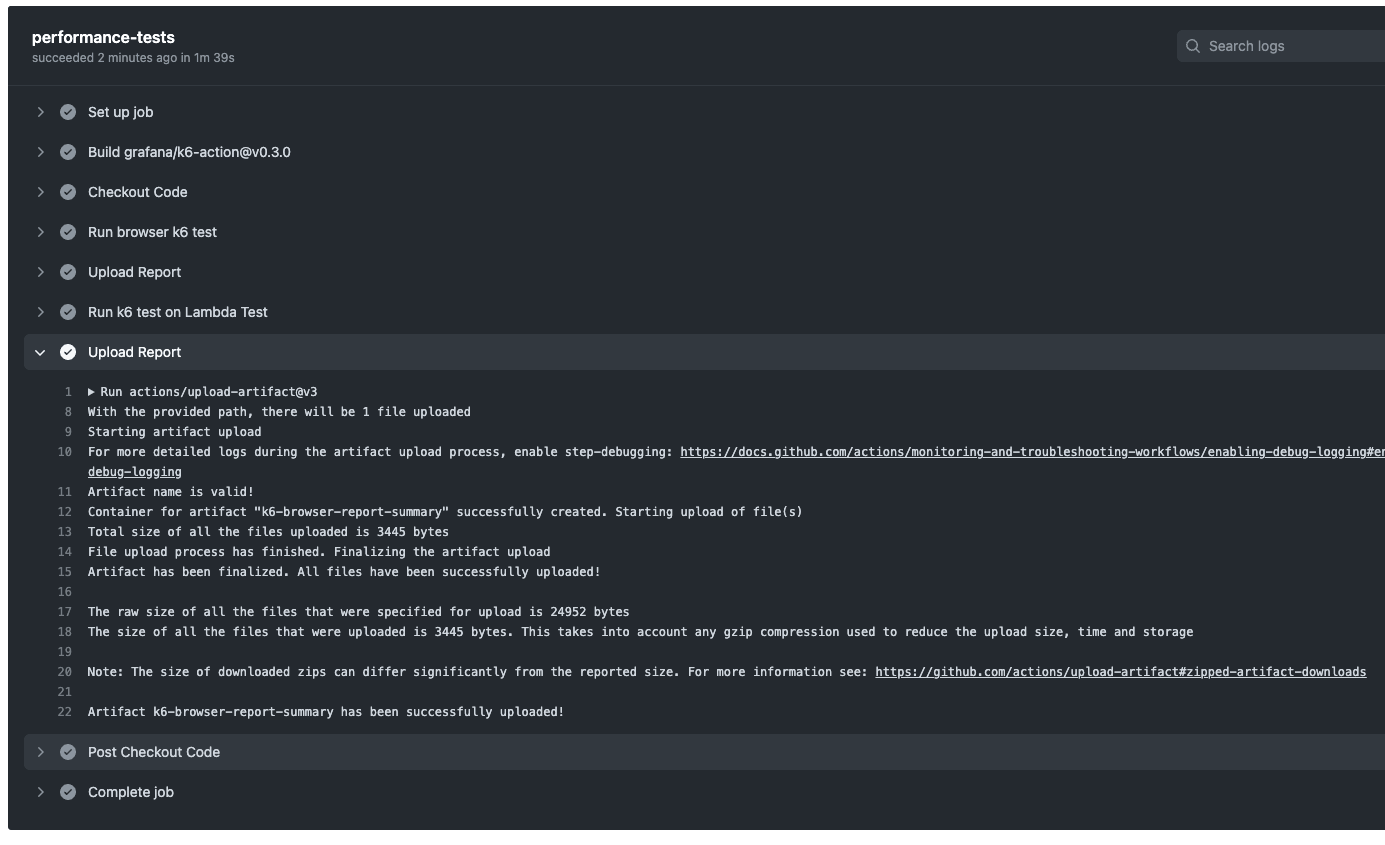
Upload Report: Detailed Logs
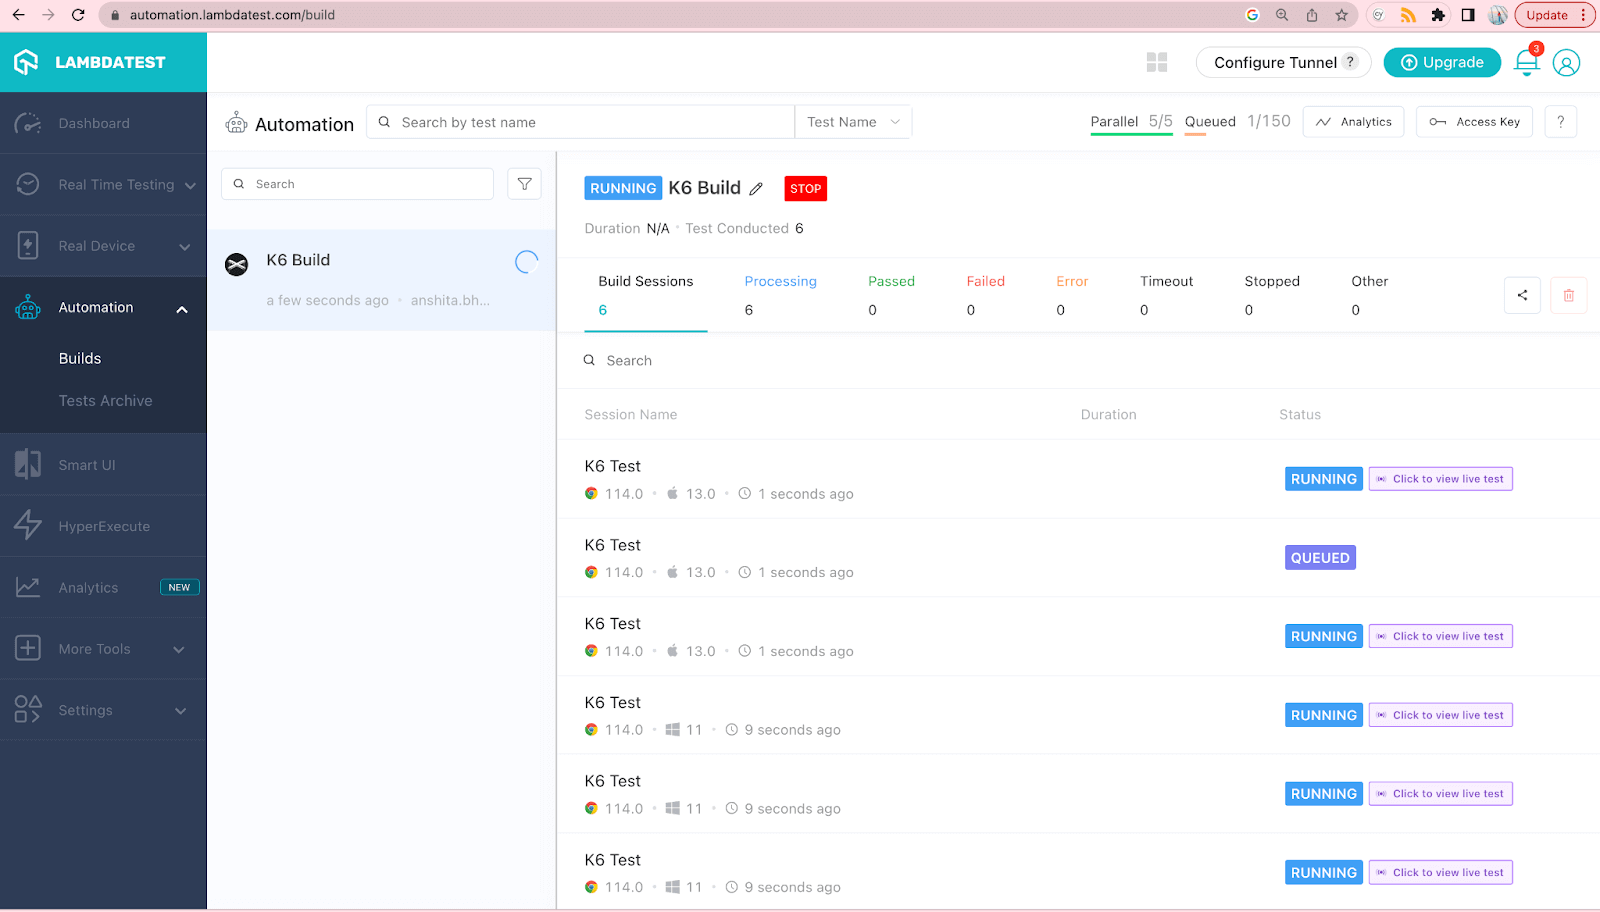
To access the build on the cloud platform, navigate to TestMu AI and go to the Automation tab. Refer to the screenshot below for guidance on locating the builds.
After successfully passing your Actions flow, you can download the associated reports. Navigate to your Actions tab on GitHub and click on the artifact, which will provide access to the reports.
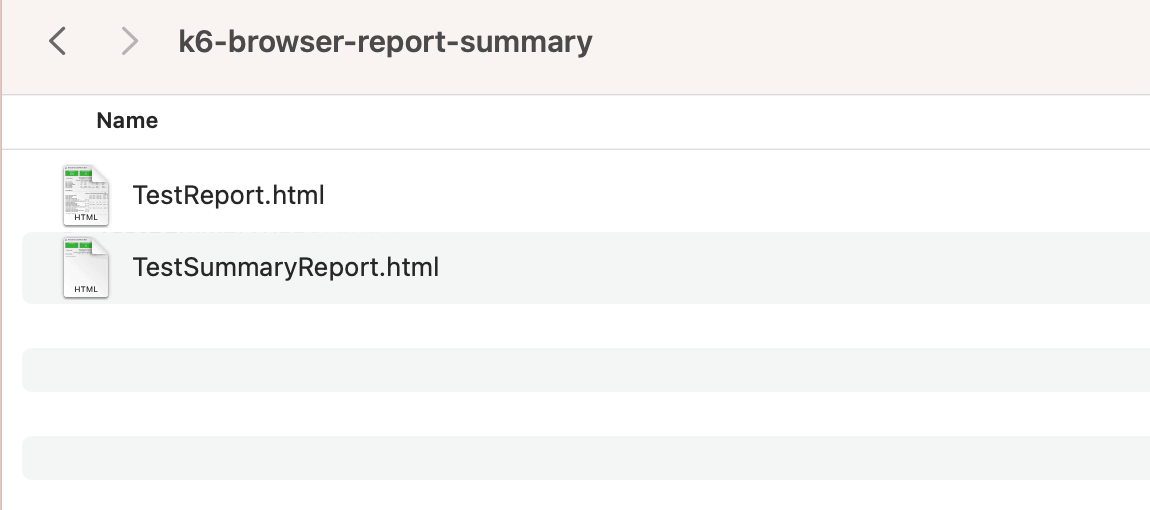
Since two artifacts are uploaded as part of the mentioned test, you can expect to find two reports in a single zip folder.
By clicking on the Artifacts, you can download a zip folder that includes two test reports, similar to the example shown below.
To view the test executed on the cloud platform, navigate to TestMu AI.
Bonus Tips
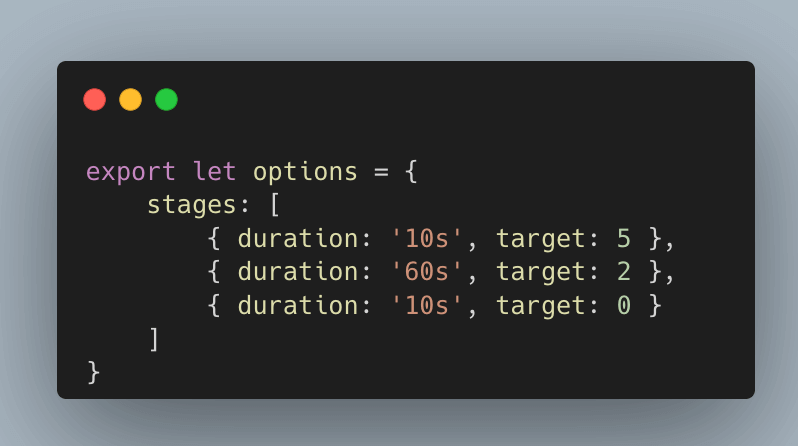
Apart from passing the virtual users and iterations directly in the test, you can also define the load in stages using duration and target values. This allows you to increase the load over a specified duration gradually.
Duration
The duration parameter determines the duration of each load stage, and the target parameter sets the desired number of virtual users (or requests per second) for that stage. By specifying multiple stages, you can create a load test scenario where the load gradually increases or changes over time.
Below is an example of how you can define load stages using duration and target:
In addition to specifying the load stages, you can also define thresholds to monitor specific performance metrics during the test.
Thresholds
It allows you to set criteria for acceptable performance levels and generate alerts or reports if those criteria are not met. This can help identify performance bottlenecks or issues. In the case of thresholds, if the provided expression evaluates to false at the end of the test, k6 considers the whole test a failure.
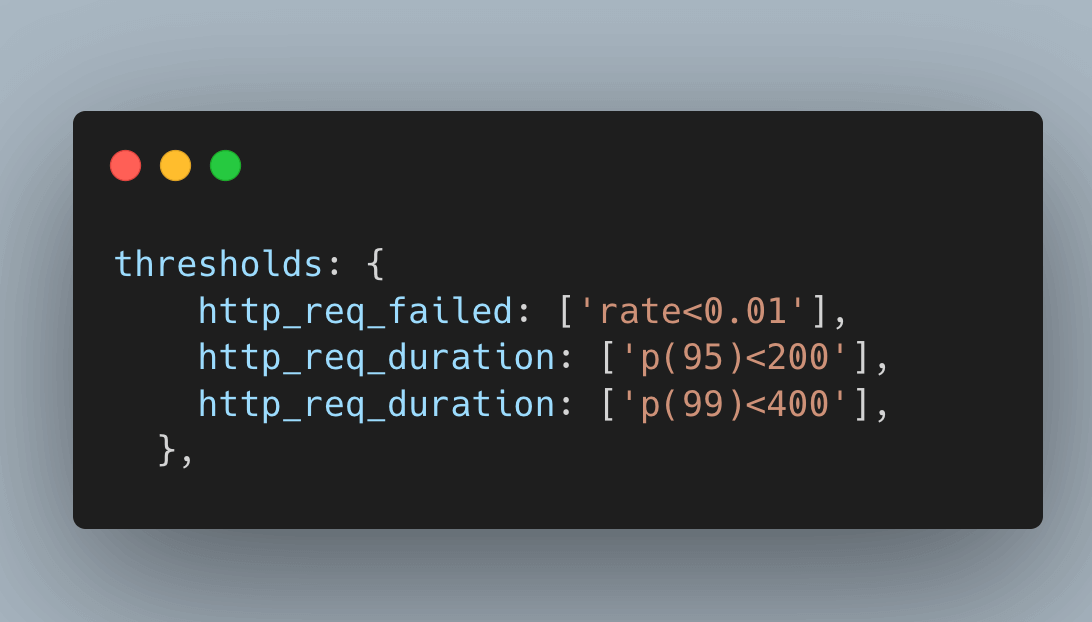
As part of thresholds, you can define metrics such as error rates (http_req_failed), response times (http_req_duration), or any other relevant metrics using percentile values or specific conditions.
Below is a sample script defining 3 thresholds along with load stages:
- First threshold evaluates the rate of HTTP errors (http_req_failed metric) should be less than 1%.
- Second threshold http_req_duration: ['p(95)<200'], evaluates whether 95 percent of requests have a response time below 200ms.
- Third threshold http_req_duration: ['p(99)<400'], evaluates whether 99 percent of requests have a response time below 400ms.
You can further explore the terms and terminologies around k6 through this k6 testing cheat sheet.
Note: Now you can perform online cross browser testing on Brave Browsers to make sure your websites and web apps are compatible with all versions.
Key Takeaway: A k6 threshold on error rate or response time percentiles marks the whole run as failed, so a pipeline can stop a release for slow performance, not only for broken functionality.
Conclusion
Where k6 fits depends on the question you need answered:
| If you need to know | Use |
|---|---|
| How the backend holds up under traffic | A protocol-level k6 script with stages that ramp virtual users |
| How pages feel to users under load | A k6 browser test tracking page load and Core Web Vitals |
| Whether a release is fast enough to ship | Thresholds on error rate and response time percentiles |
| Whether performance regressed on a commit | The same script running in GitHub Actions |
Start with one critical flow, such as login or checkout, and add thresholds before adding more scripts. A threshold turns a report someone must read into a pass or fail result.
Author

Anshita Bhasin
Blogs: 6


Anshita Bhasin is a Senior QA Automation Engineer with over 9 years of experience in the software industry. Throughout her career, She has gained expertise in a variety of tools and technologies, including Rest Assured, Selenium, and Cypress. Currently, She is working at a PropTech company in Dubai. In addition to her technical expertise, she is also passionate about sharing her insights and experiences with others in the form of tutorials and workshops to help guide those just starting out in their careers or seeking advice on their professional paths. You can also follow her on Twitter.
Reviewer

Srinivasan Sekar
Reviewer
Srinivasan Sekar is Director of Engineering at TestMu AI (formerly LambdaTest), where he leads engineering and open-source initiatives behind the Selenium and Appium automation grid and owns TestMu AI's MCP Server. A committer to Appium and a contributor to Selenium, WebdriverIO, Taiko, and AppiumTestDistribution, he brings over 15 years of experience in quality engineering and open-source technologies. He is the author of the Apress book 'The MCP Standard: A Developer's Guide to Building Universal AI Tools with the Model Context Protocol,' a Certified Kubernetes and Cloud Native Associate, and an international conference speaker. Before TestMu AI he spent over eight years at Thoughtworks as a Principal Consultant and Quality Architect. Srinivasan holds a B.Tech in Information Technology from Anna University.


k6 Testing FAQs
Did you find this page helpful?
More Related Blogs
TestMu AI forEnterprise
Get access to solutions built on Enterprise
grade security, privacy, & compliance
- Advanced access controls
- Advanced data retention rules
- Advanced Local Testing
- Premium Support options
- Early access to beta features
- Private Slack Channel
- Unlimited Manual Accessibility DevTools Tests