
Power Your Software Testing with AI Agents and Cloud
The Native AI-Agentic Cloud Platform to Supercharge Quality Engineering. Test Intelligently and Ship Faster.

- TestMu AI (Formerly LambdaTest)
- /
- Blog
- /
- Open vs Closed Workload Models: k6, Artillery and JMeter Measured
Open vs Closed Workload Models: k6, Artillery and JMeter Measured
Open and closed workload models do not report the same slowdown. Against a 20-second slowdown, a closed k6 run with 5 virtual users kept p95 at 67.07 ms, while an open run at 100 iterations per second reported p95 of 1 second, scaled to 101 virtual users and dropped 82 iterations. Artillery matched k6 within about 3 percent.
Published on:
Disclosure: TestMu AI publishes this page. The JMeter run used HyperExecute, our own product, and the author and reviewer both work on HyperExecute.
These runs back the load-model claims in our comparison of performance testing tools. The same k6 script ran in a closed and an open workload model against a controlled slowdown, k6 and Artillery then ran the same open model side by side, and an Apache JMeter plan ran on managed cloud infrastructure. The k6 and Artillery summaries are copied from the console without edits, and the JMeter figures come from the job's downloaded log and HTML dashboard.
Open and Closed Workload Models
A closed workload model runs a fixed number of virtual users, and each one waits for a response before starting its next iteration, so the request rate falls when the application slows down. An open model starts new iterations at a set arrival rate whatever the response time. The Gatling workload models guide matches closed models to systems that cap concurrent users, such as a call center or a ticketing site with a queue, and open models to most websites, where users keep arriving even when the application has trouble serving them.
| Tool | Open model (arrival rate) | Closed model (concurrent users) |
|---|---|---|
| Grafana k6 | constant-arrival-rate and ramping-arrival-rate executors | constant-vus executor |
| Gatling | constantUsersPerSec, rampUsersPerSec, and atOnceUsers injection steps | constantConcurrentUsers and rampConcurrentUsers; one injection profile cannot mix both models |
| Apache JMeter | Open Model Thread Group (experimental), with schedules such as rate(10/sec) random_arrivals(1 min) | Standard Thread Group; the Precise Throughput Timer paces threads but does not generate new ones |
| Locust | No arrival-rate mode; wait_time can only constrain throughput, not launch new users | Users with wait_time functions such as between, constant, and constant_throughput |
The closed model's blind spot has a name. Coordinated omission is a measurement bias in closed-model tests: each virtual user waits for a response before sending its next request, so a slowing system receives fewer requests, the slow period is under-sampled, and high percentiles understate real latency. Gil Tene's wrk2 documentation describes the effect, and arrival-rate executors avoid it.
The Test Server
Every k6 and Artillery run below targets the same small Node.js server. It answers every request in 50 ms, except from second 20 to second 40 after a /reset call, when each response takes 1 second, and each run calls /reset immediately before it starts.
// server.mjs: 50 ms responses, 1,000 ms responses from second 20 to 40 after /reset
import http from 'node:http';

let t0 = Date.now();
http.createServer((req, res) => {
  if (req.url === '/reset') {
    t0 = Date.now();
    res.end('reset');
    return;
  }
  const elapsed = (Date.now() - t0) / 1000;
  const delay = elapsed >= 20 && elapsed < 40 ? 1000 : 50;
  setTimeout(() => res.end('ok'), delay);
}).listen(3456, '127.0.0.1', () => console.log('listening on 127.0.0.1:3456'));
k6 Closed vs Open Model on the Same Slowdown
The k6 open and closed models documentation explains that a closed-model test waits when responses slow down, so fewer new iterations start and the arrival rate tapers off. To measure how much of a slowdown that waiting hides, the same k6 script ran twice against the test server:
- Run 1, closed model - the constant-vus executor with 5 virtual users for 60 seconds.
- Run 2, open model - the constant-arrival-rate executor at 100 iterations per second for 60 seconds, with up to 150 virtual users.
- Environment - k6 v2.2.0 on Windows, run on September 15, 2026, with the test server and k6 on the same machine.
// closed.js (Run 1)
import http from 'k6/http';

export const options = {
  scenarios: {
    closed_model: {
      executor: 'constant-vus',
      vus: 5,
      duration: '60s',
    },
  },
  summaryTrendStats: ['avg', 'med', 'p(95)', 'p(99)', 'max'],
};

export function setup() {
  http.get('http://127.0.0.1:3456/reset');
}

export default function () {
  http.get('http://127.0.0.1:3456/');
}

// open.js (Run 2) is identical except for the scenario:
//   open_model: {
//     executor: 'constant-arrival-rate',
//     rate: 100,
//     timeUnit: '1s',
//     duration: '60s',
//     preAllocatedVUs: 20,
//     maxVUs: 150,
//   },
Running k6 run --no-color -q closed.js and then k6 run --no-color -q open.js printed these end-of-test summaries, copied from the console without edits. Run 1, closed model:
  █ TOTAL RESULTS

    HTTP
    http_req_duration..............: avg=85.47ms med=60.77ms p(95)=67.07ms p(99)=1s max=1.01s
      { expected_response:true }...: avg=85.47ms med=60.77ms p(95)=67.07ms p(99)=1s max=1.01s
    http_req_failed................: 0.00%  0 out of 3510
    http_reqs......................: 3510   58.45147/s

    EXECUTION
    iteration_duration.............: avg=85.54ms med=60.77ms p(95)=67.11ms p(99)=1s max=1.01s
    iterations.....................: 3509   58.434817/s
    vus............................: 5      min=5         max=5
    vus_max........................: 5      min=5         max=5

    NETWORK
    data_received..................: 435 kB 7.2 kB/s
    data_sent......................: 246 kB 4.1 kB/s
Run 2, open model:
  █ TOTAL RESULTS

    HTTP
    http_req_duration..............: avg=359.14ms med=50.76ms p(95)=1s p(99)=1s max=1.01s
      { expected_response:true }...: avg=359.14ms med=50.76ms p(95)=1s p(99)=1s max=1.01s
    http_req_failed................: 0.00%  0 out of 5920
    http_reqs......................: 5920   98.577355/s

    EXECUTION
    dropped_iterations.............: 82     1.36543/s
    iteration_duration.............: avg=359.25ms med=50.8ms  p(95)=1s p(99)=1s max=1.01s
    iterations.....................: 5919   98.560704/s
    vus............................: 5      min=5         max=101
    vus_max........................: 102    min=20        max=102

    NETWORK
    data_received..................: 734 kB 12 kB/s
    data_sent......................: 414 kB 6.9 kB/s
The two end-of-test summaries, compared metric by metric:
| Metric | Closed model (constant-vus) | Open model (constant-arrival-rate) | Key takeaway |
|---|---|---|---|
| p95 response time | 67.07 ms | 1 s | The open model reveals the slowdown; the closed model hides it |
| p99 response time | 1 s | 1 s | The slowdown only surfaces at p99 in the closed model |
| Requests sent | 3,510 at 58.45/s | 5,920 at 98.58/s | The closed model sent 41% fewer requests over the 60-second run |
| Max active virtual users | 5 | 101 | The open model scaled up to hold the arrival rate |
| Dropped iterations | N/A | 82 | The open model reports load it could not start |
- Where the slowdown showed - in the closed-model run, the 1-second responses surfaced only at p99, because its 5 virtual users sent few requests while they waited.
- Virtual users - the open model scaled from 5 to 101 active virtual users during the slowdown, and k6 still counted 82 dropped iterations, which the k6 metrics reference defines as iterations not started due to lack of VUs.
- What to change - for public websites and APIs, drive load as an arrival rate taken from production traffic, and set thresholds on p99 as well as p95, since the closed run's slowdown surfaced only at p99.
k6 vs Artillery at the Same Arrival Rate
Two tools that both advertise an open workload model, Grafana k6 and Artillery, were pointed at the same test server at the same arrival rate to see whether they report the same slowdown the same way. Both runs use the same profile: 100 arrivals per second for 60 seconds, each arrival making one GET request, with the clock reset immediately before the run starts.
// k6-open100.js
import http from 'k6/http';

export const options = {
  scenarios: {
    open_model: {
      executor: 'constant-arrival-rate',
      rate: 100,
      timeUnit: '1s',
      duration: '60s',
      preAllocatedVUs: 20,
      maxVUs: 150,
    },
  },
  summaryTrendStats: ['avg', 'med', 'p(95)', 'p(99)', 'max'],
};

export function setup() {
  http.get('http://127.0.0.1:3456/reset');
}

export default function () {
  http.get('http://127.0.0.1:3456/');
}
# artillery-open100.yml
config:
target: "http://127.0.0.1:3456"
phases:
- duration: 60
arrivalRate: 100
name: "Open model: 100 arrivals per second"
http:
pool: 200
before:
flow:
- get:
url: "/reset"
scenarios:
- name: "Single GET against the slowdown server"
flow:
- get:
url: "/"Running k6 run --no-color -q k6-open100.js printed this end-of-test summary, copied from the console without edits:
  █ TOTAL RESULTS

    HTTP
    http_req_duration..............: avg=358.38ms med=50.54ms p(95)=1s p(99)=1s max=1.01s
      { expected_response:true }...: avg=358.38ms med=50.54ms p(95)=1s p(99)=1s max=1.01s
    http_req_failed................: 0.00%  0 out of 5920
    http_reqs......................: 5920   98.578749/s

    EXECUTION
    dropped_iterations.............: 82     1.365449/s
    iteration_duration.............: avg=358.55ms med=50.59ms p(95)=1s p(99)=1s max=1.01s
    iterations.....................: 5919   98.562098/s
    vus............................: 6      min=5         max=101
    vus_max........................: 102    min=20        max=102

    NETWORK
    data_received..................: 734 kB 12 kB/s
    data_sent......................: 414 kB 6.9 kB/s
Running npx artillery@2.0.34 run artillery-open100.yml against the same server printed this:
Summary report @ 12:55:31(+0530)
--------------------------------

http.codes.200: ................................................................ 6000
http.downloaded_bytes: ......................................................... 12000
http.request_rate: ............................................................. 100/sec
http.requests: ................................................................. 6000
http.response_time:
  min: ......................................................................... 38
  max: ......................................................................... 1019
  mean: ........................................................................ 369.4
  median: ...................................................................... 55.2
  p95: ......................................................................... 1002.4
  p99: ......................................................................... 1002.4
http.response_time.2xx:
  min: ......................................................................... 38
  max: ......................................................................... 1019
  mean: ........................................................................ 369.4
  median: ...................................................................... 55.2
  p95: ......................................................................... 1002.4
  p99: ......................................................................... 1002.4
http.responses: ................................................................ 6000
vusers.completed: .............................................................. 6000
vusers.created: ................................................................ 6000
vusers.created_by_name.Single GET against the slowdown server: ................. 6000
vusers.failed: ................................................................. 0
vusers.session_length:
  min: ......................................................................... 50.4
  max: ......................................................................... 1020.2
  mean: ........................................................................ 370.8
  median: ...................................................................... 56.3
  p95: ......................................................................... 1002.4
  p99: ......................................................................... 1002.4
Side by side, against the identical 20-second slowdown:
| What the run reported | Grafana k6 | Artillery |
|---|---|---|
| Requests completed | 5,920 | 6,000 |
| Mean response time | 358.38 ms | 369.4 ms |
| Median response time | 50.54 ms | 55.2 ms |
| 95th percentile | 1 s | 1,002.4 ms |
| 99th percentile | 1 s | 1,002.4 ms |
| Slowest response | 1.01 s | 1,019 ms |
| Failed requests | 0 | 0 |
| Arrivals it could not start | 82 dropped iterations | no equivalent metric in the summary |
- The measurements agree - two independently written tools put the mean at 358.38 ms and 369.4 ms and the 95th percentile at 1 s and 1,002.4 ms, a gap of about 3 percent on the same slowdown.
- The bookkeeping does not - k6 completed 5,920 of the 6,000 scheduled arrivals and reported the shortfall as 82 dropped iterations, because its virtual user pool had scaled to 101 against a 150 ceiling and ran out of spare users while responses were slow.
- Artillery started all 6,000 - it does not cap virtual users the way a k6 arrival-rate executor does, so nothing was dropped, and its summary carries no counter that would have reported a shortfall if one had happened.
- Why that matters - a dropped arrival is load your application never received, so a percentile calculated without it flatters the result; read the arrival-shortfall counter next to the percentiles, and raise maxVUs until it reaches zero before trusting the numbers.
- Environment - k6 v2.2.0 and Artillery 2.0.34 on Windows, run on September 16, 2026, with the test server and both load generators on the same machine.
A JMeter Plan on Managed Infrastructure
Both runs above needed a load generator on the machine doing the testing. The third run did not. Java is not installed on the machine used for this article, so an Apache JMeter plan was pushed to TestMu AI HyperExecute from the command line instead, and the plan ran on a provisioned Linux machine that installed JMeter, executed the test, and uploaded the results. The plan searches the Ecommerce Playground demo store with 5 threads for 30 seconds, with a 2 second think time between requests.
version: 0.1
runson: linux
concurrency: 1
autosplit: true
retryOnFailure: false
shell: bash

pre:
  - java -version
  - curl -sL -o jmeter.tgz https://dlcdn.apache.org/jmeter/binaries/apache-jmeter-5.6.3.tgz || curl -sL -o jmeter.tgz https://archive.apache.org/dist/jmeter/binaries/apache-jmeter-5.6.3.tgz
  - tar -xzf jmeter.tgz
  - mkdir -p results

testDiscovery:
  type: raw
  mode: static
  command: ls plans/*.jmx

testRunnerCommand: apache-jmeter-5.6.3/bin/jmeter -n -t $test -l results/result.jtl -j results/jmeter.log -e -o results/html

post:
  - echo "===== JMETER SUMMARY LINES ====="
  - grep -E "summary (+|=)" results/jmeter.log | tail -8
  - echo "===== STATISTICS JSON ====="
  - cat results/html/statistics.json

uploadArtefacts:
  - name: jmeter-results
    path:
      - results/**
JMeter's own end-of-run summary line, read back from the job's downloaded log, was:
summary = 61 in 00:00:30 = 2.0/s Avg: 242 Min: 200 Max: 990 Err: 0 (0.00%)The same run also produced a JMeter HTML dashboard, whose statistics file carries the percentile breakdown:
{
  "Search iphone" : {
    "transaction" : "Search iphone",
    "sampleCount" : 61,
    "errorCount" : 0,
    "errorPct" : 0.0,
    "meanResTime" : 242.7377049180328,
    "medianResTime" : 225.0,
    "minResTime" : 200.0,
    "maxResTime" : 990.0,
    "pct1ResTime" : 267.20000000000005,
    "pct2ResTime" : 271.7,
    "pct3ResTime" : 990.0,
    "throughput" : 2.1686575654152445,
    "receivedKBytesPerSec" : 299.26314804198665,
    "sentKBytesPerSec" : 0.3833271673243743
  },
  "Total" : {
    "transaction" : "Total",
    "sampleCount" : 61,
    "errorCount" : 0,
    "errorPct" : 0.0,
    "meanResTime" : 242.7377049180328,
    "medianResTime" : 225.0,
    "minResTime" : 200.0,
    "maxResTime" : 990.0,
    "pct1ResTime" : 267.20000000000005,
    "pct2ResTime" : 271.7,
    "pct3ResTime" : 990.0,
    "throughput" : 2.1686575654152445,
    "receivedKBytesPerSec" : 299.26314804198665,
    "sentKBytesPerSec" : 0.3833271673243743
  }
}- What the run returned - 61 samples, 0 errors, a mean response time of 242.74 ms, a median of 225 ms, and a throughput of 2.17 requests per second.
- The percentiles - 267.2 ms at the 90th, 271.7 ms at the 95th, and 990 ms at the 99th, where pct1ResTime, pct2ResTime, and pct3ResTime are JMeter's 90th, 95th, and 99th percentile fields.
- The 99th percentile is one request - the results file shows the slowest sample, at 990 ms, was the very first request of the run, and 746 ms of that was connection setup; across only 61 samples a single cold connection lands on the 99th percentile, which is why short runs overstate the tail.
- Percentiles are in the artifact, not the summary tiles - the platform's Summary tab reports average and 90th percentile response time, while the JMeter HTML dashboard produced by the same job carries the 90th, 95th, and 99th, so download the report artifact when you need the full tail.
- What it cost in time - the job finished in 49 seconds end to end, 35 seconds of which was test execution, with no load generator installed locally.
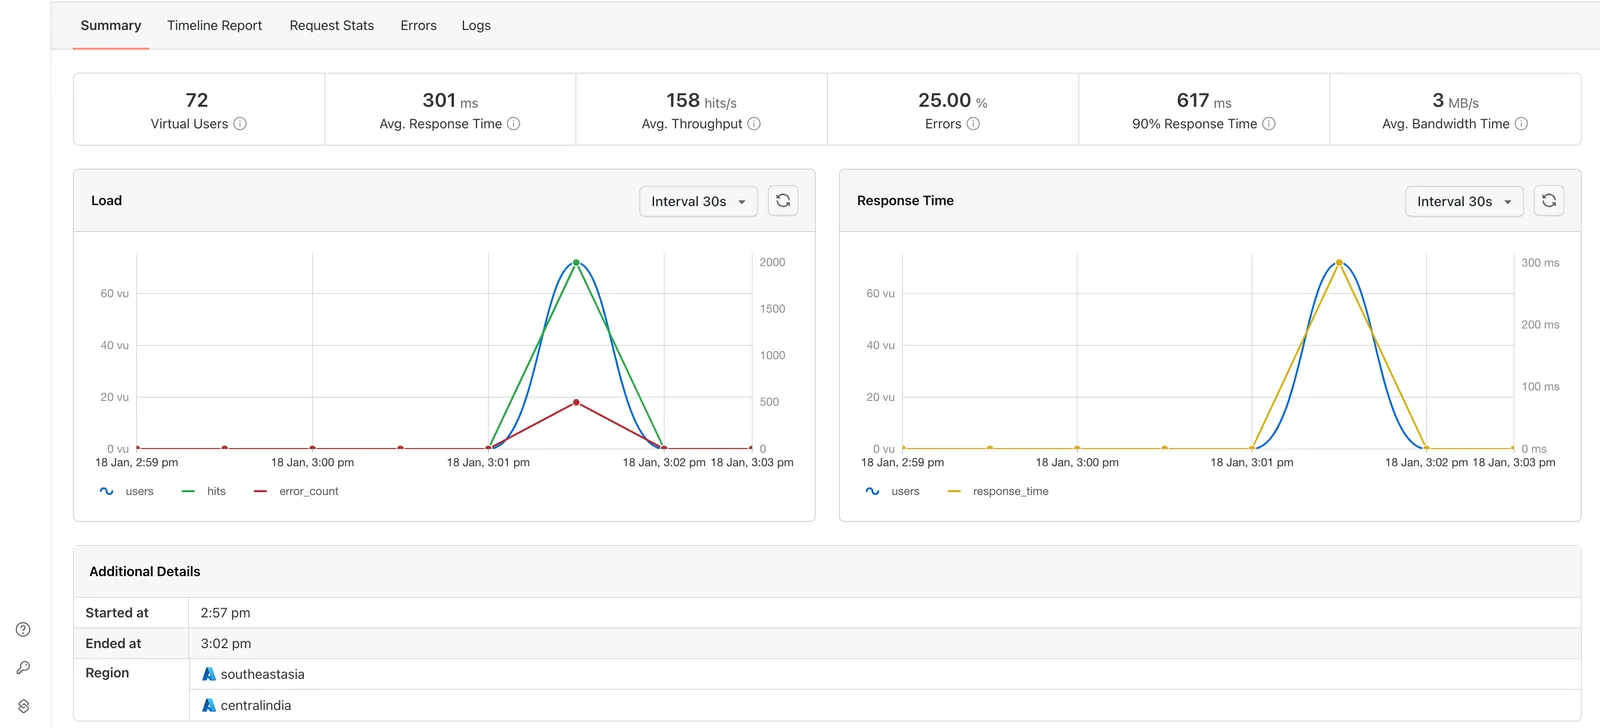
The walkthrough of performance testing with HyperExecute shows the same setup from the portal.
How Virtual Users Multiply Across Load Generators
In Apache JMeter distributed mode, a thread count multiplies across servers: the JMeter remote testing documentation states that each server runs the full test plan, so setting 1000 threads with 6 JMeter servers injects 6000 threads.
Managed platforms can behave the same way by default. The HyperExecute JMeter documentation walks through a 250-user .jmx plan run across 2 regions with 3 machines each: without overrides, every machine runs all 250 users, for 1500 users overall. Setting Total Users and the region split in the run form makes the platform divide the load instead, and the Gatling on HyperExecute guide covers users, duration, and regions for Gatling simulations.
- Decide the total first - take the target concurrent users and requests per second from production analytics, then divide by the number of generators, never the other way round.
- Size the thread group per server - in JMeter distributed mode, set each thread group to the target divided by the number of servers.
- Watch generator health - the HyperExecute JMeter documentation traces a job that errors out well before the target user count to load generator resource exhaustion and points to the Task Metrics CPU and memory graph, so rule out the generators before blaming the application.
- Split test data - give each generator its own rows of CSV data so parallel users do not replay the same accounts and hit cache-warm paths.

Note: Running JMeter plans on TestMu AI HyperExecute? Set Total Users and the region split in the run form so HyperExecute divides the load across machines, then check the virtual user count in the Summary report. Start testing on TestMu AI
Conclusion
A closed model can pass a slow build: the 5-user k6 run kept p95 at 67.07 ms through a 20-second slowdown that the open run reported at 1 second. For public websites and APIs, drive load as an arrival rate taken from production traffic, read any arrival-shortfall counter next to the percentiles, and raise maxVUs until dropped iterations reach zero before trusting the numbers. Treat the 99th percentile of a short run with care, since one cold connection set it in the 61-sample JMeter run.
Author

Garvit Sukhija
Blogs: 5

Garvit Sukhija is a Technical Product Manager at TestMu AI, where he leads the HyperExecute GUI, having spearheaded its development and pilot rollout to early adopters by integrating user insights and metric analysis into the go-to-market strategy. Before TestMu AI he owned the zero-to-one build of an enterprise SaaS platform for Earth Observation at Pixxel, where he designed billing, subscription, and IAM systems and led AI/ML model onboarding for over 10 solutions. Garvit holds a degree in manufacturing engineering and chemistry from BITS Pilani.
Reviewer

Japneet Singh Chawla
Reviewer
Japneet Singh Chawla is an Engineering Manager at TestMu AI, where he leads a team driving HyperExecute, the AI-native Test Orchestration Cloud Platform, and integrations with Cypress, Provar, Tosca, and Selenium, improving test execution efficiency and driving adoption across 500+ enterprise clients. He also spearheaded zero-downtime deployments that cut release-related downtime by 90%, and mentors new engineers into productive contributors. He brings 9+ years of experience building and scaling distributed systems, SaaS platforms, and developer tools, with deep hands-on backend engineering across Golang, Python, Node.js, Kafka, and Redis. Earlier at Sumo Logic he built award-winning developer tools, including a VS Code Parser Linter, and at Indus Valley Partners he was a founding member of the Sentiment Analyzer team, building ML-powered solutions for financial clients. Japneet holds an MCA in Computer Science from GGSIPU.


Workload Model Benchmark FAQs
Did you find this page helpful?
More Related Blogs

TestMu AI forEnterprise
Get access to solutions built on Enterprise
grade security, privacy, & compliance
- Advanced access controls
- Advanced data retention rules
- Advanced Local Testing
- Premium Support options
- Early access to beta features
- Private Slack Channel
- Unlimited Manual Accessibility DevTools Tests