
Next-Gen App & Browser Testing Cloud
Trusted by 2 Mn+ QAs & Devs to accelerate their release cycles

- TestMu AI (Formerly LambdaTest)
- /
- Blog
- /
- May'26 Updates
May'26 Updates: KaneAI Gestures, SmartUI A/B Testing & More
What's new at TestMu AI in May: KaneAI drag-and-drop gestures, SmartUI A/B testing, manual app profiling, plus Accessibility, Test Manager and Insights updates.

Salman Khan
Author
June 30, 2026
Authoring a test and trusting its result are two different problems, and this month's updates chip away at both.
KaneAI now records the drag-and-drop and long-press gestures it couldn't capture before, and SmartUI stops failing builds over diffs that were never real bugs.
Real devices can finally reproduce offline mode, shake gestures, and custom clocks, while Accessibility, Test Manager, and Insights make the results that come back easier to act on. Here's everything that shipped.
KaneAI: Drag-and-Drop, New Click Gestures, and Smarter Retries
If you author tests in KaneAI, this release is for you: new gestures, a friendlier recording flow, and retries that behave the way you'd expect on HyperExecute.
Drag and Drop Support in KaneAI
Drag-and-drop has always been a pain to script. Not anymore. KaneAI now handles drag steps across Desktop Web, Android, iOS, and Mobile Web, and you author them however you like.
- Natural language: Just describe it, "drag Card A to Column B", and KaneAI turns it into a step.
- Manual interaction: Or perform the drag yourself on the viewport and let KaneAI record it.
- Cross-platform: Author once and run the same drag step on Desktop Web, Android, iOS, and Mobile Web.
Get started authoring drag and drop steps across web and mobile.
Press and Hold, Multi-Click, and Right Click Support in KaneAI
A single click doesn't cover every UI. KaneAI now supports long-press, multi-click, and right-click across Desktop Web, Android, iOS, and Mobile Web, authored in plain English or captured live.
- Press and hold: Long-press an element to trigger context menus, tooltips, or any hold-to-activate action.
- Multi-click (N-click): Double, triple, or N-click an element, all as one named step.
- Right-click: Fire context menus on Desktop Web to test the menu items behind them.
- Two ways to author: Describe it or record it, each variant gets its own step, icon, and pill label.
The docs cover how to add press and hold, multi-click, and right-click steps.
KaneAI Retries Now Trigger on Test Case Failures
Flaky tests happen, and retries are how you ride them out. Until now, KaneAI only retried when the testRunnerCommand failed. With the new retry_on_failure flag, an individual test-case failure triggers a retry too.
- retry_on_failure: Add it to your HyperExecute YAML to retry on test-case failures, not just runner errors.
- max_retries: Cap the number of attempts so you balance coverage against total run time.
- Heads up: This only works for code exported on or after May 10, 2026, so regenerate older exports to switch it on.
Walk through configuring KaneAI retries in your HyperExecute YAML.
Pause and Resume Recording in Manual Interaction
Need to step away mid-recording, or stop before you capture something you didn't mean to? You can now pause a Manual Interaction recording and pick up right where you left off.
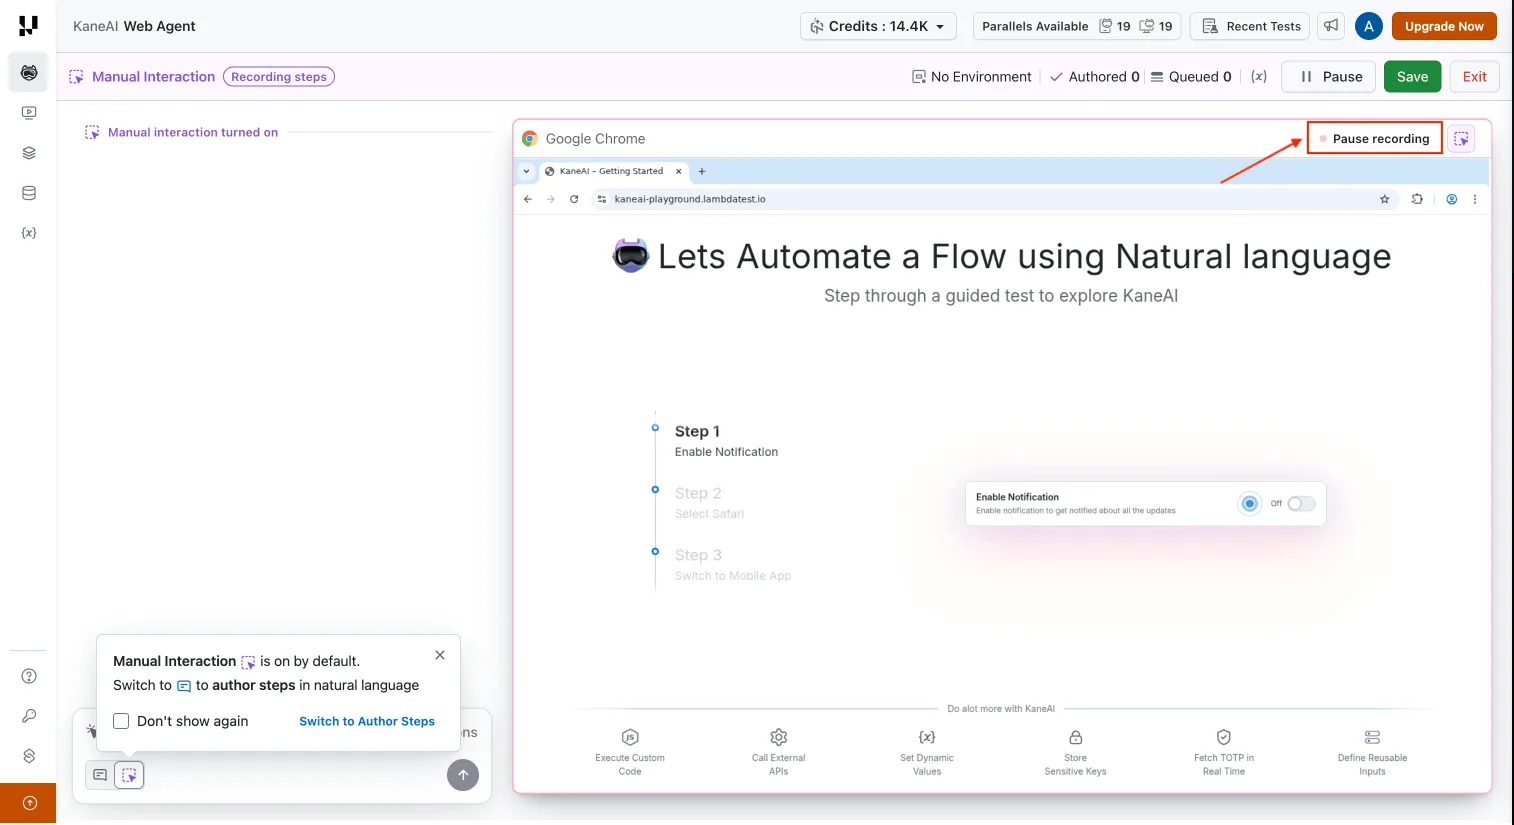
- Pause anytime: Stop recording so stray clicks don't end up in your test.
- Draft mode: Paused sessions drop into a draft state where you can review and edit captured steps.
- Resume cleanly: Start back up in the same session, no restart, nothing lost.
Follow the steps to pause and resume a Manual Interaction recording.
Validate KaneAI Code With Sample Run Execution
Validating generated code is now consistent across the board. The Code Validation flow runs everything through Sample Run Execution, so generated test cases play nicer with Test Runs, and the old restrictions are gone.
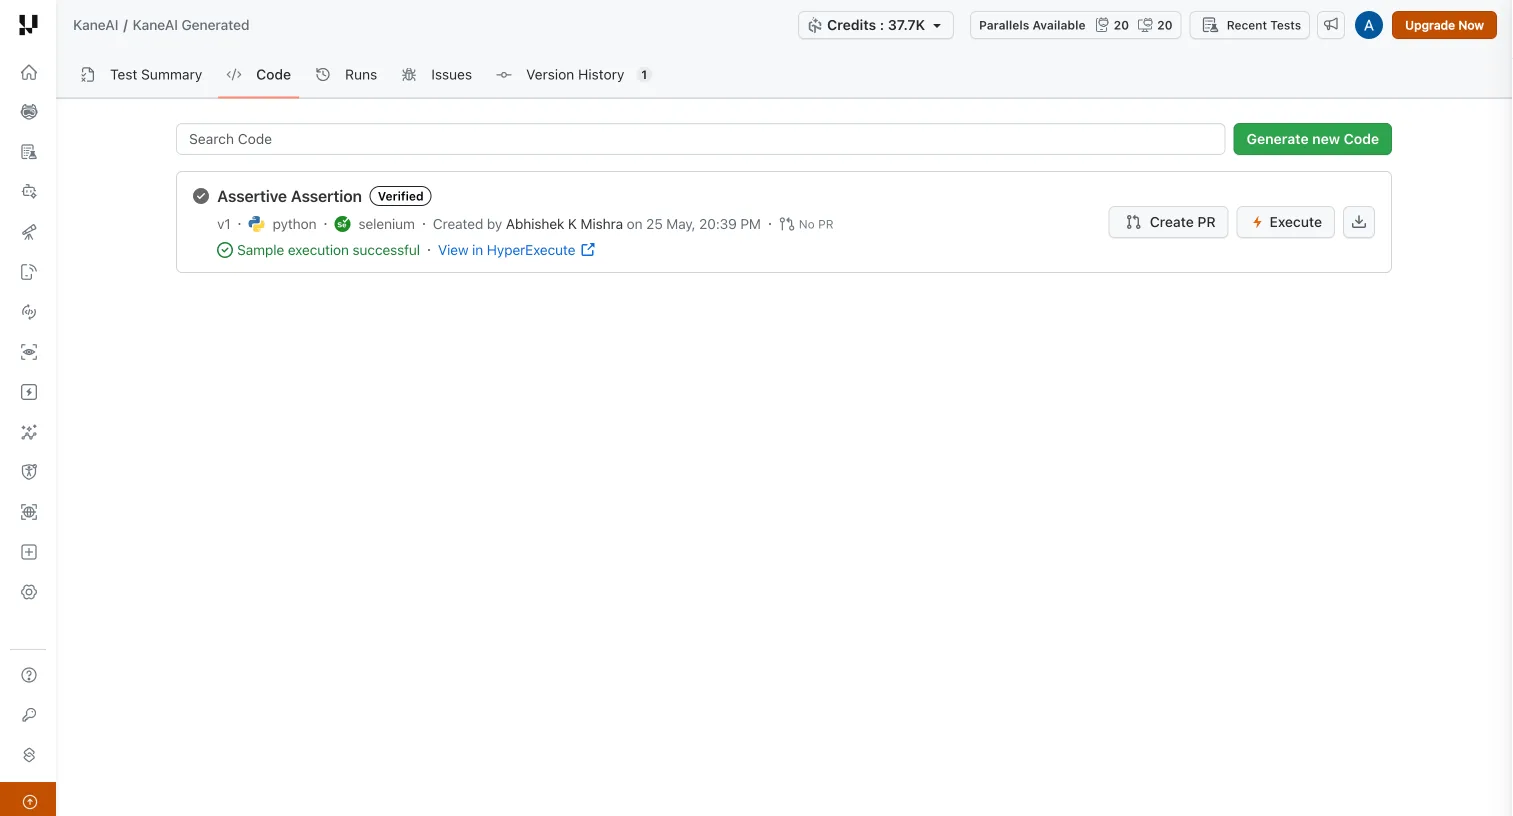
- Sample Run Execution: Validate generated code with a consistent sample run instead of the older, stricter flow.
- Fewer blockers: Generated test cases interact with Test Runs more smoothly.
Read how to validate generated code with a sample run.

SmartUI: A/B Baselines, Build Data Exports, and Screenshot Grouping
SmartUI, our Smart Visual UI Testing tool, focused on two things this release: cutting false positives, and making it easy to export results from the dashboard.
Export SmartUI Build Data
Need build results in a ticket, a spreadsheet, or a stakeholder update? You can now export build-level data straight from the SmartUI dashboard, no CLI, no API.
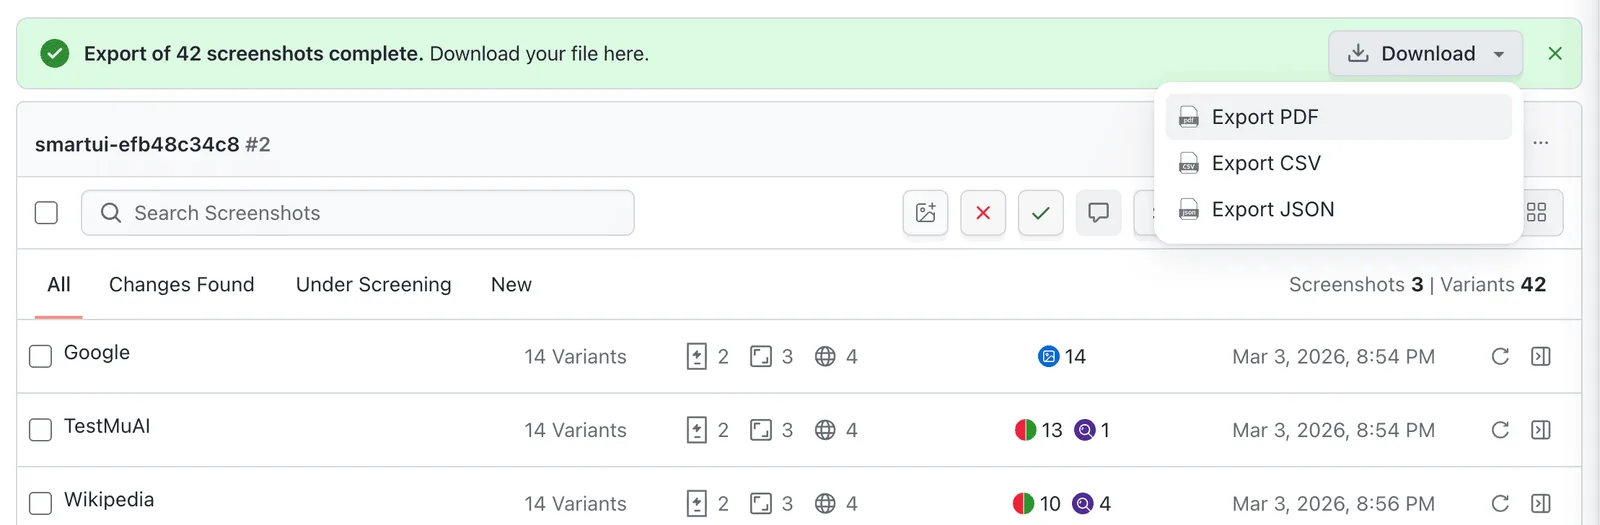
- JSON: Structured data for downstream automation or other tools.
- CSV: Drop it into a spreadsheet for reporting or side-by-side comparison.
- PDF: A clean, print-ready snapshot to share.
Check the docs to export SmartUI build data as JSON, CSV, or PDF.
Keep Multiple Baselines With SmartUI A/B Testing
Ever had a visual test fail because the page legitimately looks different, an A/B variant, a feature flag, a different locale? SmartUI A/B testing fixes that.
A single screenshot or PDF page can hold up to 20 approved baselines (variations), and every capture is checked against all of them.
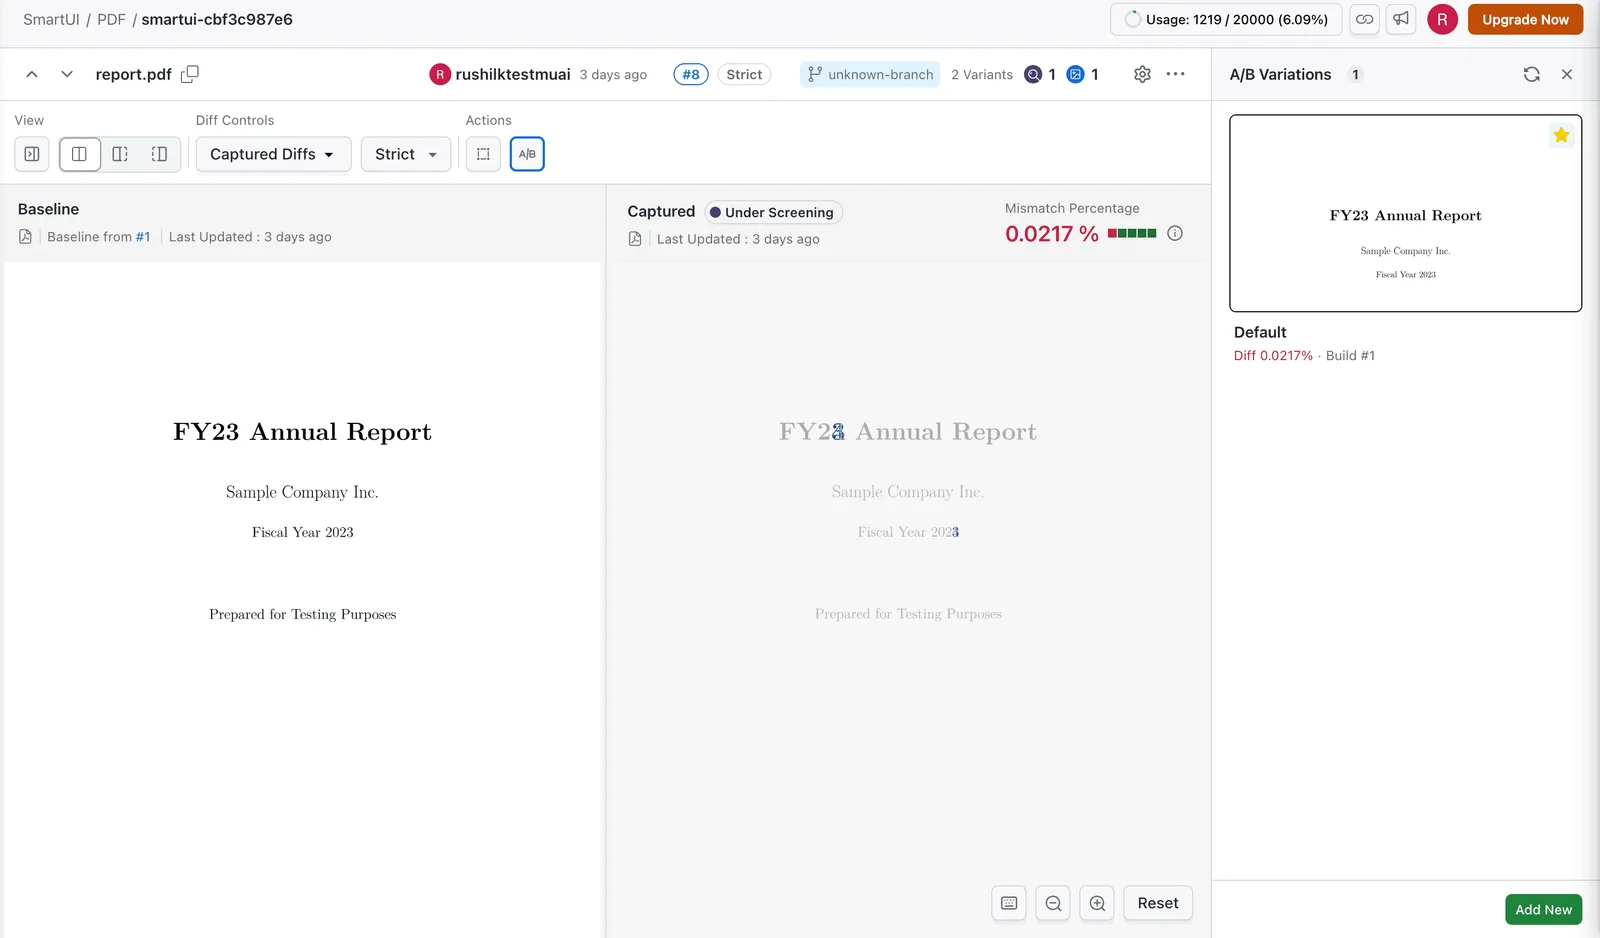
- Multiple variations: Keep up to 20 approved baselines under one name instead of splitting into separate screenshot names.
- Closest-match comparison: Each capture is checked against every active variation, and SmartUI flags the closest with a "Matched with" status.
- Fewer false positives: Cover A/B tests, feature flags, themes, locales, and PDF variants without flagging valid diffs as regressions.
- Wrap it up: When you're done, end the experiment by picking the winning variation.
Explore how to manage baseline variations for A/B testing.
Group SmartUI Screenshots by Test Case
Hunting for the right screenshot in a flat list is nobody's favorite task. Now you can group build-view screenshots by test case, and move between Automation and SmartUI pages without losing context.
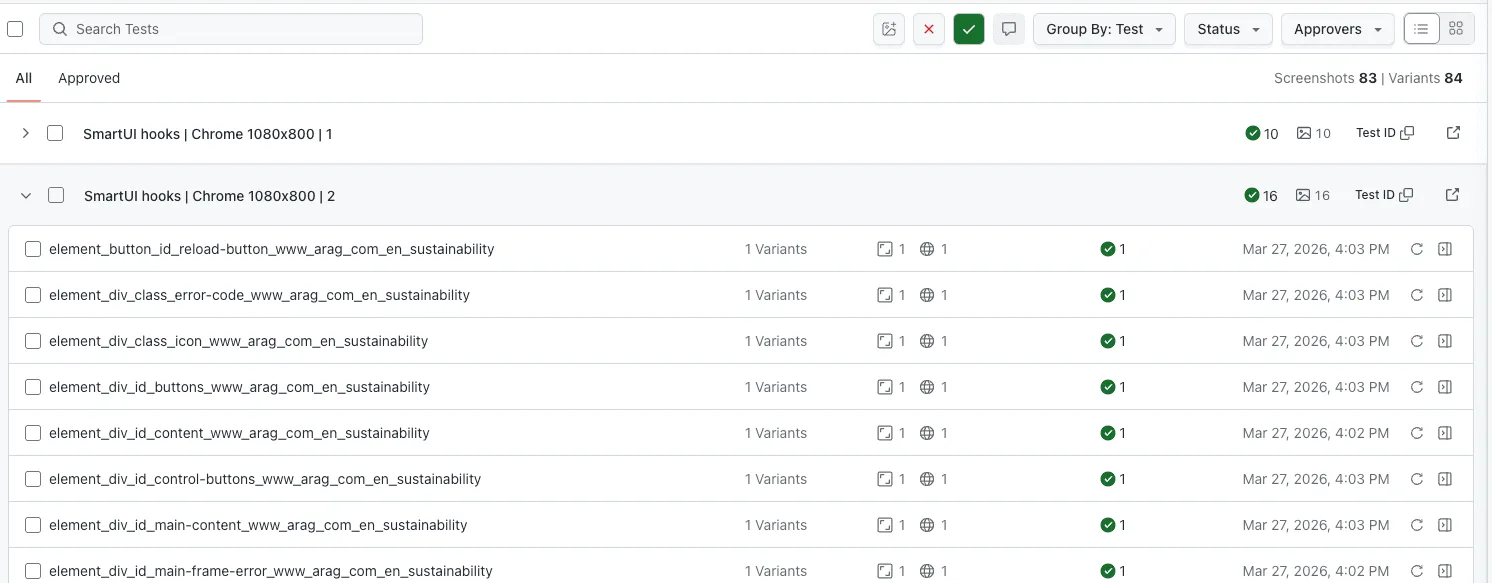
- Group by test case: Related screenshots stay together instead of in one long list.
- Automation to SmartUI: Jump from an Automation test straight to its screenshots, and back.
- Faster triage: Less hunting, more time on the diffs that actually matter.
Tidy up the build view and group SmartUI screenshots by test case.
Real Devices: Offline Mode, Shake Gestures, and Manual App Profiling
Real-world conditions are where apps actually break. This release lets you reproduce a lot more of them on the Real Device Cloud, and finally keeps a record of your manual sessions.
Offline Mode Support for Virtual Devices
Want to see how your app handles a dropped connection? Start a virtual-device session in offline mode with a single desired capability, set networkProfile to offline, and the device boots with no network.
- One capability: Setting networkProfile to offline disables the network from the first moment of the session.
- Zero manual setup: The device launches in the right network state automatically, so runs stay repeatable.
- Offline-first testing: Validate error handling, cached content, and offline behavior under real no-network conditions.
Set up a session to start a virtual device in offline mode.
Shake Gesture Support for iOS Devices in App Automation
Plenty of apps hide debug menus, build switchers, or "undo" behind a shake. You can now trigger a shake gesture in your Appium automation on iOS real devices and simulators.
- iOS real devices: Shake physical devices running your app under test.
- iOS simulators: Same gesture on simulators for quicker feedback in CI.
- Real use cases: Debug menus, prod/staging switchers, in-app feedback prompts, and shake-to-undo.
The docs show how to trigger a shake gesture on iOS devices.
Set a Custom Date, Time, and Hour Format on Real Devices
Time-sensitive logic like reminders, expiry, and scheduling is hard to test if you can't control the clock.
Now you can set a custom date, time, 12- or 24-hour format, and the auto-time toggle on real iOS (14+) and Android (10+) devices, in manual sessions or via Appium hooks.
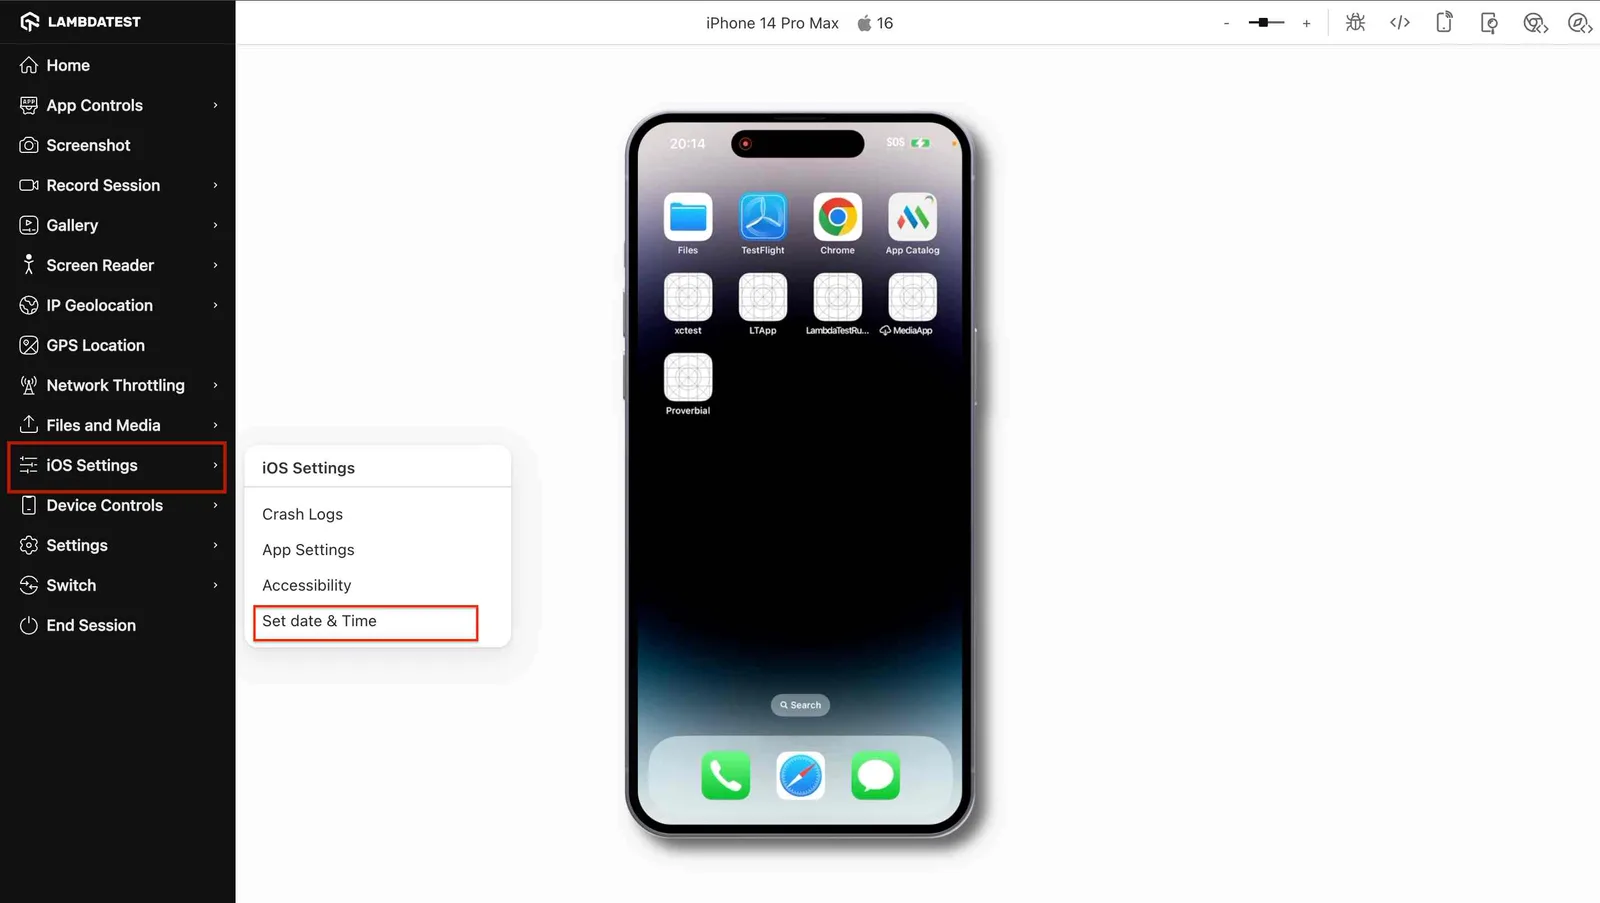
- Custom date and time: Set any date and time to exercise reminders, expiry flows, and scheduling.
- 12- or 24-hour format: Check that your app renders times correctly in both.
- Auto-time toggle: Flip the device's automatic date and time on or off.
- Manual or automated: Apply it live in a session or pass it through Appium hooks.
The full guide covers how to set the date, time, and hour format on a real device.
Profile App Performance During Manual Sessions
Automated profiling in your CI/CD pipeline is valuable, but sometimes you need to exercise the app yourself and watch what happens.
Manual App Profiling shows you live performance metrics on real devices as you interact.
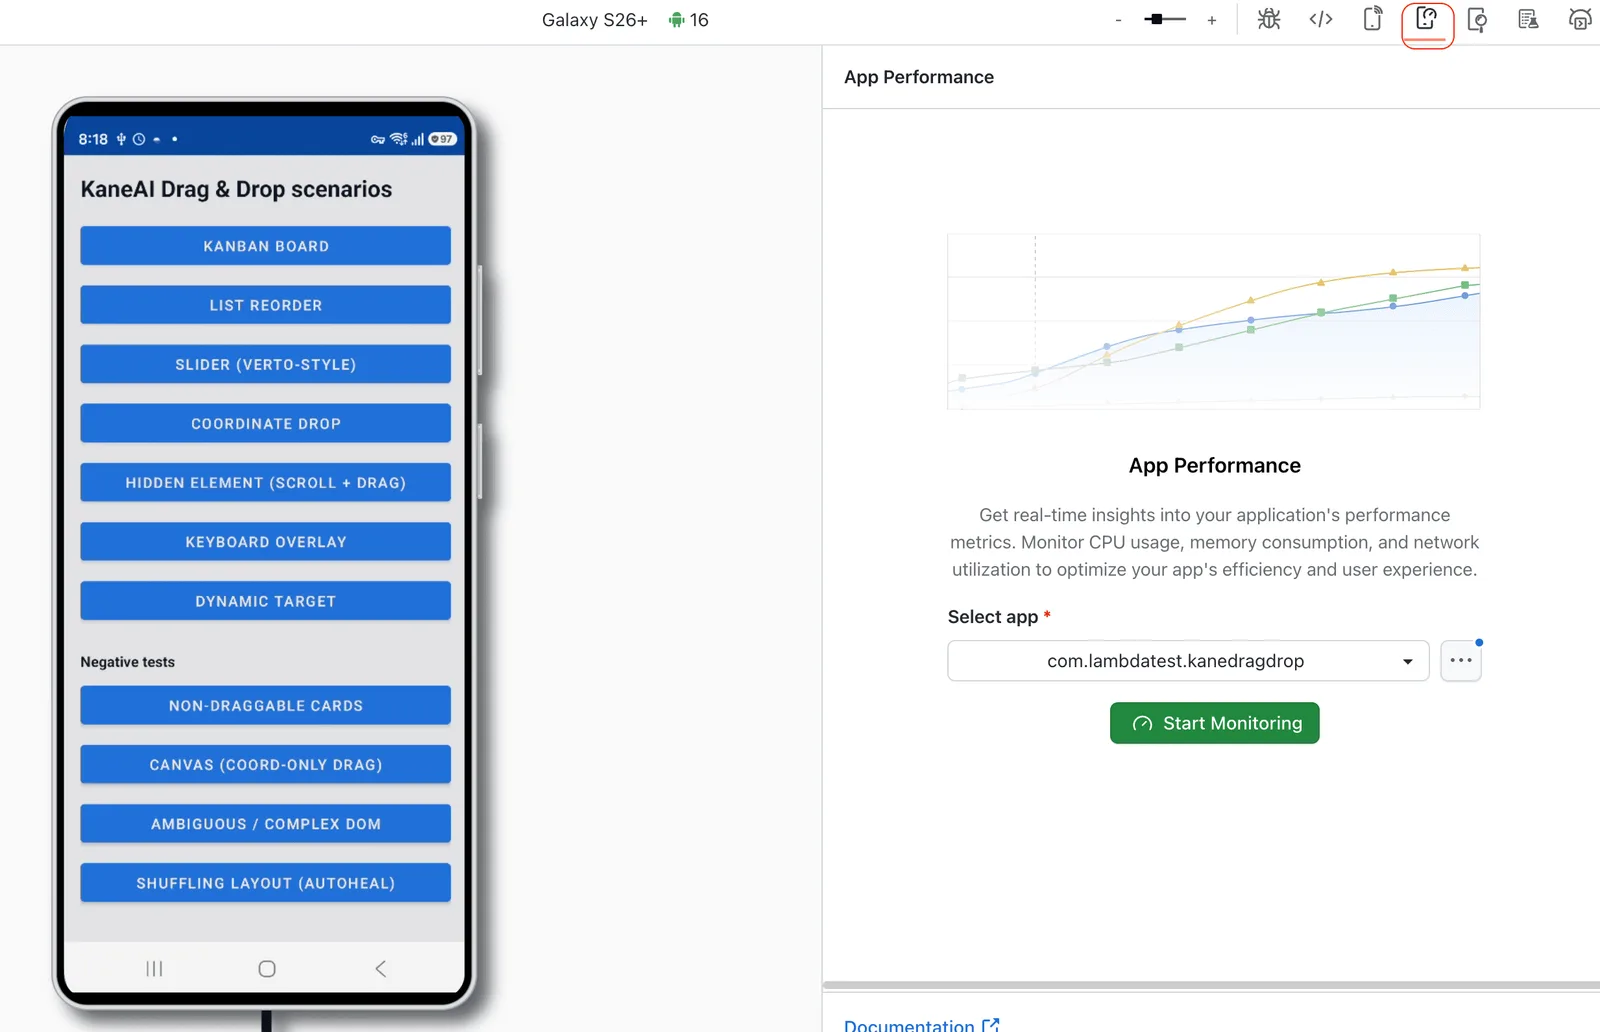
- Live metrics: CPU, memory, disk, FPS, network, battery, ANR, and startup time, updating in real time as you tap around.
- Real hardware: Profile during manual sessions, not just automated runs.
- Catch it early: Spot regressions and resource spikes as they happen instead of digging through logs later.
Learn how to profile your app's performance on real devices.
Track Every Manual Session in One Dashboard
Manual sessions used to vanish the moment you closed them. Not anymore, the Manual Tests Sessions Dashboard keeps a record of every manual session across your Real Devices products.
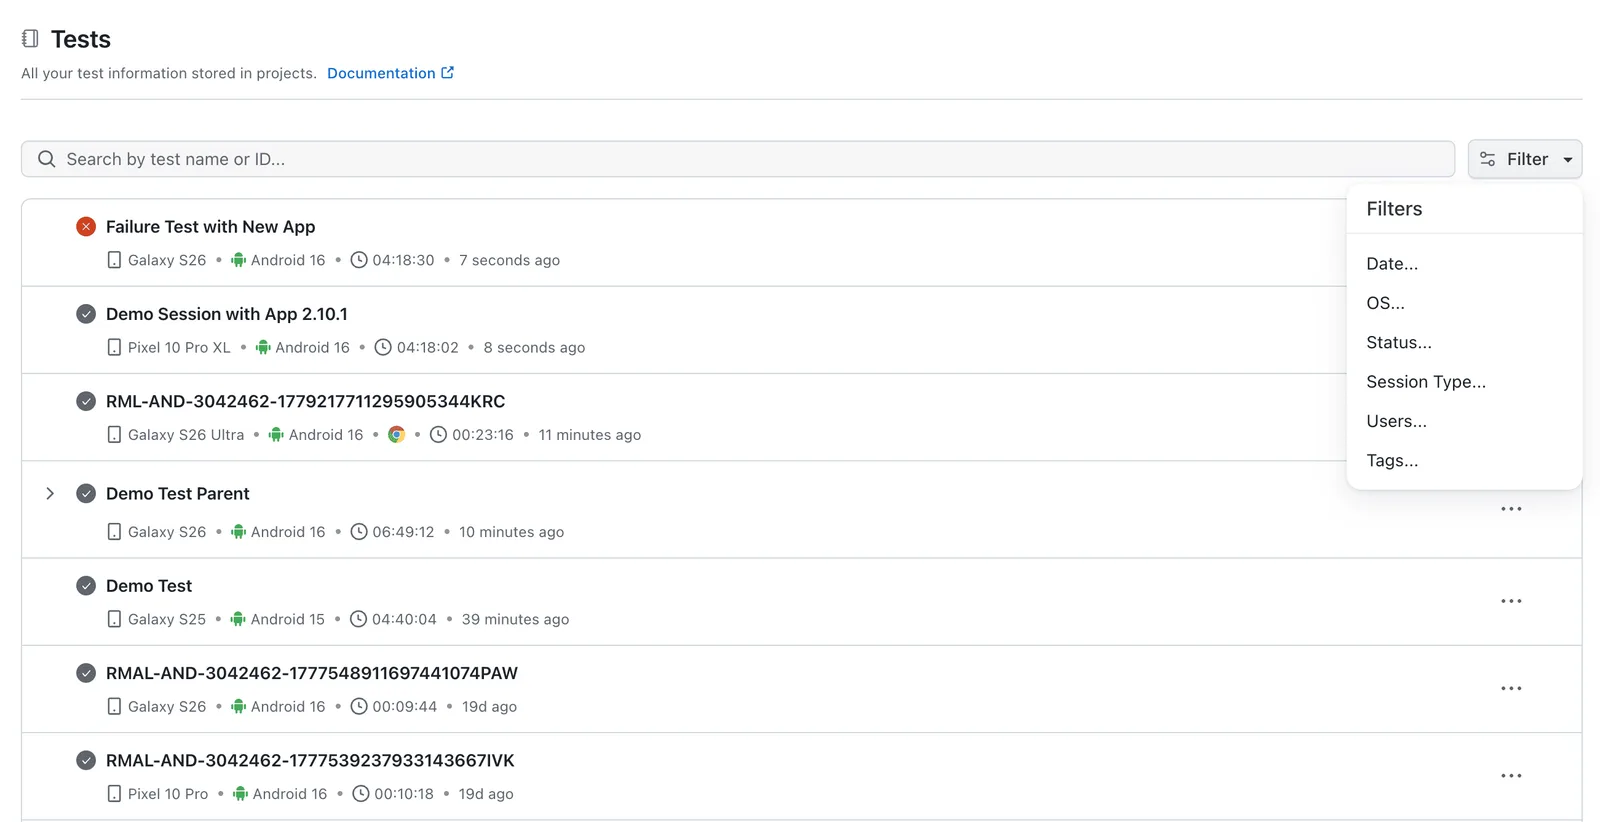
- One view: Every manual session across Real Devices in a single place.
- Auto-captured: Your App Live and Browser Live sessions are saved automatically.
- Real history: Revisit past sessions to track activity, spot trends, and build reports.
Head to the docs to track every manual session in one dashboard.

Accessibility: Mobile Scan Tags and Hide/Restore for Web Issues
Findings from Accessibility Automation are only useful if you can find the ones that matter. Two updates make that easier, one on mobile, one on web.
Tag Support for Mobile Accessibility Scans
Sorting accessibility scans by raw view identifiers is rough. Now you can tag mobile scans with names that actually mean something, "Login Screen", "Cart Screen", "Profile Screen", and filter by them.
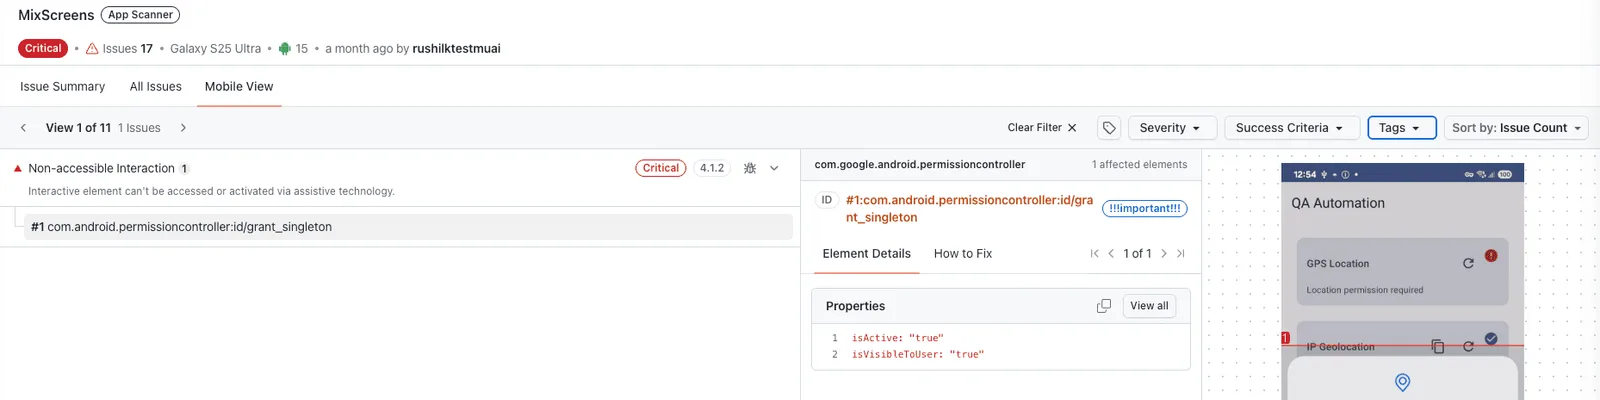
- Label by screen or flow: Tag scans by onboarding step, checkout flow, or nav menu, whatever maps to your app.
- Filter the dashboard: Pull up results for one screen or flow without scrolling past the rest.
- Tag in automation: Apply tags at scan time with the lambda-accessibility-scan command.
- Tag after the fact: Add or edit tags on finished scans from the dashboard, no rerun needed.
- Up to 20 tags: 20 per scan, 50 characters each, for those multi-screen journeys.
See how to tag and filter mobile accessibility scans.
Hide and Restore Web Scan Issues
Not every finding is something you'll act on, some are known, accepted, or out of scope. You can now hide those web-scan issues without deleting them, and restore them whenever you want.
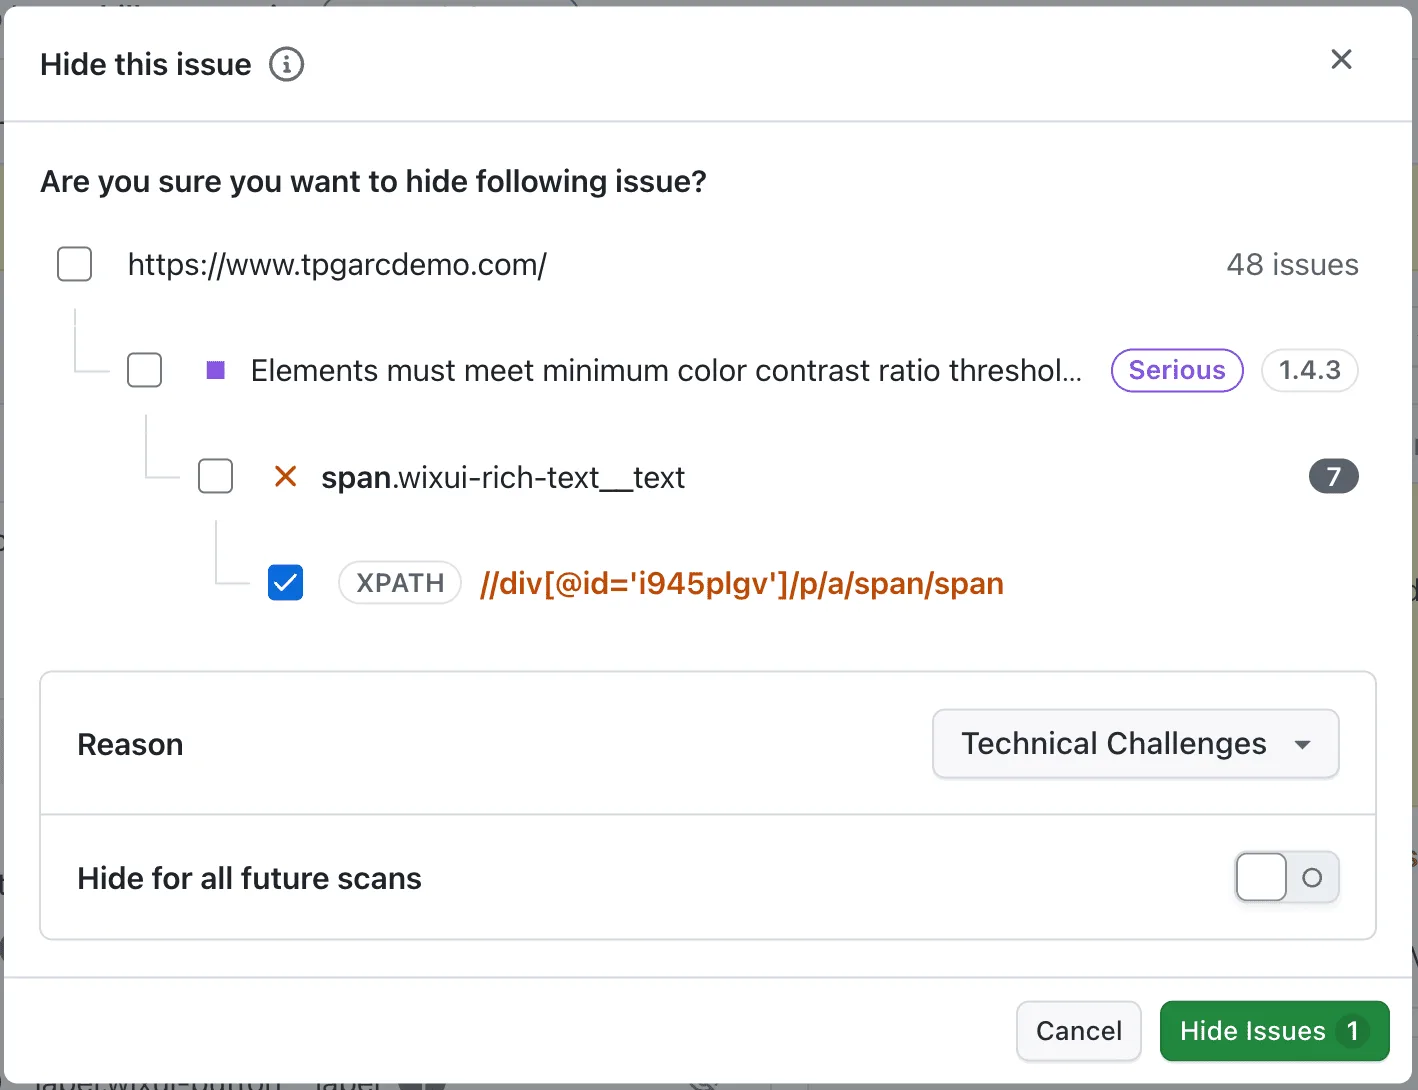
- Hide, don't delete: Suppress issues at the scan, page, or individual level so reports stay focused on what's actionable.
- Capture a reason: Note why an issue was hidden so the team has context later.
- Restore anytime: Nothing's gone for good, bring hidden issues back when you're ready.
- Carry forward: For supported scheduled scans, apply the same preference to future runs so you skip re-hiding known issues.
Find out how to hide and restore web scan issues.
Test Manager: Jira and ADO Issue Linking Plus Defect Widgets
Test Manager's updates keep defects right next to the tests that found them, and make team workload easy to read.
Issue Linking and Enhanced Bug Visibility in Test Runs
Linking a bug to the test that caught it shouldn't be a chore. You can now link existing Jira or ADO tickets directly to test instances and individual steps inside a Test Run.
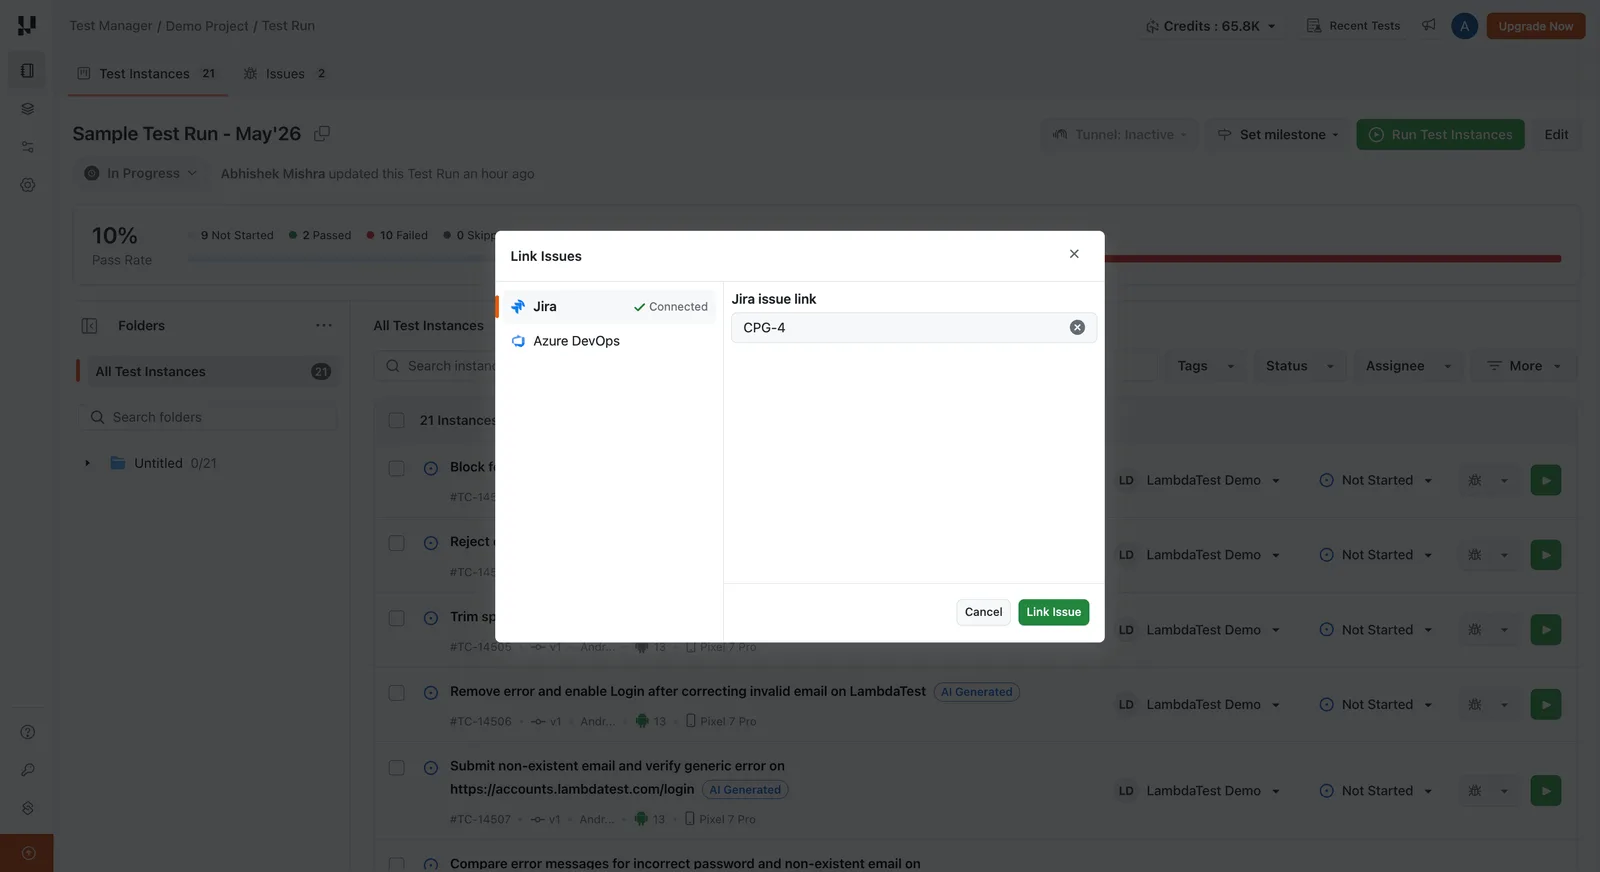
- Instance and step-level linking: Attach Jira or ADO tickets at the instance or step level, right from the Test Run.
- Auto-propagation: Step-level defects roll up to the parent instance on their own.
- Auto-link on execution: Bugs raised during manual or automated runs link to the right instance automatically.
- Filter by test case: Triage the Issues tab one test case at a time.
Reference the docs to link Jira and ADO issues in Test Runs.
Track Defects and Tester Workload With New Test Manager Widgets
Two new widgets land on the Test Manager Insights dashboard, and both respect your existing date range and filters.
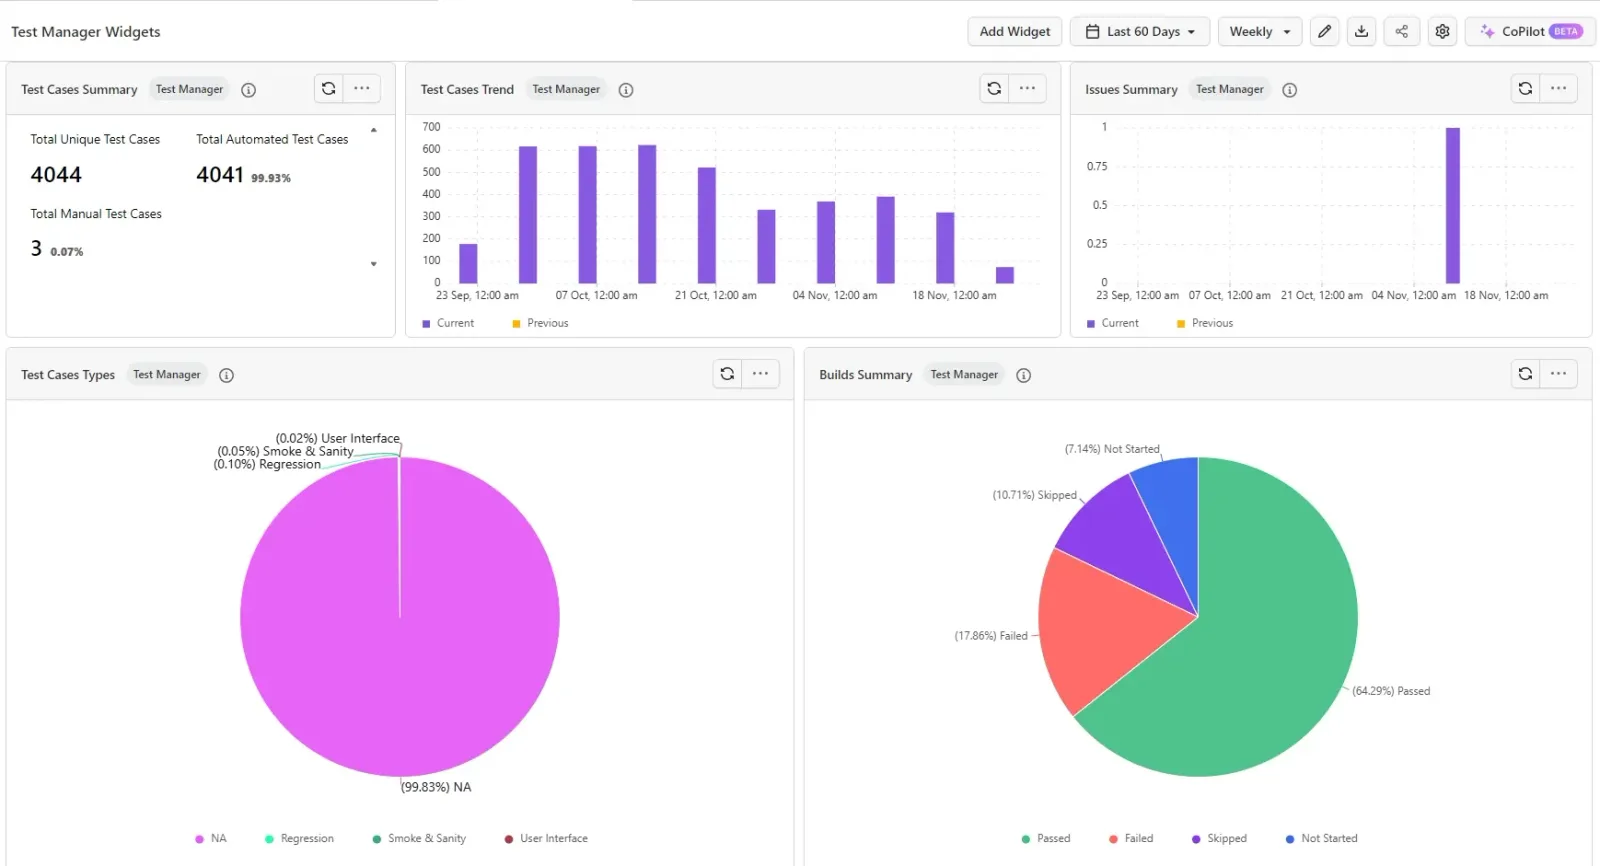
- Defects by Severity: Linked defects grouped Critical / High / Medium / Low, each with status, age, and a direct Jira link.
- Tester Assignment: Each tester's runs by status, Passed, Failed, In Progress, Blocked, Not Executed, to read workload at a glance.
- Easy to add: Drop either one onto any Test Manager dashboard from the widget library.
Discover how to add the Defects by Severity and Tester Assignment widgets.
Insights: App Profiling Dashboard Revamp and RCA API Parity
The Insights updates are all about one thing: what you see in the dashboard and what you get from the data should match.
App Profiling Insights Dashboard Revamp
App Profiling Insights got a full rebuild, new widgets, compare mode, SLA thresholds, and filters that hit every widget at once. It also reads Advanced App Profiling data now, currently in beta.
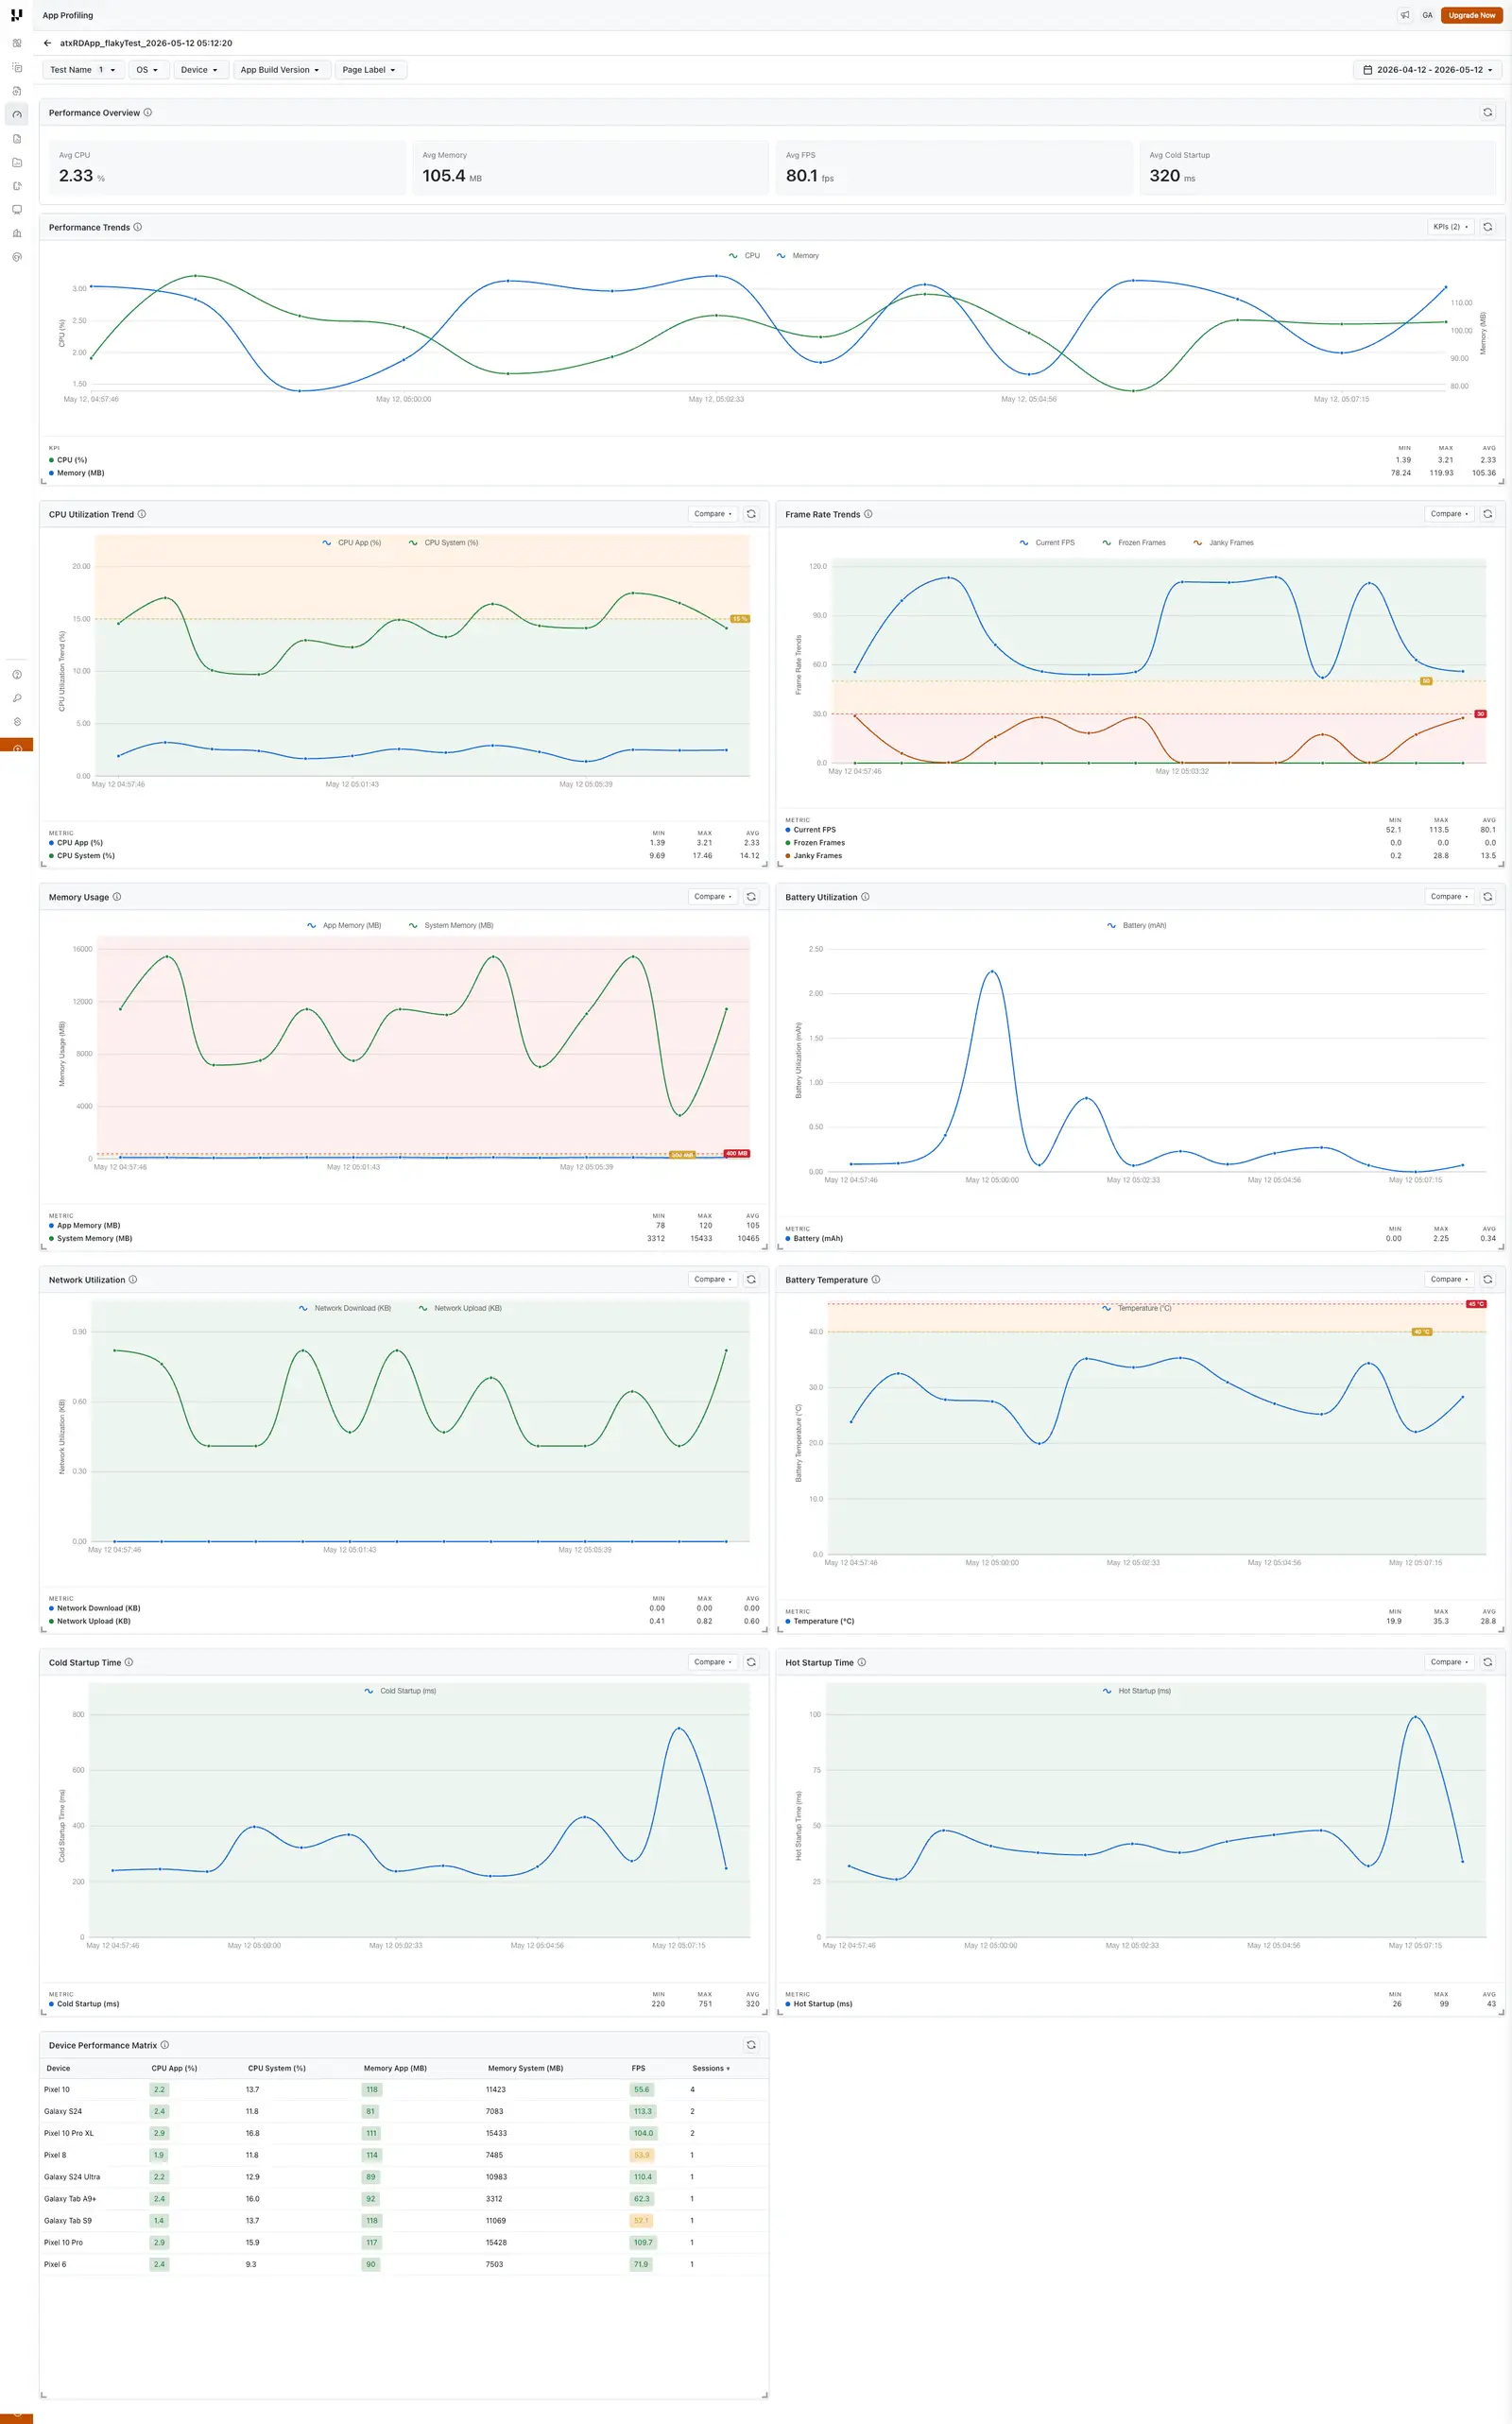
- Dashboard-level filters: Test Name, OS, Device, App Build Version, Page Label, and Date Range, applied across every widget.
- New widgets: Performance Overview, Performance Trends, a Device Performance Matrix with cell-level SLA coloring, and Label Page Load Time.
- Compare mode: Overlay metrics across OS, device, build, or label to catch regressions fast.
- SLA thresholds: Set org-level SLAs and get green / amber / red bands wherever the metric appears.
Tour the rebuilt App Profiling Insights dashboard.
RCA APIs Now Return What the UI Shows
If you pull root cause analysis through the API, it now matches the UI, no more older RCA version coming back from the endpoints.
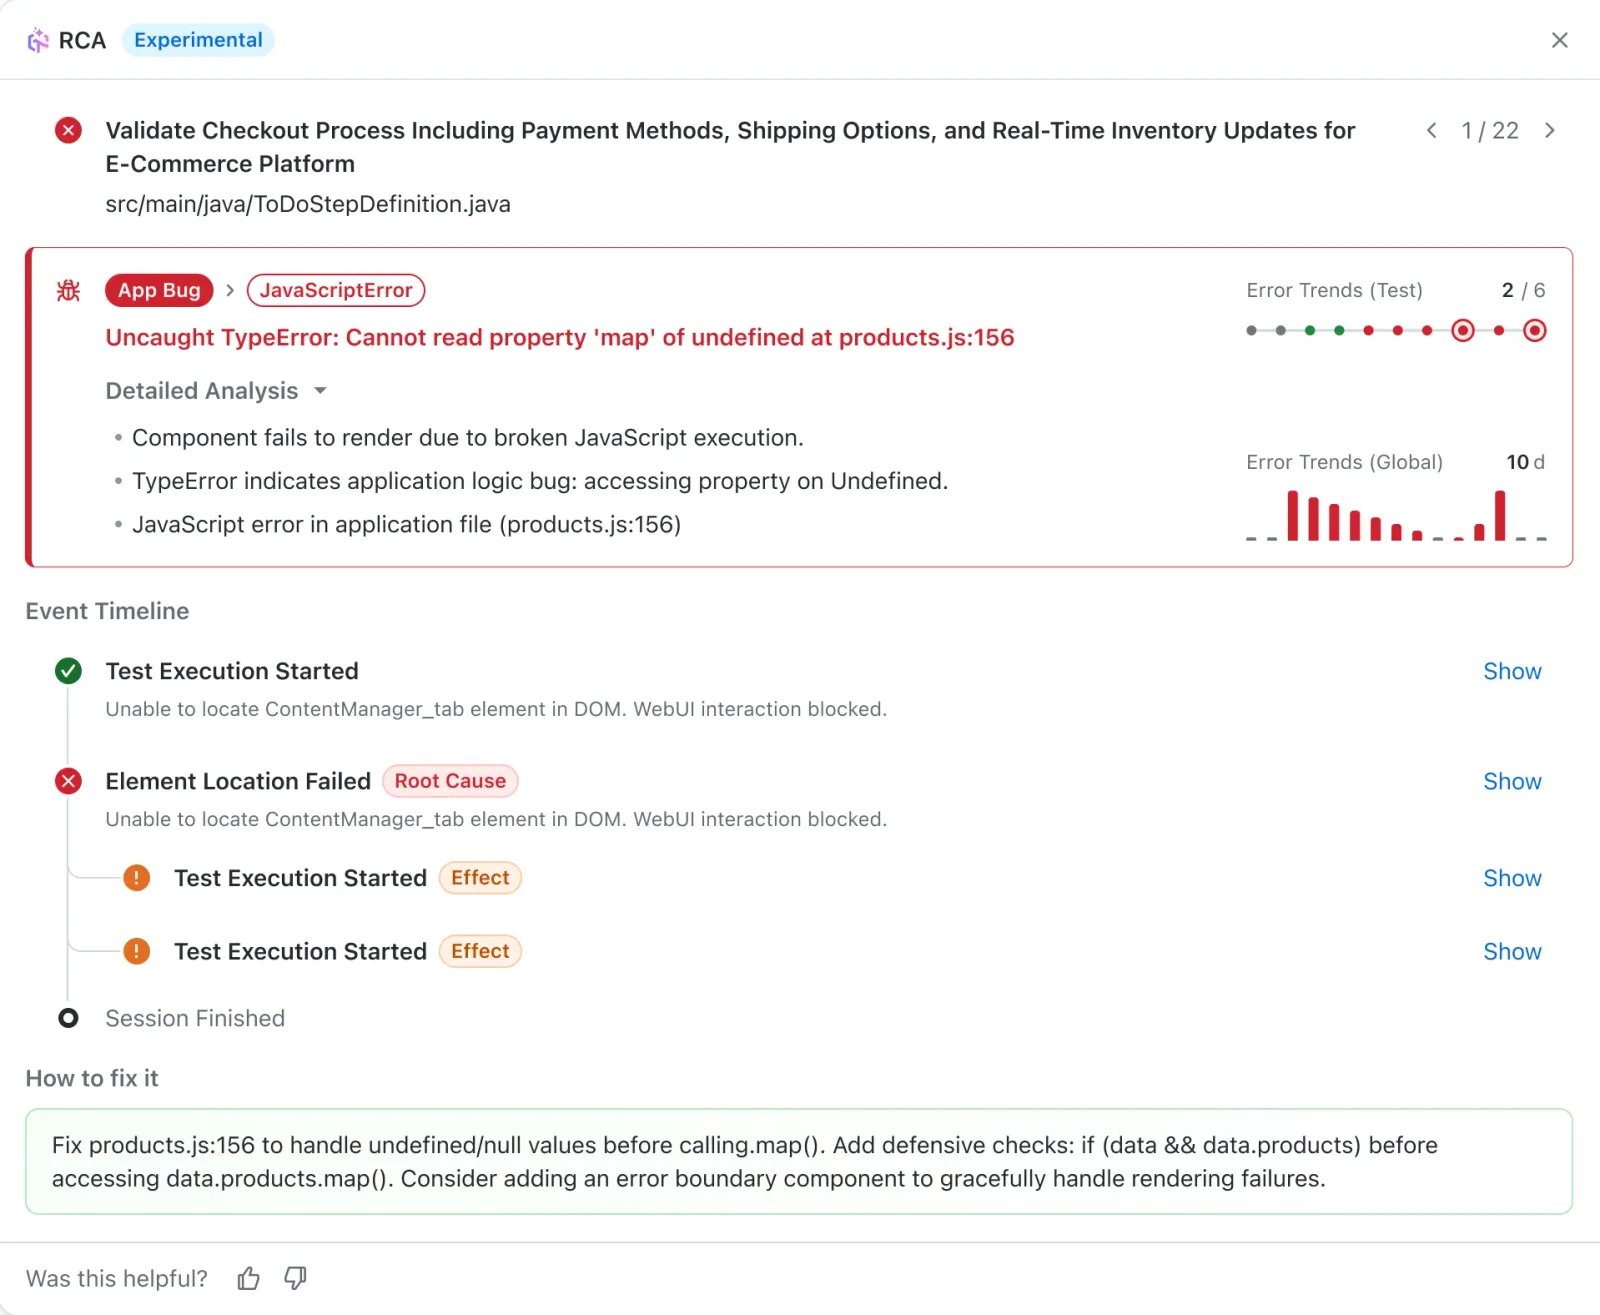
- UI parity: API responses match the RCA in the dashboard, so your automation and the UI stay in sync.
- Trigger and fetch: Kick off an AI-powered RCA for a failure and pull the result programmatically.
You can trigger and fetch an AI-powered root cause analysis directly through the API.
Jump From the Daily Test Summary Straight to Your Tests
The Automation Daily Test Summary from Insights is now clickable. Drill from a status straight into the underlying tests instead of finding them yourself.
- Drill-down links: Click any status to open the matching tests directly.
- Faster triage: Go from the summary to the exact passing or failing tests in one click.
Categorize Playwright Failures From Command Logs
Failure categorization now works in HyperExecute for Playwright too. The command-log fallback already on Selenium, Appium, and non-HyperExecute Playwright now covers it as well.
- Command-log fallback: No remark? The category is derived from the last failing Playwright command log.
- Framework parity: Consistent categorization across Selenium, Appium, and Playwright, including HyperExecute runs.
See how TestMu AI classifies test failures into categories.
Summing Up!
That's a lot of ground, but it all points the same way: fewer fights with your tooling, more signal from your results.
Author richer gestures in KaneAI, stop chasing false positives in SmartUI, and reproduce the real-world conditions that actually break mobile apps.
Keep your accessibility and defect data organized, and trust that your APIs and dashboards finally tell the same story.
Every feature above links out to the docs if you want to go deeper. Start testing on TestMu AI.
Author
Salman Khan
Blogs: 125
Salman is a Test Automation Evangelist and Community Contributor at TestMu AI, with over 6 years of hands-on experience in software testing and automation. He has completed his Master of Technology in Computer Science and Engineering, demonstrating strong technical expertise in software development, testing, AI agents and LLMs. He is certified in KaneAI, Automation Testing, Selenium, Cypress, Playwright, and Appium, with deep experience in CI/CD pipelines, cross-browser testing, AI in testing, and mobile automation. Salman works closely with engineering teams to convert complex testing concepts into actionable, developer-first content. Salman has authored 120+ technical tutorials, guides, and documentation on test automation, web development, and related domains, making him a strong voice in the QA and testing community.


Did you find this page helpful?
More Related Blogs
TestMu AI forEnterprise
Get access to solutions built on Enterprise
grade security, privacy, & compliance
- Advanced access controls
- Advanced data retention rules
- Advanced Local Testing
- Premium Support options
- Early access to beta features
- Private Slack Channel
- Unlimited Manual Accessibility DevTools Tests