Manual Tests Sessions Dashboard
The Manual Tests Sessions Dashboard provides a unified view of all your manual testing sessions across TestMu AI Real Devices products. It converts ephemeral manual sessions into structured historical records, helping you track, analyze, and report on your manual testing activity.
All your Real Devices App Testing (App Live) and Real Devices Browser Testing (Browser Live) sessions are automatically stored on this dashboard.
The Manual Tests Sessions Dashboard is a newly launched feature. To get it enabled for your organization, please reach out to our 24x7 Chat Support or mail us at [email protected].
Supported Session Types
Currently, the dashboard supports manual testing sessions run on Real Devices.
| Product | Platform | Session Type |
|---|---|---|
| Real Devices App Testing (App Live) | Android, iOS | App Testing |
| Real Devices Browser Testing (Browser Live) | Android, iOS | Browser Testing |
Support for Virtual Devices sessions is coming soon.
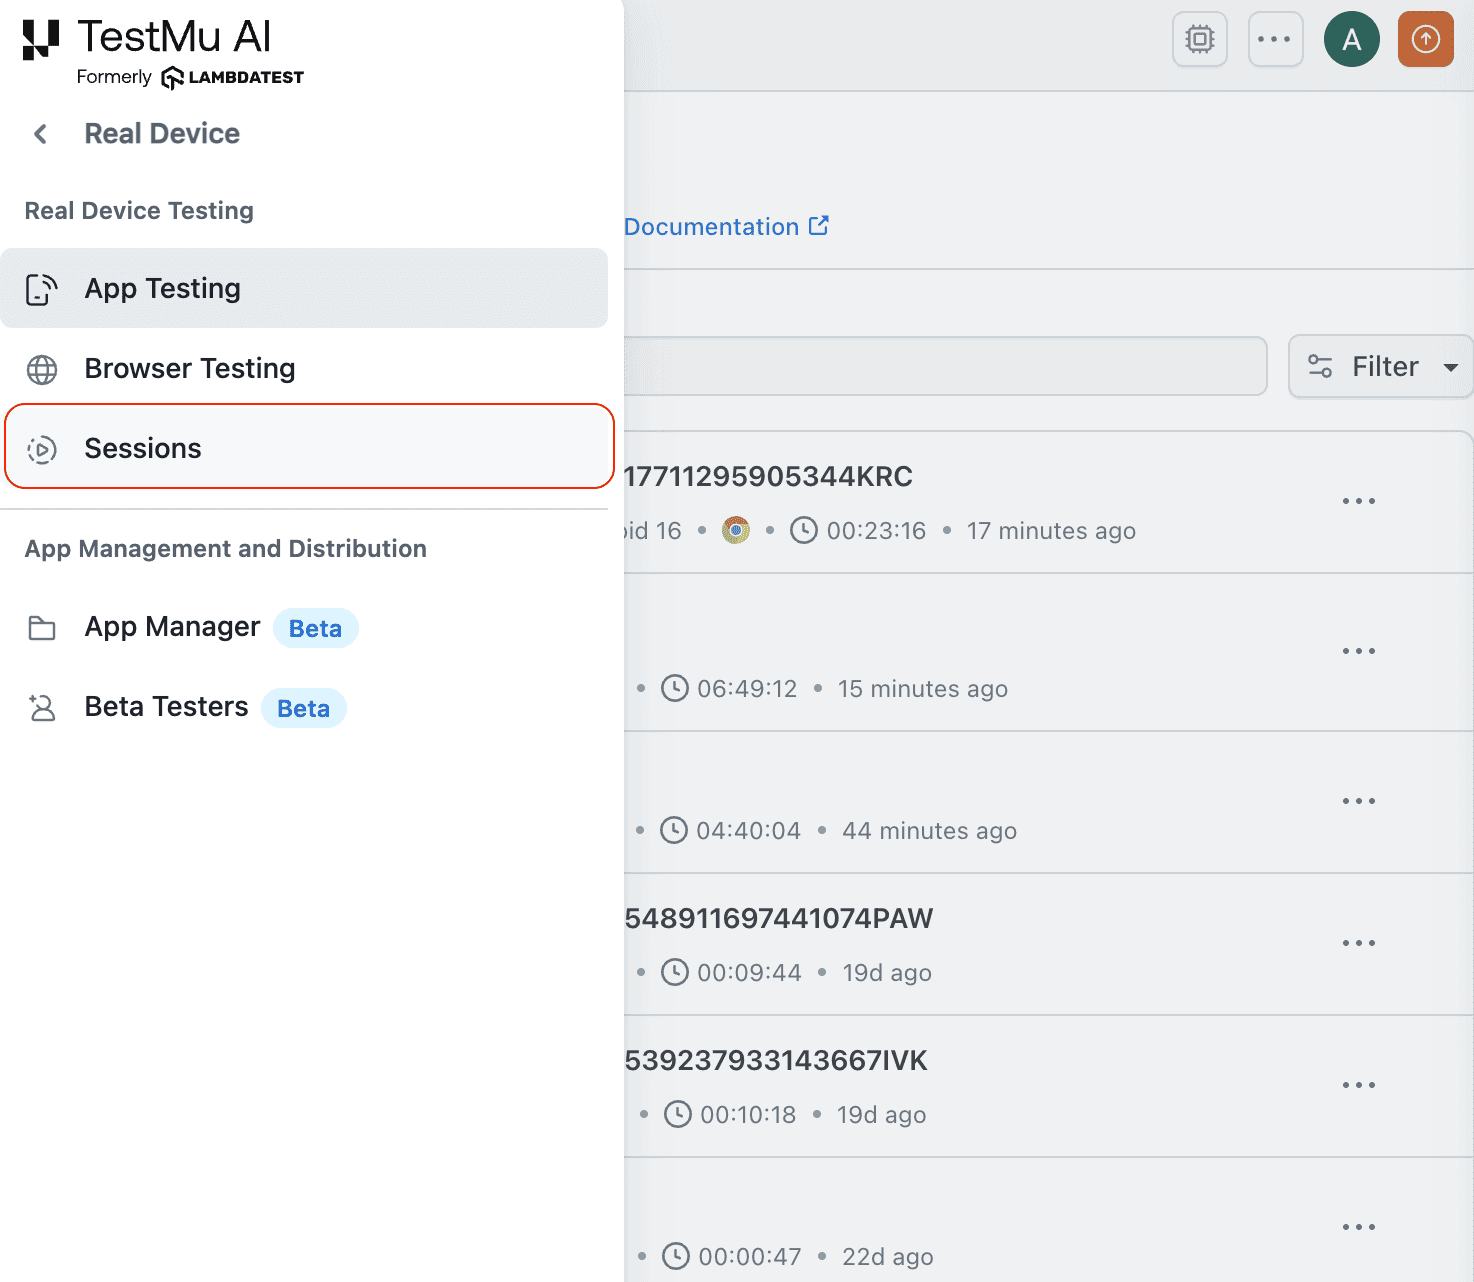
Accessing the Dashboard
Navigate to Real Devices > Sessions from the sidebar to open the Manual Tests Sessions Dashboard.
Dashboard List View
The dashboard displays all completed manual testing sessions in a list format. Each session row shows:
- Test Name: Session name, set when ending the session or edited later via rename.
- Test ID: Unique session identifier (for example,
RMAL-AND-164519-...). - Session Type: App Testing or Browser Testing.
- Platform & Device: OS icon, device name, and OS version.
- Duration: Total session time.
- Status: Session outcome (Passed, Failed, or Completed).
- Performance Tag: Indicates the session has profiling data. Click the chevron to expand and view its profiling tests.
- Tags: Custom tags assigned to the session (up to 10 per session).
- Remark: User-added notes (up to 256 characters).
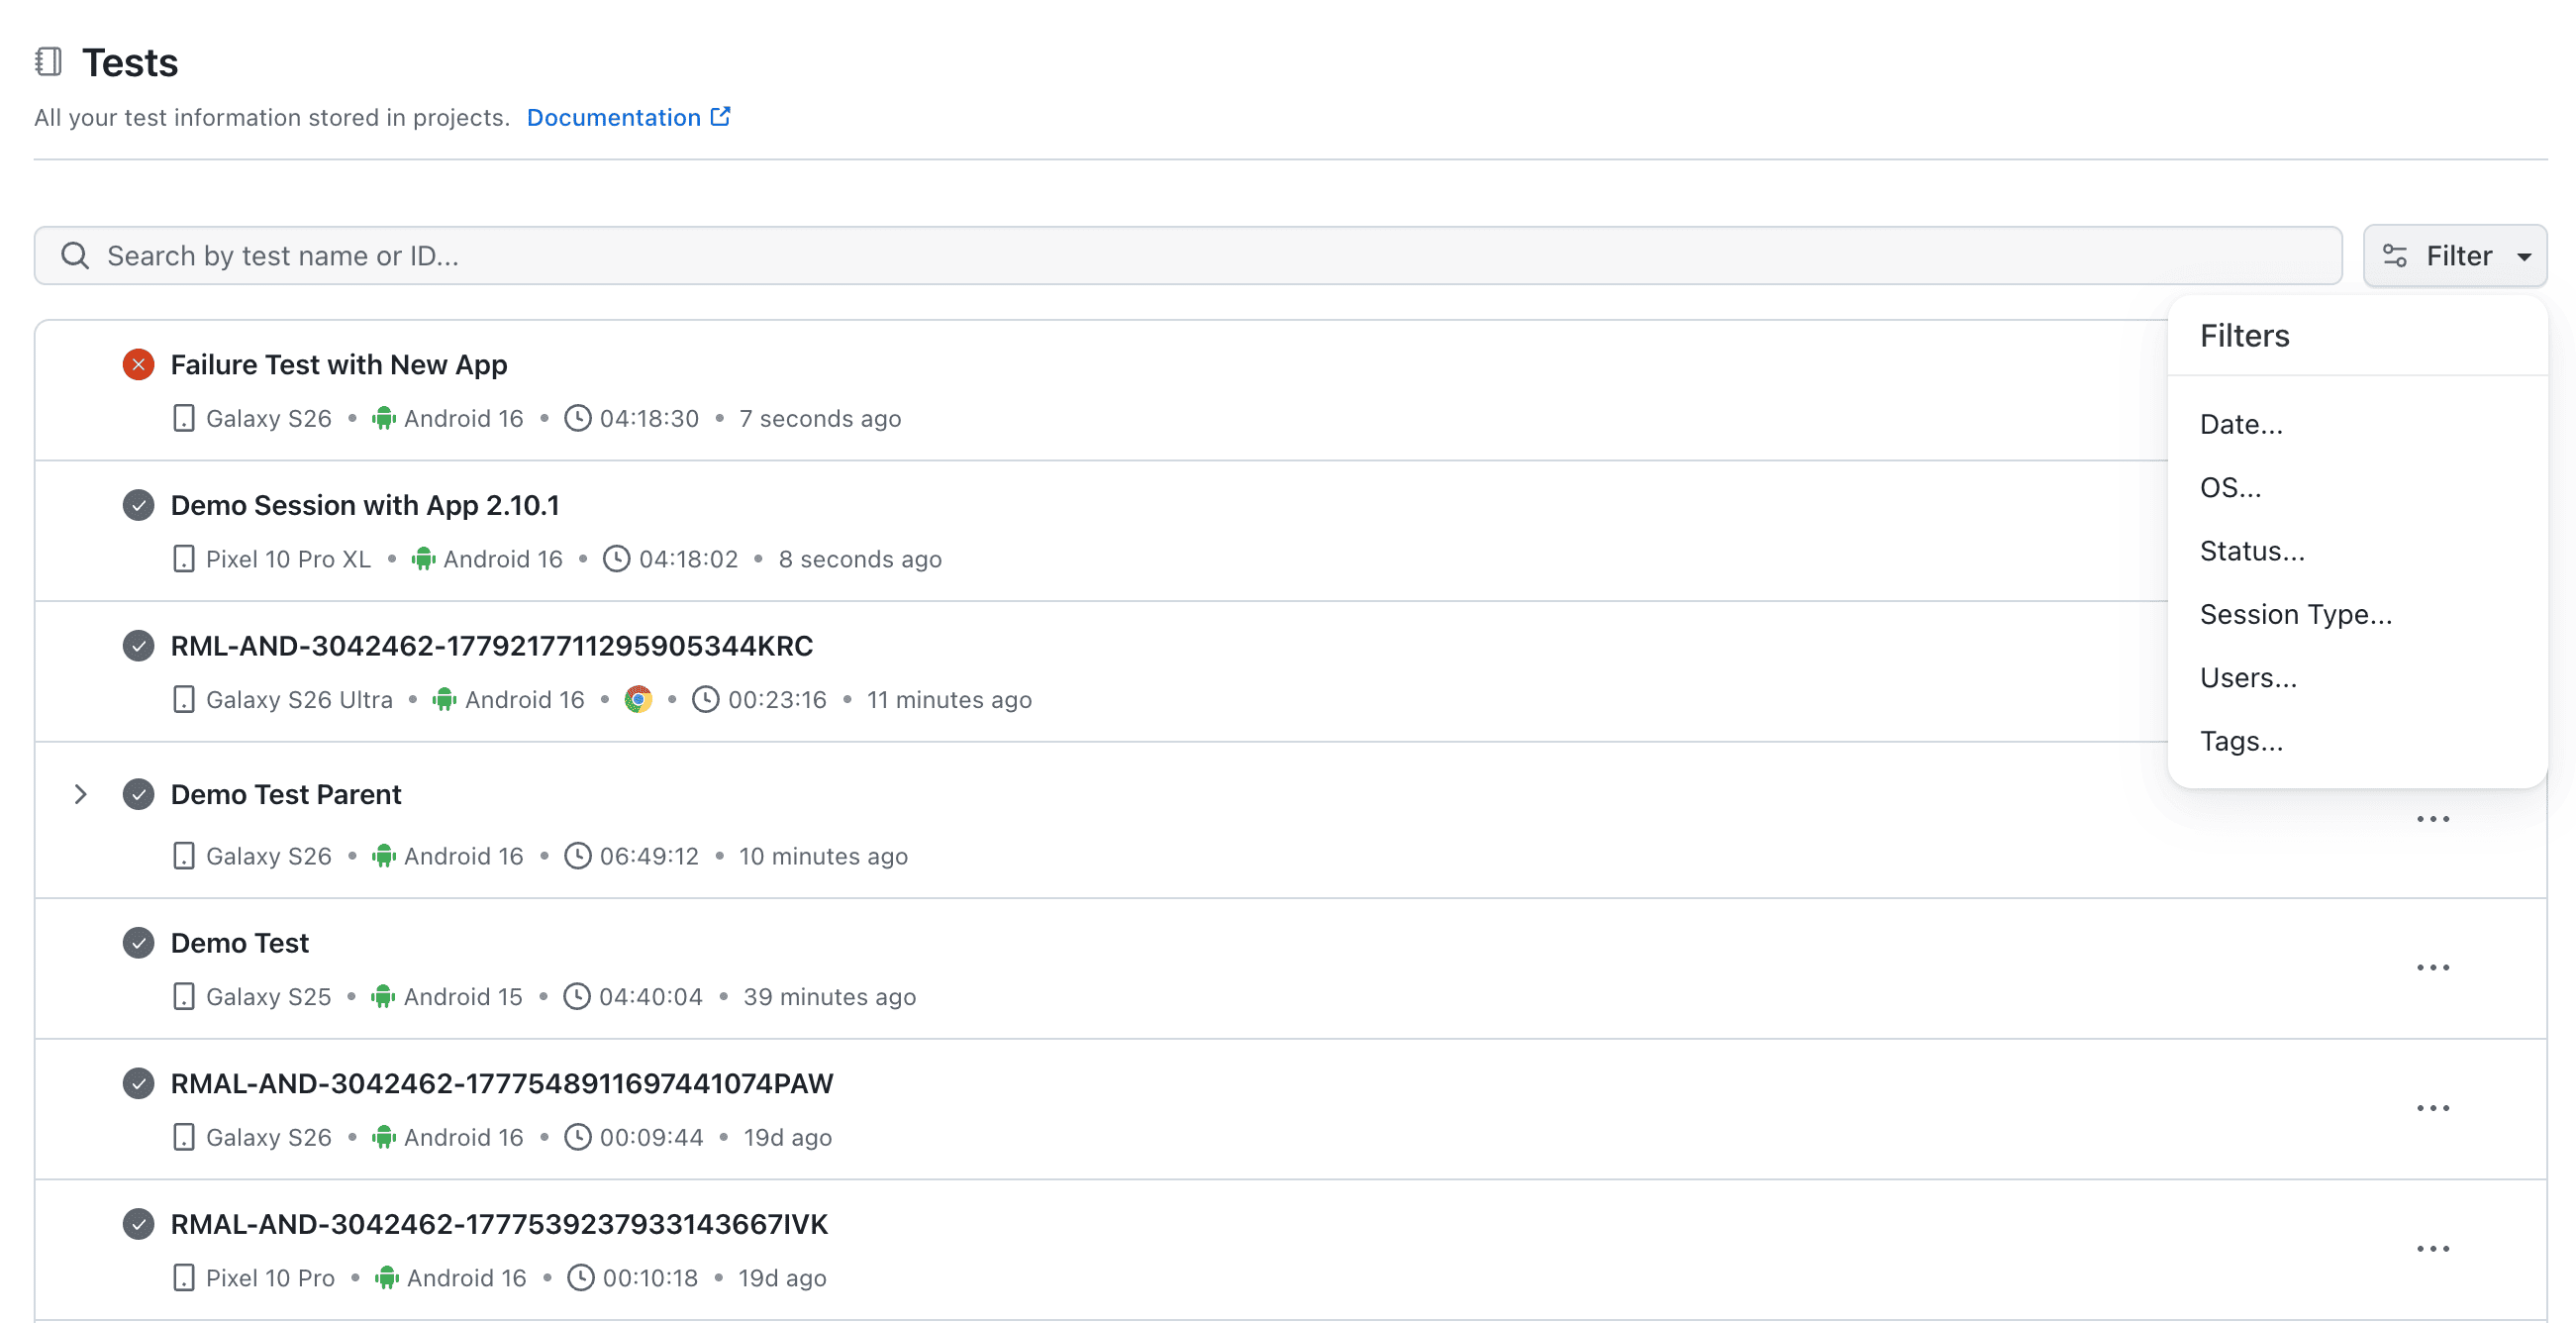
Filters
You can filter sessions using the filter dropdown. Click the Filter button at the top of the dashboard to open the filter panel.
| Filter | Options | Description |
|---|---|---|
| Date | Start and end date picker | Filter sessions within a specific time period |
| OS | iOS, Android | Filter by device operating system |
| Status | Passed, Failed, Completed | Filter by session outcome |
| Session Type | App Testing, Browser Testing | Filter by the type of manual test |
| Users | Team member names | Filter by the user who ran the session |
| Tags | Custom tag names | Filter by tags (AND logic, session must have all selected tags) |
When filters are active, a Clear All bar appears at the top. Clicking it removes all active filters but does not clear search text.
Filter state is URL-encoded, so your filter selections are preserved in the URL, making filtered views shareable and bookmarkable.
Search
Use the search bar to find sessions by test name or test ID. Search works alongside active filters, so results are filtered by both search text and selected filters at the same time.
Click the X button in the search bar to clear the search and restore the full list.
Sorting
Sessions can be sorted by:
- Created At (default): newest first
- Duration: longest or shortest first
Ending a Session
When you stop a manual testing session, a Session Details modal appears. Use it to set session metadata before the session is saved to the dashboard.
In the Session Details modal, you can:
- Test Name: Rename the test to a descriptive name for easy identification. Click the X in the field to clear the current name.
- Status: Defaults to Completed. Use the dropdown to update it to Passed or Failed based on your test results.
- Remark: Add notes about the session (up to 256 characters, with a live counter showing usage).
- Tag(s): Add custom tags for later filtering. Enter multiple tags separated by a comma (up to 10 tags per session).
Once the details are set, click Save & End Session to save the session. Click Cancel to dismiss the modal without ending the session.
The test name, remark, and tags can only be set when ending the session through the Session Details modal. Remarks and tags cannot be edited after the session ends. The test name can be renamed later from the dashboard.
After you click Save & End Session, the session is created and appears on the Manual Tests Sessions Dashboard, under the Real Devices product, with all the metadata you provided. You can then locate it on the dashboard using the search bar or filters.
Performance Sessions View
Sessions with Manual App Profiling enabled use a parent-child hierarchy on the dashboard:
- Parent Session: Your App Live manual testing session row (for example,
RMAL-AND-164519-...). - Profiling Tests (Children): Each time you start and stop profiling within a session, a new child profiling test is created (for example,
PROF_ANDROID_...orPROF_IOS_...).
Click the expand chevron on a parent session to reveal the profiling tests as child rows. Each child has its own name, duration, and platform icon. Click a child profiling test to navigate directly to its App Performance view.
Session Detail Page
Click on any session row to open its detail page.
Tabs
The tabs available on the detail page depend on whether the session has profiling data:
Without profiling (2 tabs):
| Tab | Content |
|---|---|
| Meta Data | Session info, configuration, timing, user details |
| Media | Video recording and screenshots |
With profiling (up to 5 tabs):
| Tab | Content |
|---|---|
| App Performance | Profiling summary cards and time-series performance graphs synced with video |
| Meta Data | Session info, configuration, timing, user details |
| Media | Video recording and screenshots |
| Network Logs | HAR viewer with HTTP/HTTPS request details (only if network log capture was enabled) |
| Device Logs | System-level device logs (only if device log capture was enabled) |
Meta Data Tab
The Meta Data tab displays session information in a two-column layout:
- Session Info: Test ID, Status, Session Type
- Configuration: Device, Platform, OS Version
- Timing: Started At, Ended At, Duration, Updated At
- User: Username who ran the session
- Remark: Full remark text (if set)
Media Tab
The Media tab shows all artifacts captured during the session:
- Video Recording: Full session video playback
- Screenshots: Any screenshots captured during the session
Toggle between list view and grid view for browsing artifacts. Each artifact has a download button.
If no artifacts were captured, an empty state message is displayed.
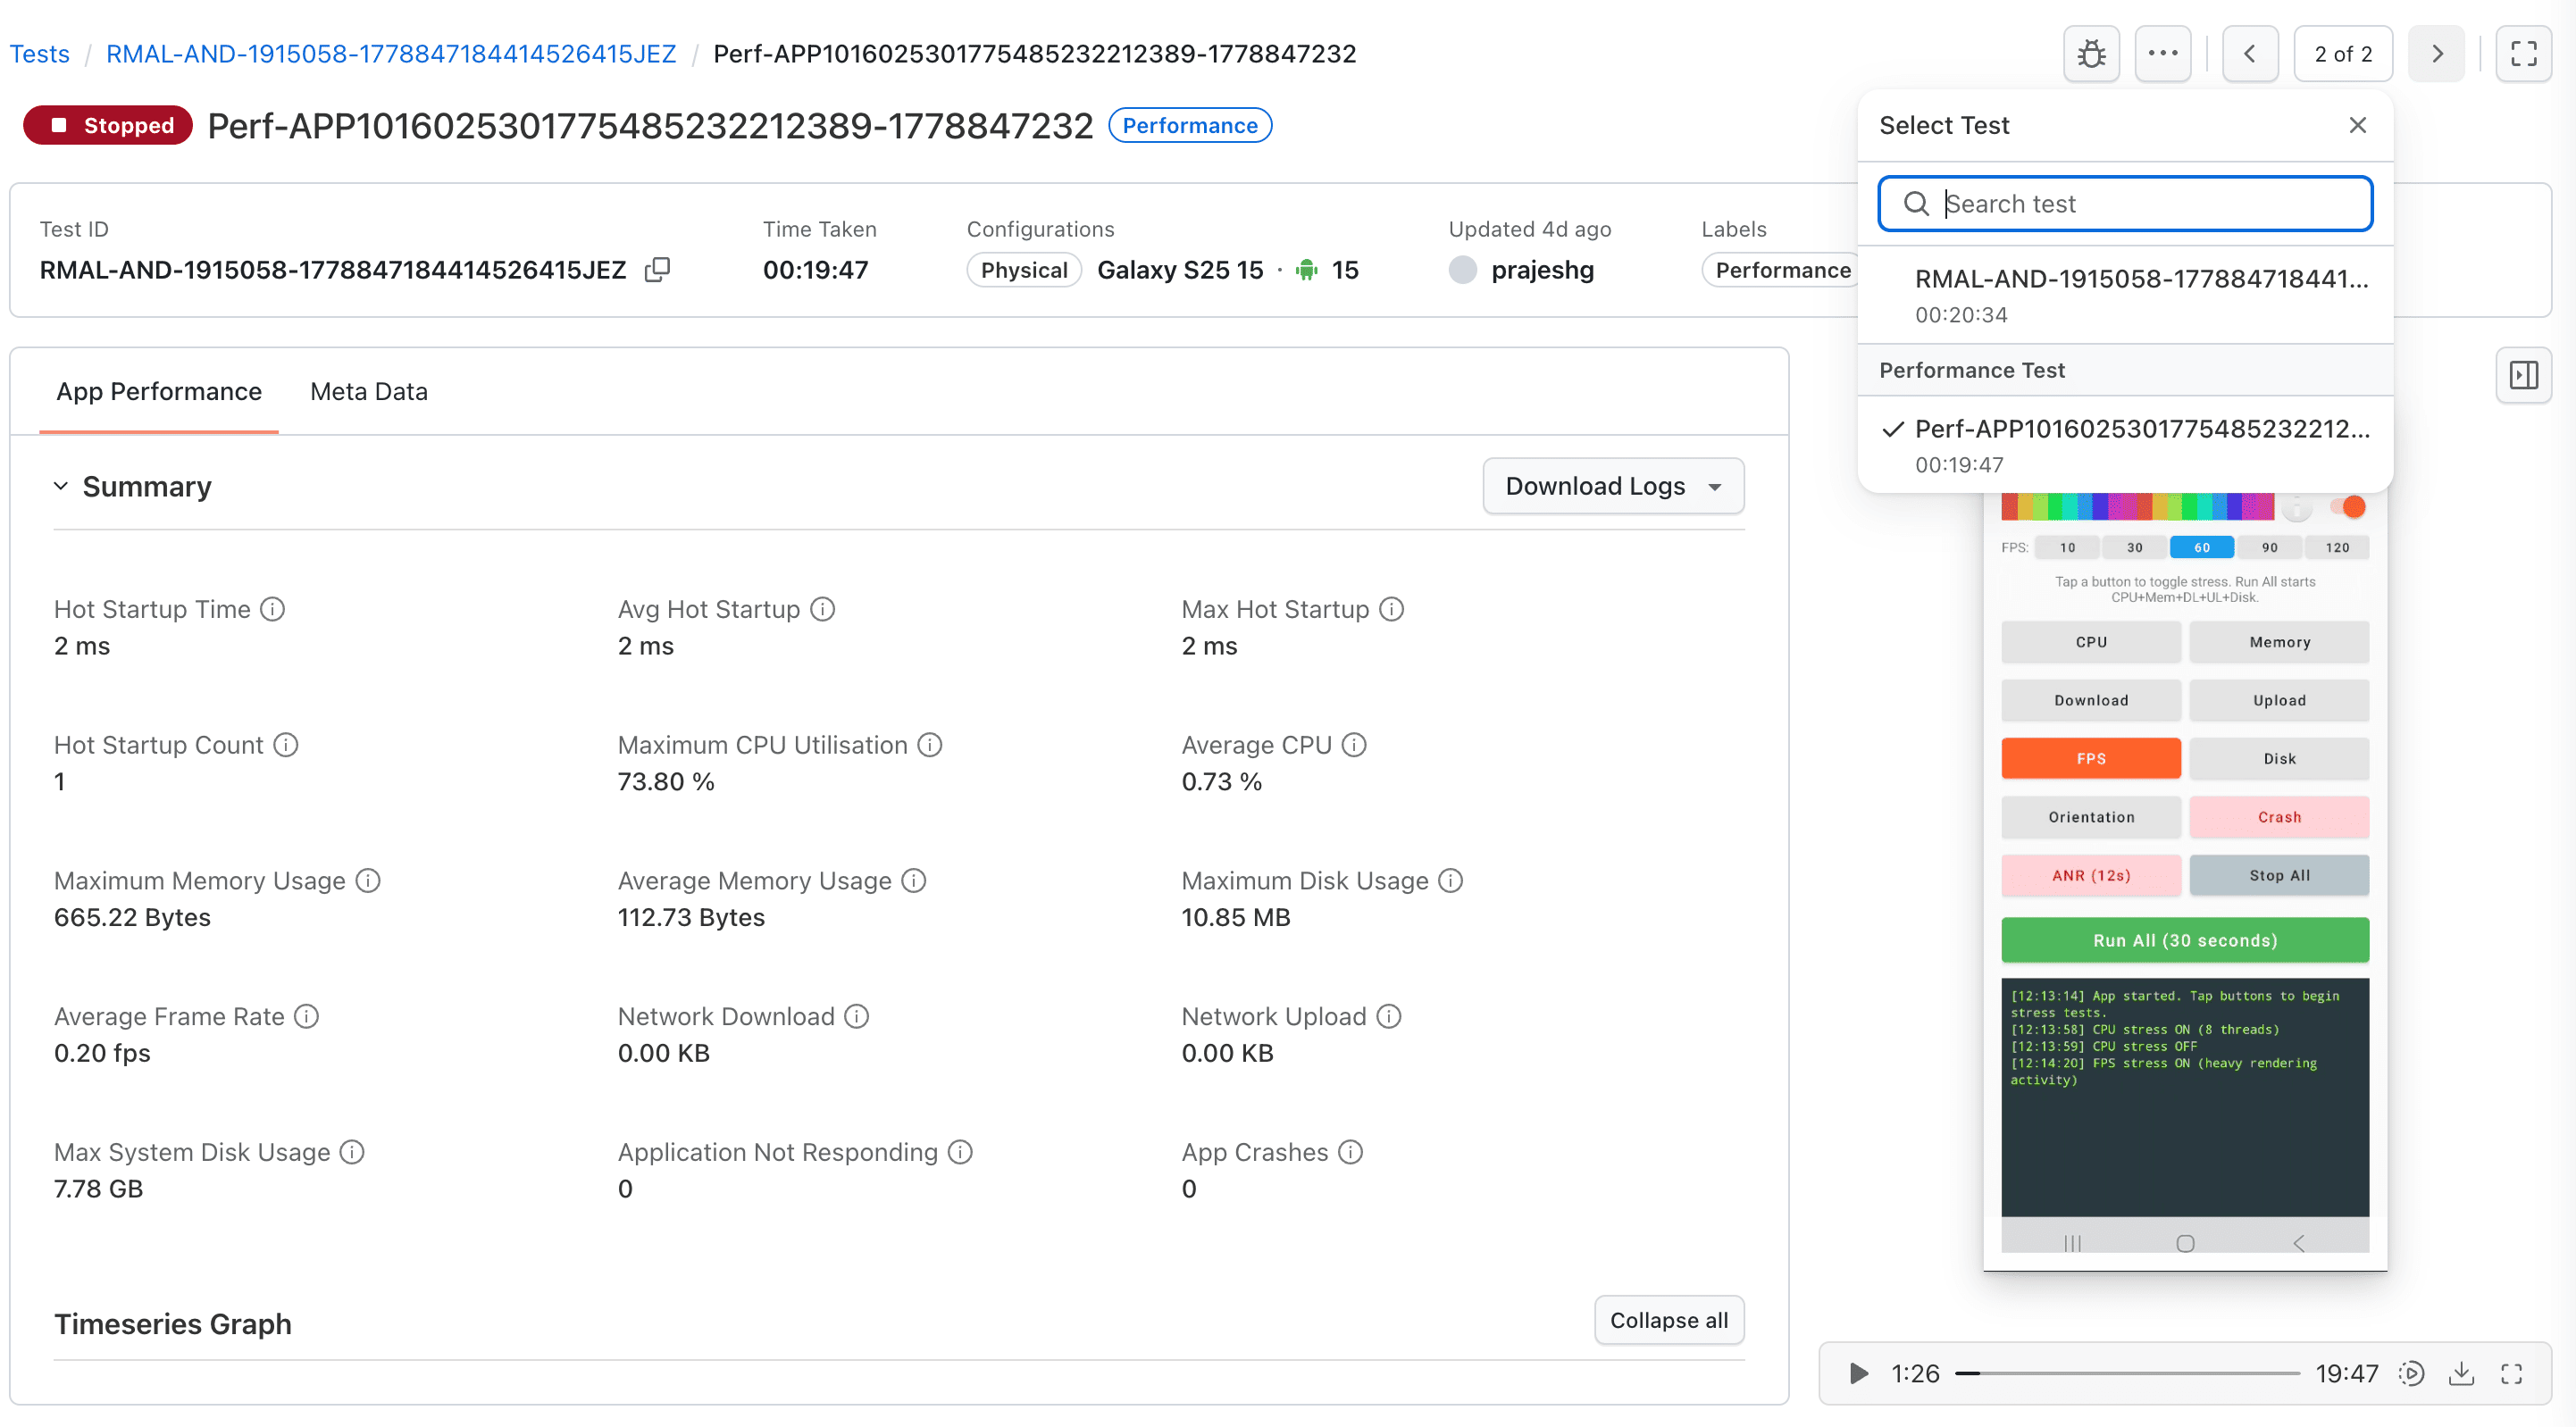
App Performance Tab
Available only for sessions with App Profiling enabled. This is where you view the detailed profiling results for your session.
This tab displays:
- Profiling Summary Card: All key metrics at a glance, including CPU (max and average), Memory (max and average), Disk (max and average), Average FPS, Network (download/upload), Battery Energy (iOS only), Cold Startup Time, Hot Startup Time, ANR Count (Android only), and App Crashes.
- Time-Series Graphs: Interactive performance graphs for each metric category (CPU, Memory, Disk, FPS, Network, Battery).
- Video-Graph Sync: Session video playback is synchronized with the performance graphs. As the video plays, a timeline marker moves across the graphs in real time, making it easy to correlate user interactions with performance changes.
Navigating Between Tests
A session and its profiling tests are viewed individually. To move between them, use the Select Test option in the toolbar. It opens a panel with:
- A Search test bar to find a specific test by name.
- The parent session listed at the top. The currently open test is marked with a check.
- A Performance Test group listing the profiling tests captured during the session (for example,
Perf-app-debug(5)-...).
Click any test to switch to its view. You can also use the previous and next arrows in the toolbar (for example, "1 of 2") to move between tests one at a time.
Network Logs Tab
Available when profiling was started with network log capture enabled. Displays a HAR viewer showing:
- All HTTP/HTTPS requests made by the app
- Request method, URL, status code, and duration
- Request and response headers and body (expandable)
- Filter by URL, method, or status code
Device Logs Tab
Available when profiling was started with device log capture enabled. Displays a log viewer with:
- System-level device logs captured during the profiling test
- Searchable and filterable log entries
- Download button to export logs
Session Actions
Rename
Rename a session from the kebab menu (three dots) on the list row or the detail page:
Step 1: Click the kebab menu icon.
Step 2: Select Edit name.
Step 3: Enter the new name in the modal.
Step 4: Click Save.
The updated name is reflected immediately in both the list view and detail page, and persists after refresh.
Delete
Delete a session from the kebab menu:
Step 1: Click the kebab menu icon.
Step 2: Select Delete.
Step 3: Confirm in the warning dialog.
Deleted sessions are soft-deleted: they are removed from the dashboard list, but the data is retained in the backend.
Tags
- Add up to 10 custom tags per session.
- Set tags in the Session Details modal when ending a session, entering multiple tags separated by a comma.
- Tags are displayed as label chips on the session row.
- Filter by tags using the dashboard filter (AND logic, session must match all selected tags).
- Spaces are trimmed from tag names.
Tags can only be set when ending a session through the Session Details modal. They cannot be edited after the session ends.
Data Retention
All manual testing sessions from Real Devices App Testing and Browser Testing are automatically stored on this dashboard. Session data is retained in line with your organization's data retention policy.
Related Documentation
- Manual App Profiling: Enable and use real-time performance profiling during App Live sessions
Got any questions?
Please reach out at our 24x7 Chat Support or you could also mail us at [email protected].
