Manual App Profiling
App performance is a critical factor for user satisfaction and adoption. While automated profiling through Appium tests provides insights during CI/CD pipelines, there are times when you need to manually interact with your app and observe its performance in real-time. TestMu AI's Manual App Profiling feature enables you to profile your app's performance during live manual testing sessions on real devices, giving you instant visibility into CPU, memory, disk, network, and more as you interact with the app.
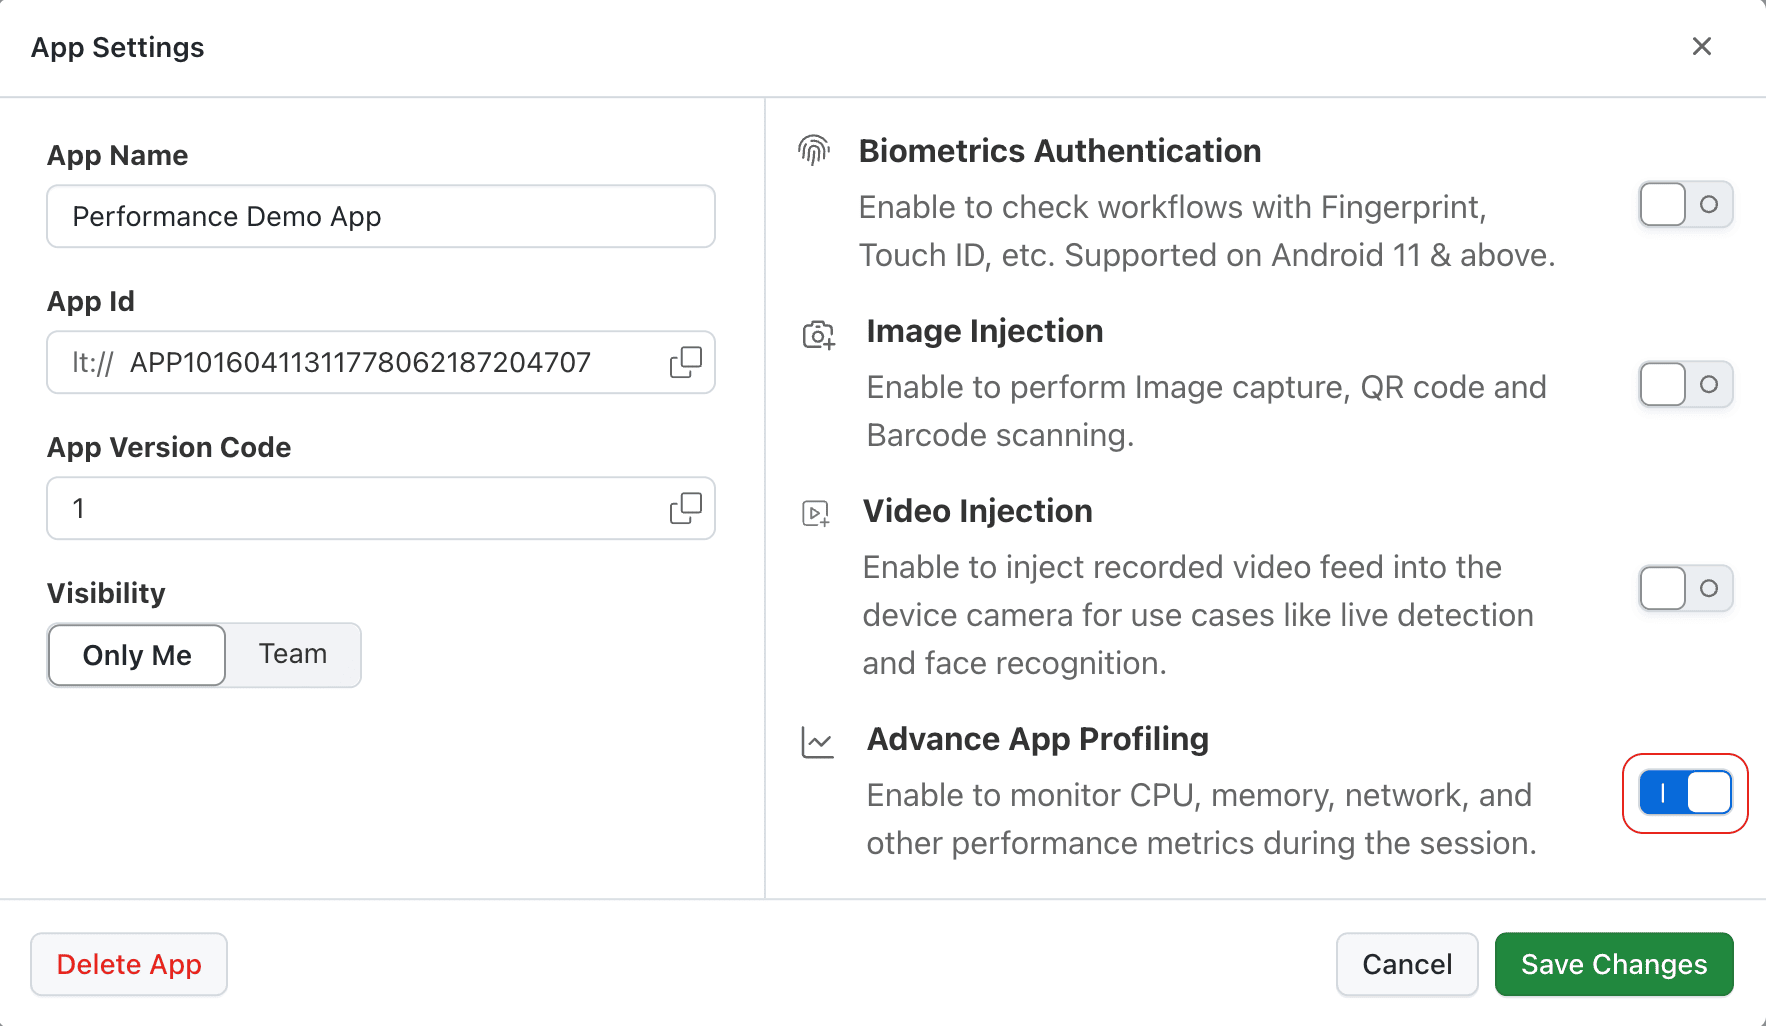
You can enable App Profiling from the App Live session toolbar before starting your session. Simply toggle the Advance App Profiling option, and profiling will begin capturing metrics as soon as your session starts.
This feature is available for App Live sessions on iOS and Android real devices. It must be enabled before starting the session and cannot be toggled mid-session.
Manual App Profiling is currently in Beta. To use this feature, get it enabled for your organization by reaching out to our 24x7 Chat Support or mailing us at [email protected].
Getting Started
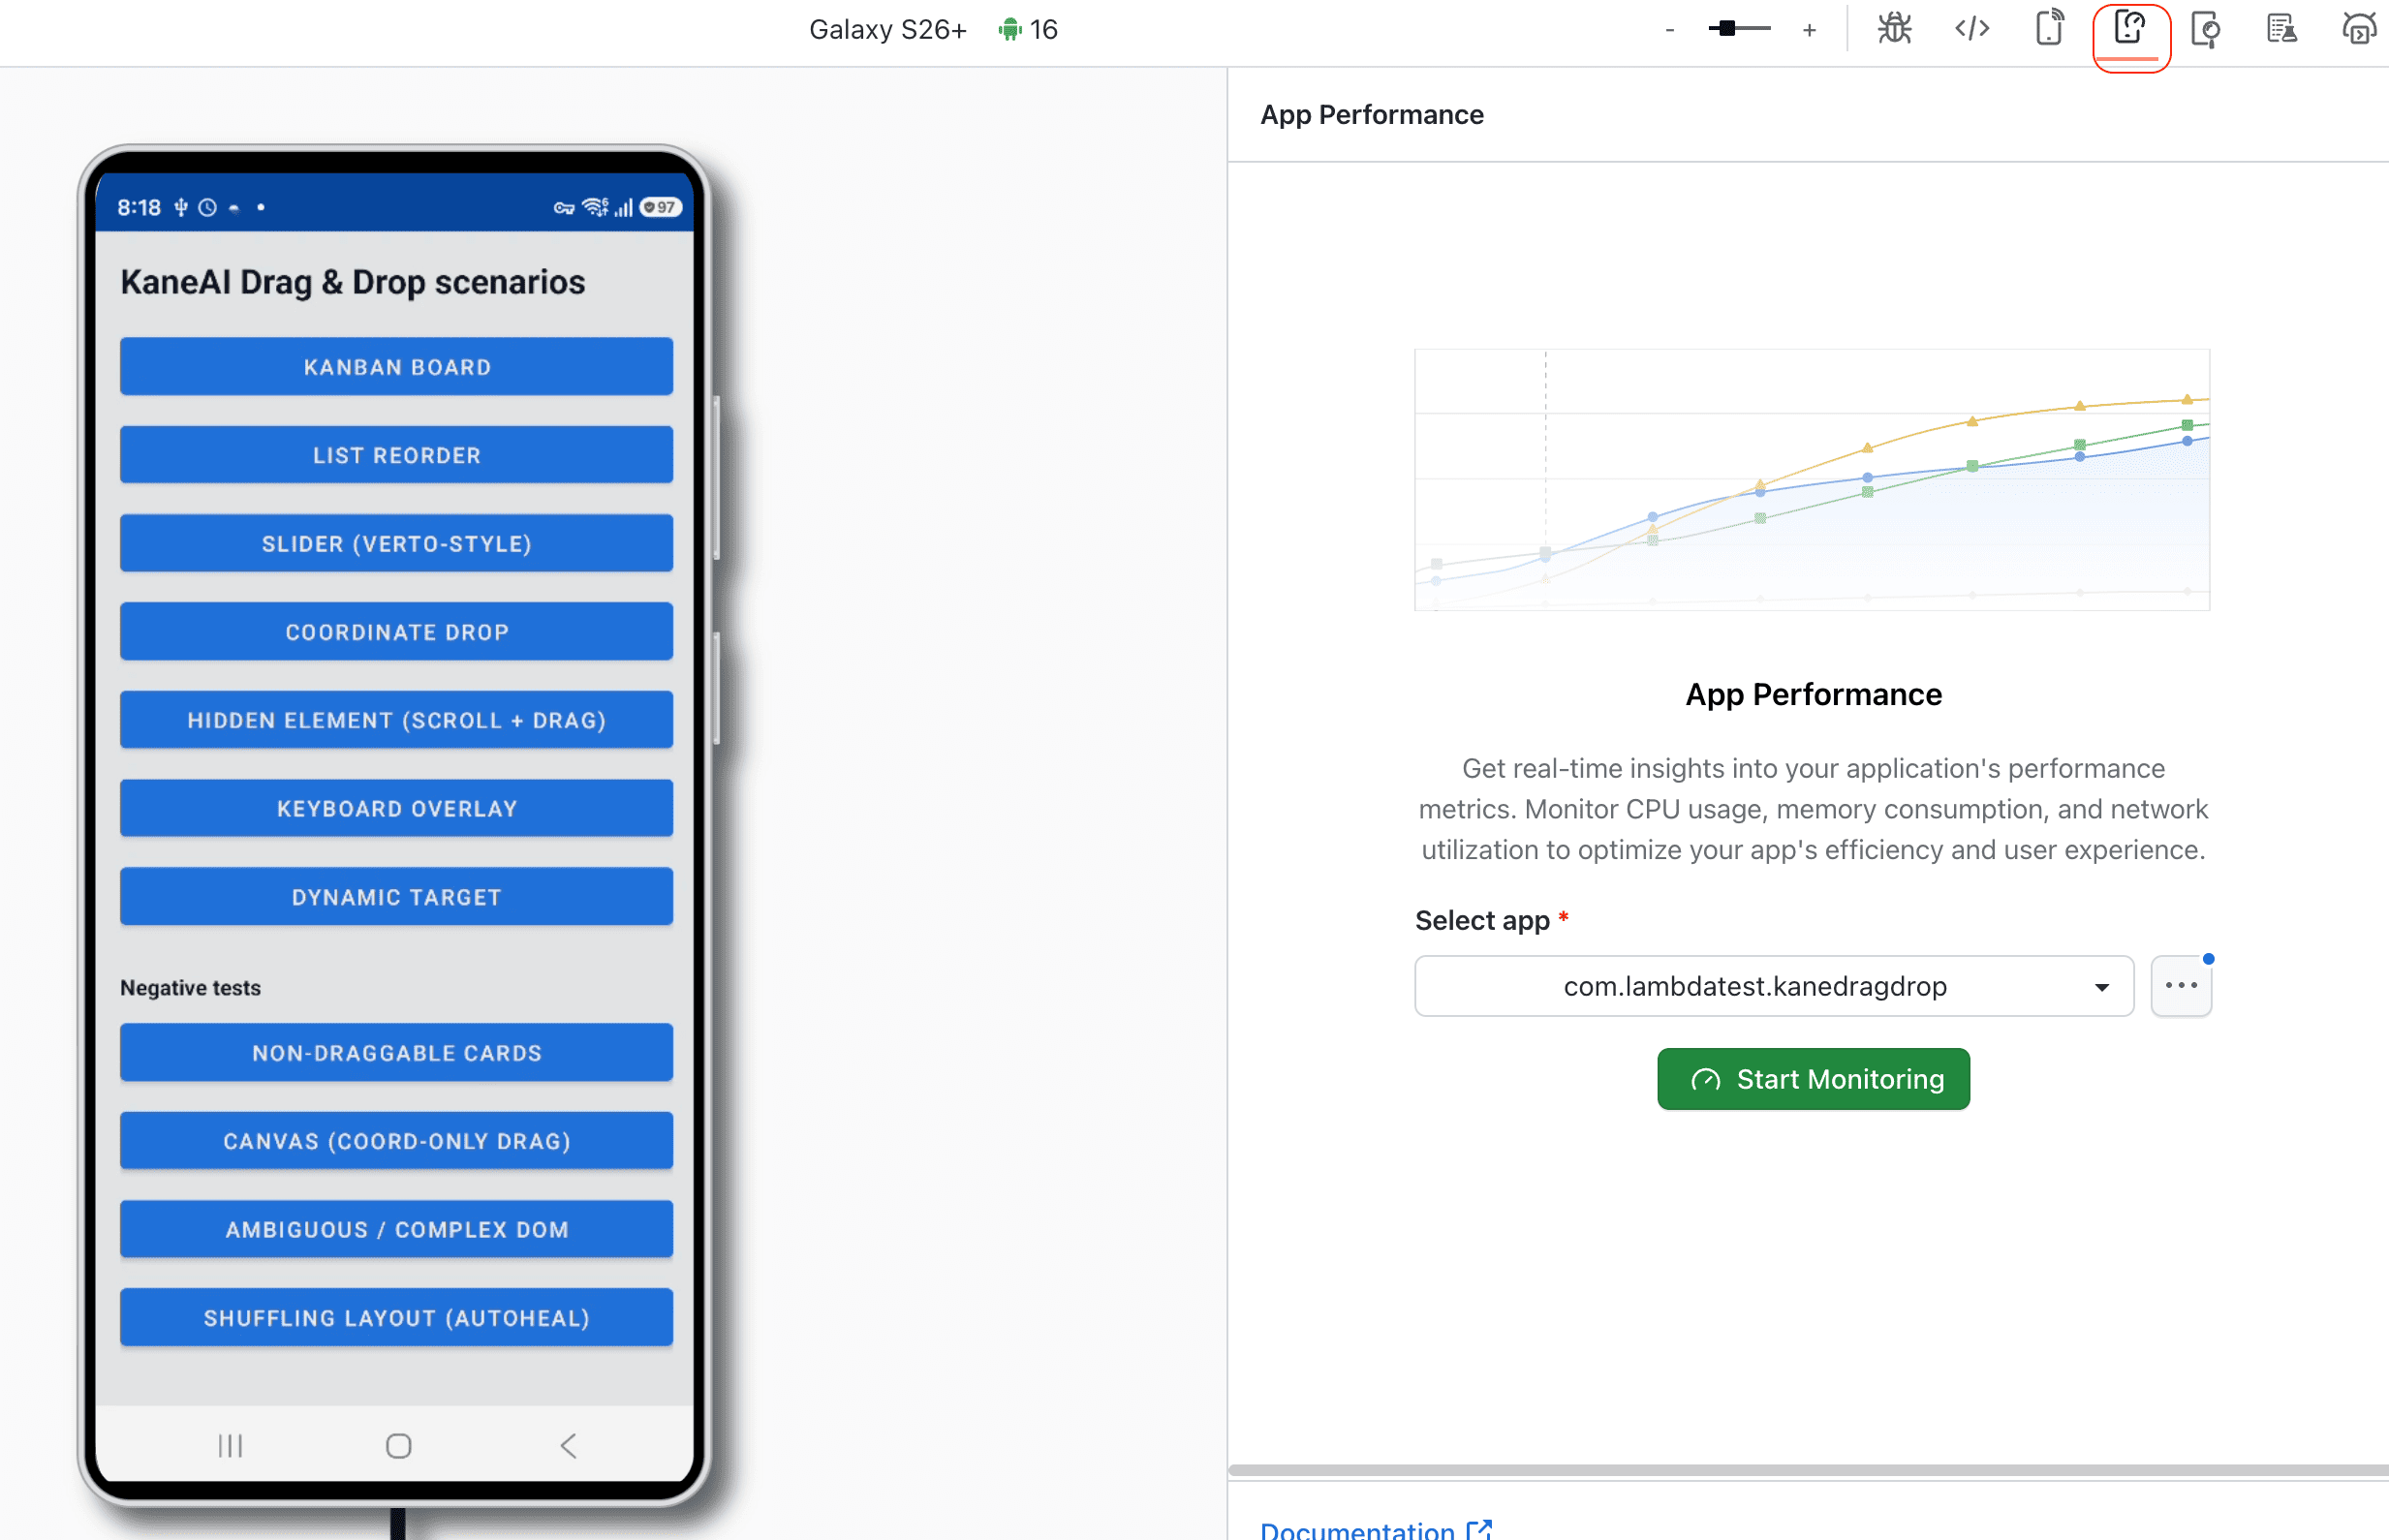
Step 1: Navigate to Real Devices > App Testing and select your app, device, and OS version.
Step 2: Before launching the session, enable the Advance App Profiling toggle in the session configuration.
Step 3: Start your session, then start profiling from the toolbar. The profiling toolbar appears with options to monitor performance, capture network logs, and capture device logs.
Step 4: During your session, you can:
- Start/Stop Profiling: Create multiple profiling segments within a single session.
- Restart App Performance: Reset profiling data and start a fresh capture from that point.
- View Live Metrics: CPU, Memory, Disk, FPS, Network, and Battery (iOS only) graphs update in real-time.
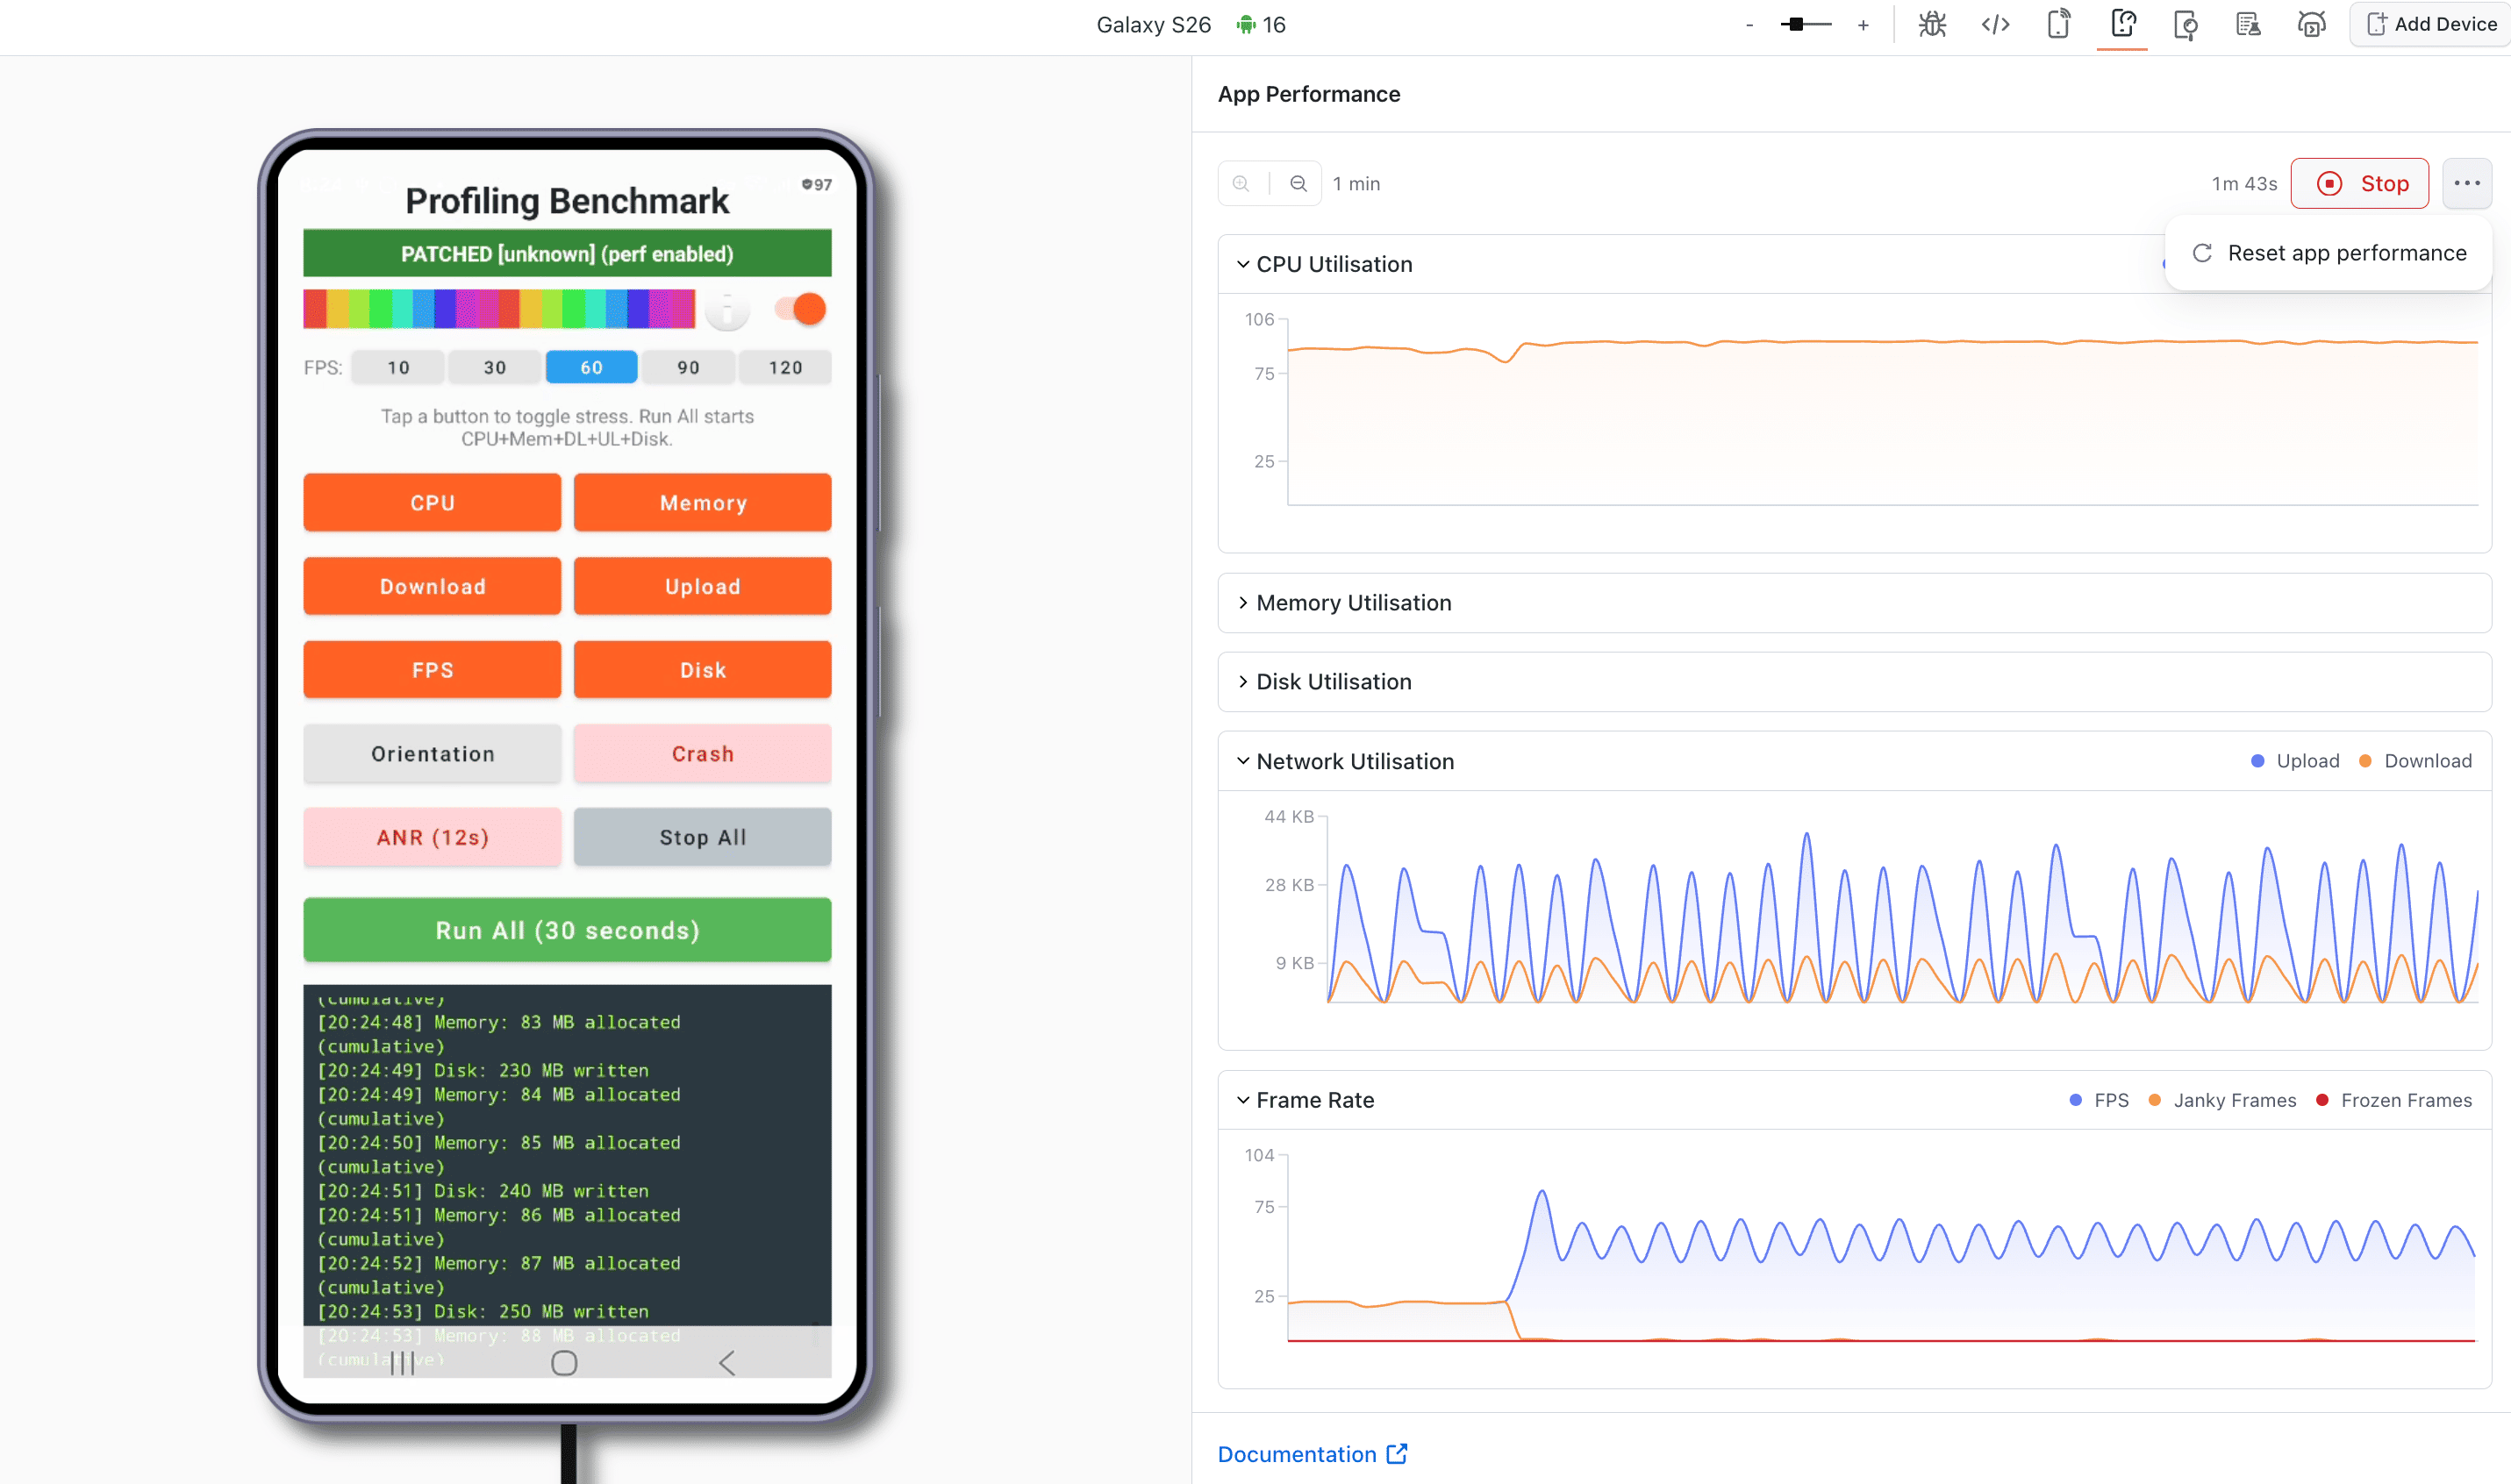
Step 5: When done, click Stop Profiling to see a summary of captured metrics. Use View Detailed Report to navigate to the dashboard for in-depth analysis.
Step 6: End the session through the Session Details modal (set the test name, status, remark, and tags). Once the session is created, it appears in the Manual Tests Sessions Dashboard under the Real Devices product, where you and your team can locate it using the dashboard filters. See Ending a Session for details.
Basic Summary
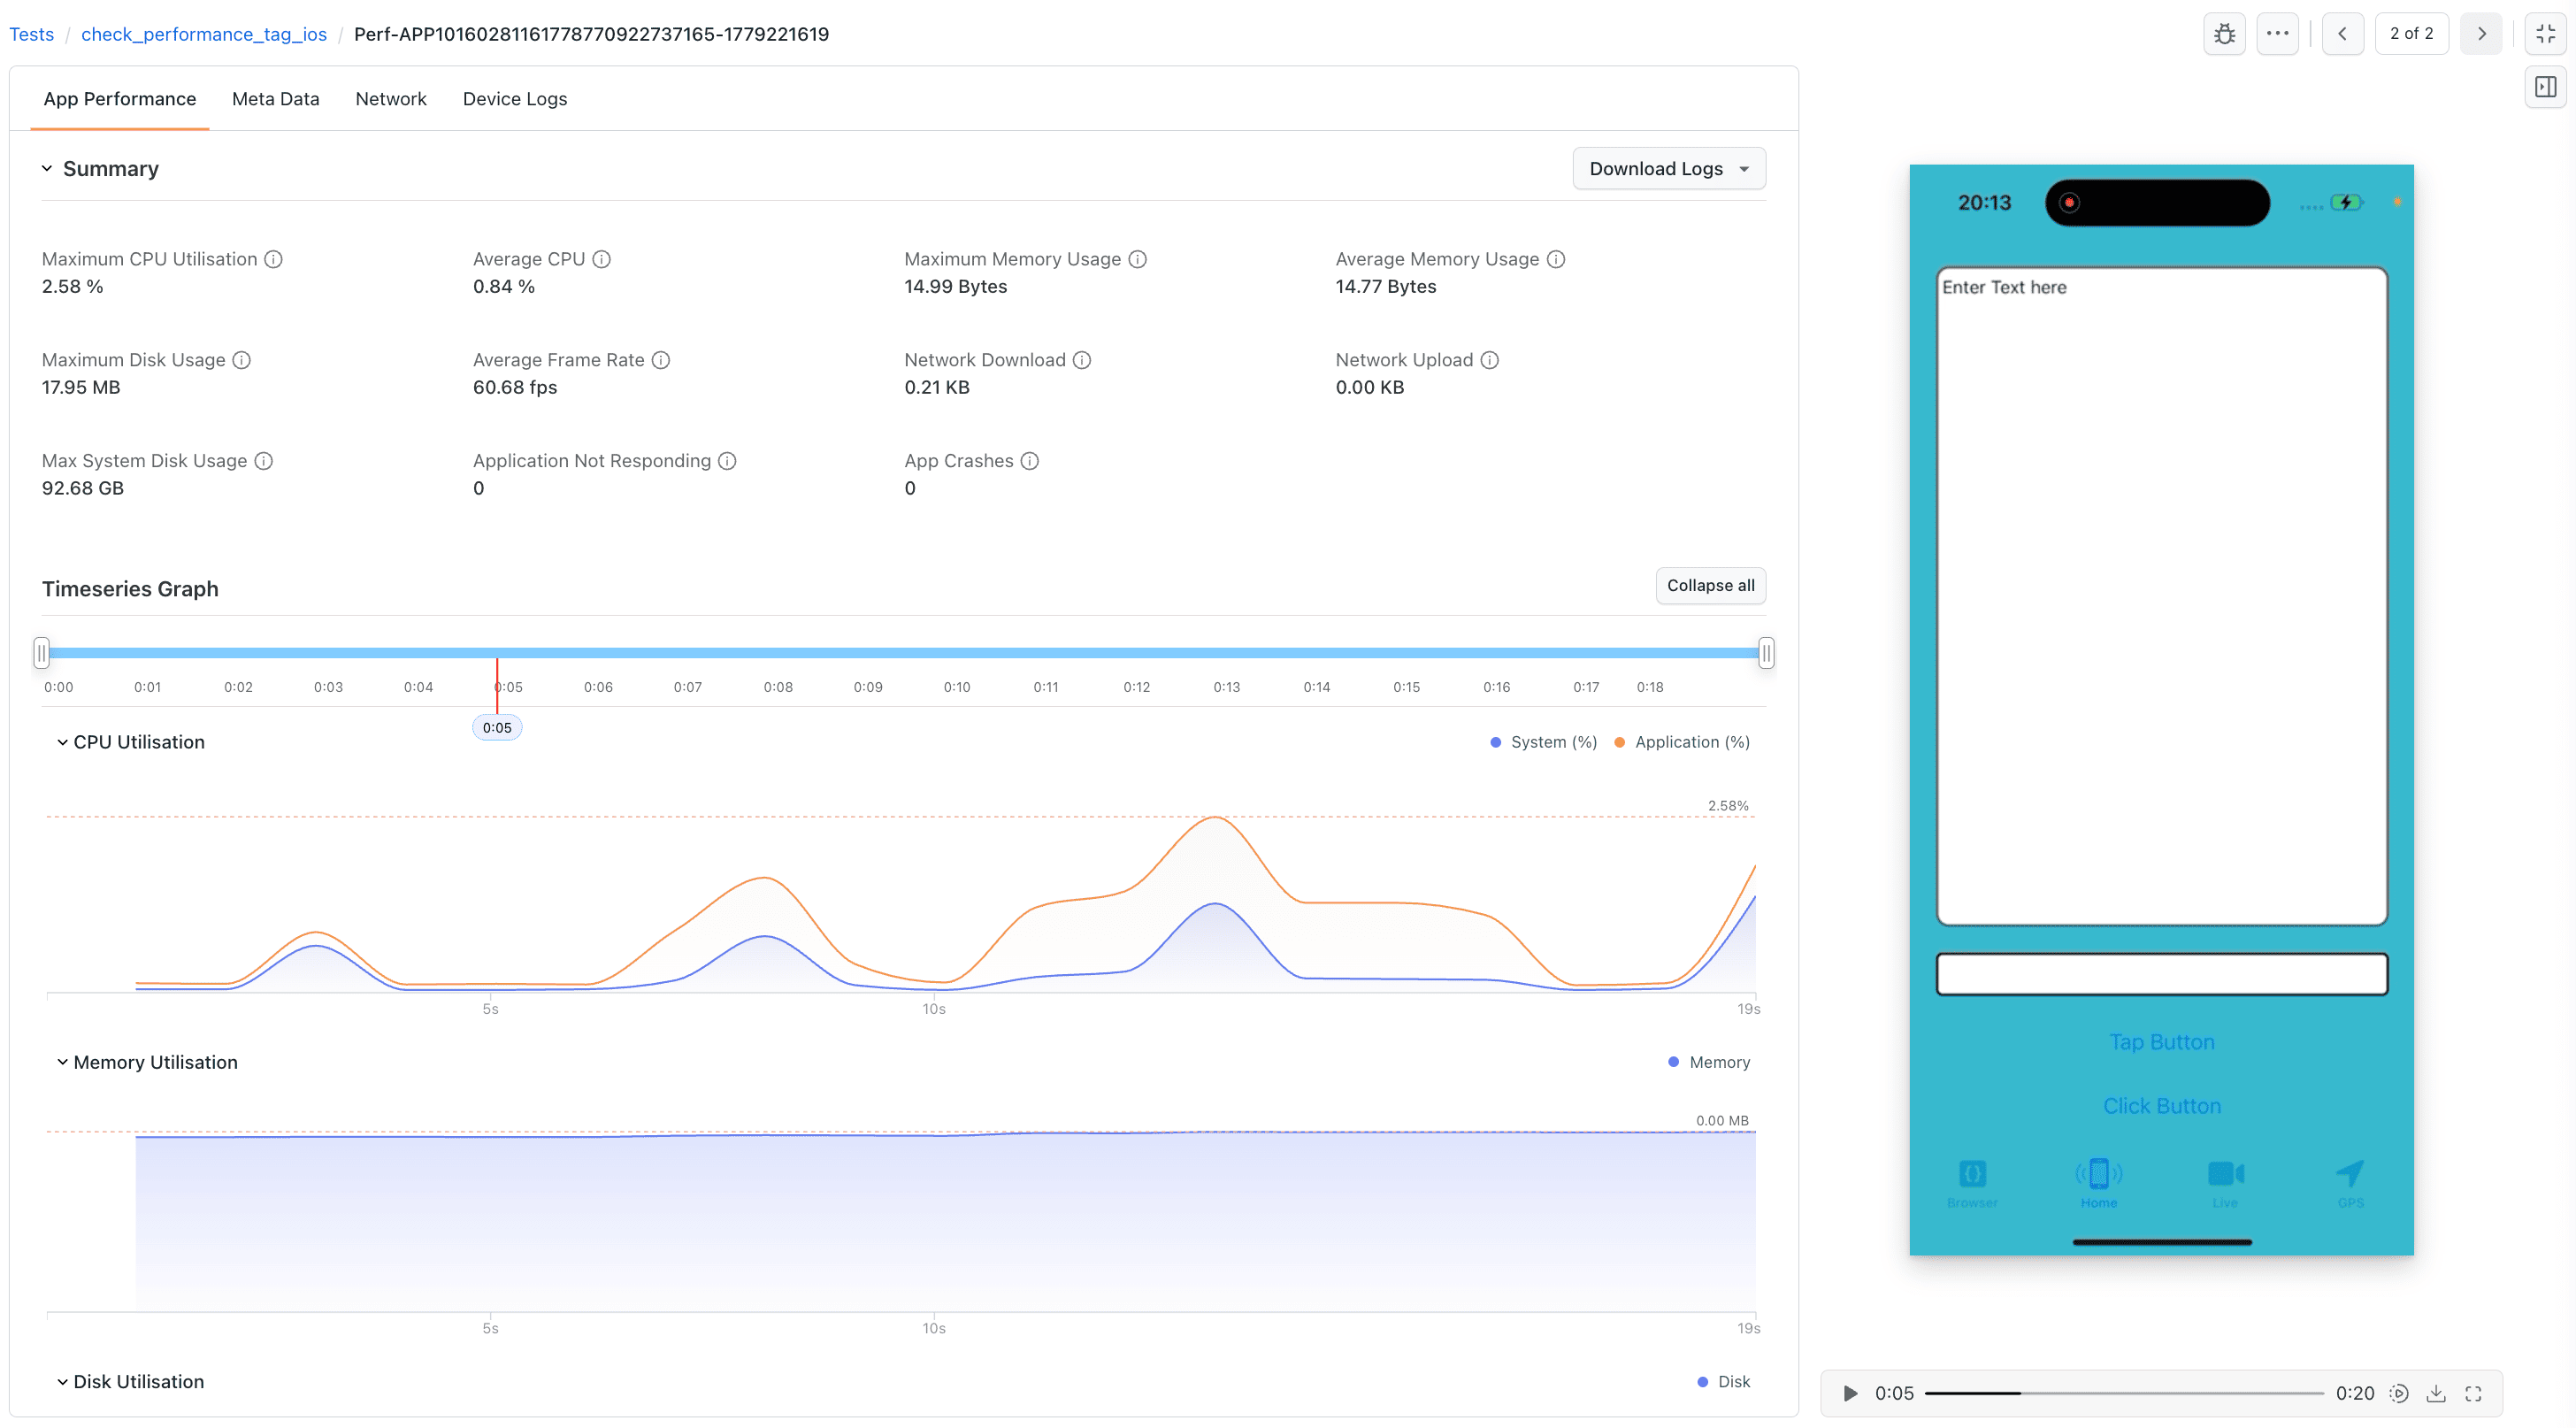
Here is a description of each metric from the App Profiling summary:
- Cold Startup Time : Time taken by the app to launch from a complete shutdown or a non-running state. A lower cold startup time improves user experience, as it reduces wait time when the app is opened for the first time.
- Hot Startup Time : Time taken by the app to resume from a background state. A fast hot startup ensures that users can quickly switch between apps without delays.
- Maximum CPU Utilisation : It indicates the peak percentage of CPU consumed by the app during its execution. High CPU utilization can affect other processes and contribute to battery drain, so it's important to keep it optimized.
- Average CPU : Average CPU utilization gives a more balanced view of the app's typical CPU usage during a session. This value helps assess the app's efficiency in resource usage over time.
- Maximum Memory Usage : It refers to the highest amount of RAM consumed by the app during the session. Monitoring this metric helps developers ensure that their app doesn't consume excessive memory, which can lead to slower performance or crashes on low-memory devices.
- Average Memory Usage : Average memory usage shows the typical amount of memory used by the app. This value is useful for identifying memory leaks and optimizing the overall resource consumption of the application.
- Maximum Disk Usage : Highest amount of storage consumed by the app on the device. Keeping disk usage minimal helps improve app performance and ensures better storage management for end users.
- Average Disk Usage : It reflects the typical amount of storage space used by the app over time. This metric is important for identifying opportunities to reduce the app's footprint on the device's storage.
- Average Frame Rate : The frame rate measures the smoothness of the app's graphical rendering. A higher frame rate (measured in frames per second or fps) indicates smoother animations and a better visual experience. A rate close to 60 fps or higher is typically desired for smooth app performance.
- Network Download/Upload : This metric tracks the amount of data downloaded and uploaded by the app during the session. Monitoring network usage helps developers optimize how the app handles data transmission to ensure it uses bandwidth efficiently.
- Application Not Responding : ANR events occur when the app becomes unresponsive and prompts the user to wait or close the app. A value of zero indicates the app has not faced any ANR issues, which is crucial for maintaining a stable and responsive app. You can also view ANR Dumps and Data logs.
- App Crashes : This metric tracks the number of times the app has crashed during the session. Zero crashes indicate that the app is stable, ensuring a reliable user experience.
- Battery Energy (iOS only) : Energy consumed by the app, measured in Joules. This metric helps identify features that are energy hogs and optimize them to extend battery life.
Key Performance Metrics
1. CPU Consumption
The CPU handles all operations within a mobile device. High CPU usage impacts overall system performance and drains the battery faster. By monitoring CPU consumption during manual testing, you can pinpoint which user interactions are resource-heavy and optimize them for better performance. TestMu AI provides two CPU metrics in a time-series format:
- System CPU Usage (%): Total CPU usage across the system.
- App CPU Usage (%): CPU usage specific to your app.
Using these real-time insights, you can identify CPU-intensive interactions as you manually navigate through your app and minimize CPU-heavy operations.
2. Memory Consumption
RAM is a critical resource for mobile apps. Excessive memory consumption can lead to memory leaks, degraded performance, and application crashes.
TestMu AI offers three memory metrics:
- System Memory Usage (MB): Overall memory consumption during the session.
- App Memory Usage (MB): Memory consumed by your application.
- Available Memory (MB): Remaining memory available for use.
By monitoring memory during manual testing, you can identify specific user flows that trigger memory spikes or leaks.
3. Disk Usage
The Disk Usage metric provides insights into how much disk space is being utilized by both the system and the application during a session. Monitoring disk usage is crucial for optimizing storage consumption and ensuring efficient app performance, especially on devices with limited storage capacity.
- System Disk (MB): Indicates the total amount of disk space used by the entire system, including the operating system and other background processes, displayed in megabytes (MB).
- App Disk (MB): Shows the disk space specifically consumed by your application (App Under Test) during the session, helping you track how much space your app is utilizing and whether it might cause storage-related issues.
4. Rendering (Frame Rate)
Smooth rendering directly affects how responsive your app feels to users. Rendering performance is a typical performance issue that any app faces. It is measured at different stages in the app's lifecycle to ensure that users do not have a bad experience with the app.
TestMu AI measures your app's Frames Per Second (FPS) across its lifecycle, which helps you identify performance bottlenecks in rendering and improve user experience.
- Frames Per Second (FPS): Real-time measurement of rendering performance throughout the session.
Low FPS during specific interactions helps pinpoint UI rendering bottlenecks.
5. Network Usage
Understanding how your app utilizes network resources is essential for optimizing data transfer and ensuring efficient performance.
TestMu AI tracks:
- Download Size (MB): Amount of data downloaded during the session.
- Upload Size (MB): Amount of data uploaded during the session.
This helps you to monitor:
- Data Efficiency: Optimize data usage to enhance performance and reduce costs.
- Performance Optimization: Identify and mitigate high network usage areas that may affect app responsiveness.
When network log capture is enabled, a detailed HAR file is also available on the dashboard containing all HTTP/HTTPS requests made by the app.
6. Battery Consumption
Apps that consume excessive battery negatively affect user experience. With TestMu AI, you can monitor how your app impacts battery drain, identify features that are energy hogs, and optimize them. This will help extend battery life for devices running your app.
- Battery Energy (J): Energy consumed by the app, measured in Joules.
Battery consumption data is only displayed for iOS applications. This feature is not available for Android applications during manual profiling.
7. ANR (Application Not Responding)
Sometimes, your application stops responding, and you receive a pop-up to wait or close the app. Application freezes and crashes are frustrating for users. TestMu AI provides detailed logs on ANR events, that helps you diagnose the root causes and eliminate them.
Currently, ANR monitoring is available for Android devices only.
Metrics Provided:
- ANR Count: Number of times the app encountered ANR during the session.
- ANR Dumps: Detailed logs for each ANR event to aid in troubleshooting.
8. Application Start-up Time
Application start-up time significantly impacts the first impression and overall user experience. Slow startup times create a poor first impression. TestMu AI tracks both cold and hot startup times, giving you the data needed to reduce delays and deliver a faster app launch.
- Cold Startup Time: Time from app launch (from scratch) to the first frame rendered.
- Hot Startup Time: Time from app resume (from background) to interactive state.
Profiling Segments
Manual App Profiling uses a parent-child hierarchy for organizing your profiling data:
- Parent Session: Your App Live manual testing session.
- Profiling Segments (Children): Each time you start and stop profiling within a session, a new profiling segment is created.
You can create multiple profiling segments within a single session to isolate performance data for different user flows or app features. Each segment has its own:
- Performance summary and graphs
- Video recording
- Network logs (if enabled)
- Device logs (if enabled)
Capturing Network and Device Logs
When starting profiling, you can optionally enable:
- Network Logs: Captures all HTTP/HTTPS traffic in HAR format. Available on the dashboard under the Network Logs tab.
- Device Logs: Captures system-level device logs. Available on the dashboard under the Device Logs tab.
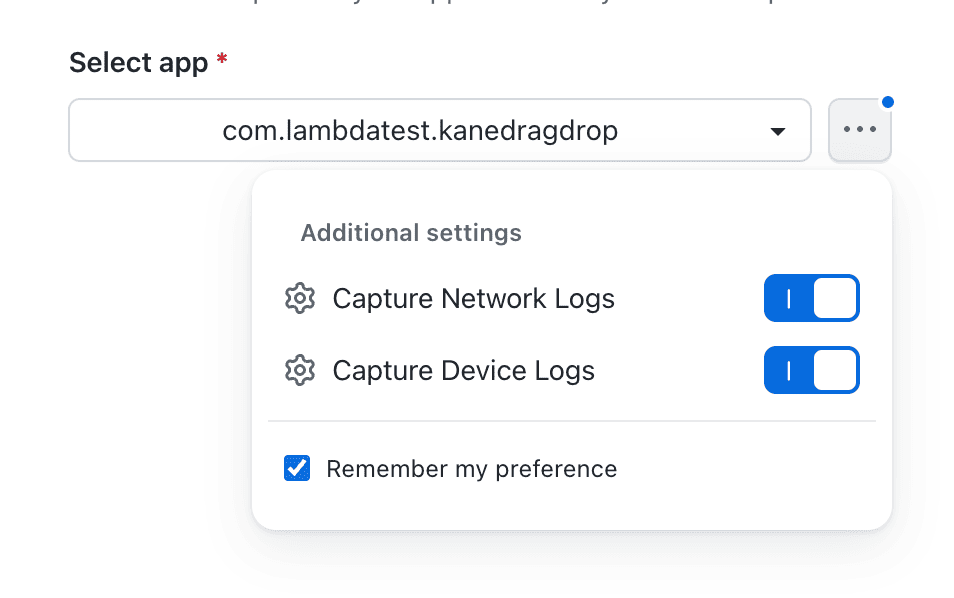
These tabs only appear on the dashboard if they were enabled at the time of starting profiling. If not enabled, only the App Performance and Meta Data tabs will be visible.
Viewing Profiling Results
After profiling is complete and you end the session, the session is created and stored on the Manual Tests Sessions Dashboard under the Real Devices product. Navigate there to:
- Locate your session using the dashboard filters: Date, OS, Status, Session Type, Users, and Tags
- View profiling summary cards with all captured metrics
- Explore time-series performance graphs synchronized with session video
- Analyze network logs (HAR viewer) and device logs
- Compare profiling segments across different user flows
For more details on navigating the dashboard, see the Manual Tests Sessions Dashboard documentation.
Platform Availability
| Capability | Android | iOS |
|---|---|---|
| Core metrics (CPU, Memory, Disk, FPS, Network, Startup Time) | Android 9+ | All versions |
| Network Logs (HAR) and Device Logs | Android 9+ | All versions |
| Battery Energy | Not supported | All versions |
| ANR Monitoring | Android 9+ | Not supported |
Got any questions?
Please reach out at our 24x7 Chat Support or you could also mail us at [email protected].
