

Power Your Software Testing with AI Agents and Cloud
The Native AI-Agentic Cloud Platform to Supercharge Quality Engineering. Test Intelligently and Ship Faster.


- TestMu AI (Formerly LambdaTest)
- /
- Blog
- /
- Network Performance Testing: Metrics, Types, Tools and How to Test
Network Performance Testing: Metrics, Types, Tools and How to Test
Network performance testing explained: throughput, latency, jitter and packet loss, test types, iPerf and other tools, and how to test apps on slow networks.
Published on:
Network performance testing checks how much data a network can carry, how fast, and how reliably. It also shows what your app does when the network is the weak link.
This guide covers the metrics, test types, steps and tools for testing a network, with iPerf3 commands you can run today. It then shows how to test an app on slow and unstable connections on TestMu AI real devices.
TL;DR
- Network performance testing measures throughput, bandwidth, latency, jitter and packet loss to show how well a network moves data.
- iPerf3 measures network throughput with a TCP test, and its UDP test at a fixed bitrate measures jitter and packet loss.
- Network performance testing sends active synthetic traffic, while network monitoring passively watches production traffic, so teams need both.
- Lighthouse's mobile baseline of 150 ms latency, 1.6 Mbps down and 750 Kbps up is a realistic starting profile for app tests.
- Throttled app tests catch missing timeouts, retry storms, lost offline writes and duplicate payment orders before users hit them.
- TestMu AI Real Device Cloud runs Appium tests on 10,000+ real Android and iOS devices with 2G to 5G and offline profiles.
What Is Network Performance Testing?
Network performance testing measures how well a network moves data by checking throughput, bandwidth, latency, jitter and packet loss. It finds bottlenecks before users do. It also proves whether a change, such as a new router, ISP or CDN, made the network faster.
Teams run it for two different reasons.
| Question | Testing the network itself | Testing an app over the network |
|---|---|---|
| Who runs it | Network, IT and SRE teams | QA, mobile and performance engineers |
| What is measured | Throughput, latency, jitter and loss on links, routers and Wi-Fi | Load time, API timeouts, retries and offline behavior in the app |
| Typical tools | iPerf3, Wireshark, ping, traceroute | DevTools throttling, tc netem, throttled cloud devices |
| Outcome | A faster, more reliable network | An app that still works on a bad network |
Both are part of performance testing. The first half of this guide covers the network, and the second half covers apps.
When Should You Run Network Performance Tests?
Run them whenever the network or the traffic on it is about to change. The Ericsson Mobility Report June 2026 found that mobile network data traffic rose 23 percent between Q2 2025 and Q2 2026, so a link that was fine last year may not be fine now.
- Before and after a network change - a new ISP, router, firewall, VPN, SD-WAN or CDN. The before run is your baseline, and the after run proves the change helped.
- Before a traffic increase - a product launch, a sale, or a rollout of video calls or VoIP that adds load to the same links.
- Before launching in a new region - users far from your servers see higher latency, so measure from where they are.
- Before every app release - run the critical flows on throttled profiles, because a new feature can add requests or payload that only hurt on slow networks.
- After an incident - reproduce the slowdown under controlled conditions, then retest the fix with the same settings.
- On a schedule - a weekly baseline run catches gradual degradation that no single change explains.
How Is Network Performance Testing Different From Network Monitoring?
Testing sends its own traffic to answer a question, while monitoring watches real traffic to spot a problem (the IETF standard RFC 7799 calls these active and passive measurement methods).
| Question | Network performance testing | Network monitoring |
|---|---|---|
| Method | Active: sends synthetic traffic | Passive: observes production traffic |
| When it runs | Before and after changes, on a schedule, in CI | Continuously |
| What it answers | Can the network or app handle this condition? | Is something wrong right now? |
| Typical tools | iPerf3, tc netem, throttled test sessions | Flow collectors, SNMP dashboards, APM agents |
Use both. Monitoring tells you a link got slower, and a test reproduces the slowdown and shows whether your fix worked.
Which Network Performance Metrics Should You Measure?
Measure these five metrics together. A link can have plenty of bandwidth and still feel slow because of latency or loss.
| Metric | What it measures | How to measure it |
|---|---|---|
| Bandwidth | The maximum capacity of a link, such as 100 Mbps | Provider spec, then confirm with a throughput test |
| Throughput | The rate of data actually delivered end to end | iPerf3 TCP test between two hosts |
| Latency | The time a packet takes to travel, usually as round-trip time | ping, or the RTT in a TCP test |
| Jitter | Variation in delay between packets | iPerf3 UDP test, or packet timestamps in Wireshark |
| Packet loss | The share of packets that never arrive | iPerf3 UDP test, or ping over a long run |
Jitter is the variation in delay between packets. If one packet takes 40 ms and the next takes 60 ms, the jitter is 20 ms (the IETF standard RFC 3393 calls it IP packet delay variation).
Voice, video and WebRTC calls feel jitter first, because they play packets in real time.
Throughput never exceeds bandwidth, and in practice it is lower. The gap tells you how much latency, congestion and loss cost you on that link.
What Are the Types of Network Performance Tests?
RFC 2544, the internet standards body's method for benchmarking network devices, still shapes how network tests are designed. It defines throughput as the fastest rate a device can forward traffic without losing any of it.
- Throughput testing - finds the highest rate a link or device carries without dropping data.
- Latency and jitter testing - measures delay and its variation. RFC 2544 says a latency test "MUST be repeated at least 20 times" and the average reported.
- Packet loss testing - sends traffic at a range of rates and records what share is lost at each one. RFC 2544 starts at 100% of the maximum rate and steps down in 10% intervals.
- Load and stress testing on the network - pushes traffic past normal levels. It shows where the link or device starts dropping packets, and it is the network-side counterpart of load testing a server.
- Recovery testing - checks how fast the network returns to normal after an overload, a reset or a failover. RFC 2544 calls these the system recovery and reset tests.
- Application testing over the network - runs the real app on throttled or degraded connections. The second half of this guide covers it.
How Do You Test Network Performance?
The steps are the same whether you test one office link or a path across regions.
- Set the goal - name the question, such as "can this link carry 50 video calls" or "did the new CDN cut latency for users in India".
- Record a baseline - measure throughput, latency, jitter and loss before you change anything.
- Pick the endpoints - test between the locations real traffic travels, such as office to data center or user region to API region.
- Generate traffic for long enough - RFC 2544 sets at least 60 seconds for steady-state trials and 120 seconds for latency streams.
- Repeat at different times - run the test at peak and off-peak hours, because congestion changes the result.
- Compare against the baseline - fix the largest gap first, then retest with the same settings.
iPerf3 is the usual tool for the traffic step. The iPerf3 project at ESnet describes it as active measurement of "the maximum achievable bandwidth on IP networks," reporting "the measured throughput, loss, and other parameters" for each test.
# On the server host
iperf3 -s

# TCP throughput for 30 seconds over 4 parallel streams
iperf3 -c iperf3.example.com -t 30 -P 4

# Reverse the direction so the server sends to the client
iperf3 -c iperf3.example.com -R

# UDP at a fixed 10 Mbps target bitrate
iperf3 -c iperf3.example.com -u -b 10M
Run the TCP test for throughput and the UDP test for jitter and loss. Use -R to test the download direction, which often differs from upload on consumer links.
Which Tools Are Used for Network Performance Testing?
Pick the tool by the question you are asking. Measuring a network and degrading one need different tools.
| Tool | What it does | Use it to |
|---|---|---|
| iPerf3 | Generates TCP or UDP traffic between two hosts | Measure throughput, jitter and loss on a path |
| Wireshark | Captures and decodes packets | Find retransmissions, resets and slow handshakes |
| ping and traceroute | Send echo requests and trace each hop | Check latency and find the hop where delay starts |
| Linux tc netem | Adds delay, loss and rate limits to an interface | Recreate a bad network in a lab |
| Chrome DevTools throttling | Slows a browser tab's requests | Check a web page on slow profiles |
| TestMu AI Real Device Cloud | Runs real phones on throttled network profiles | Test native and mobile web apps on slow networks |
The Linux tc-netem manual page describes netem as network emulation for "testing protocols by emulating the properties of real-world networks." The commands below come from that page.
# Add 100 ms of delay to every packet on eth0
tc qdisc add dev eth0 root netem delay 100ms

# Change the rule to drop 0.1% of packets at random
tc qdisc change dev eth0 root netem loss 0.1%
For a quick check of your own connection before a test, use the internet speed test from the region you serve.
How Does a Slow Network Affect Your App?
For an app team, the network is a test condition you control, and one part of mobile performance testing. Google's Lighthouse throttling documentation sets its mobile standard at 150 ms latency, 1.6 Mbps down and 750 Kbps up.
Lighthouse says those values represent roughly the bottom 25% of 4G connections and the top 25% of 3G connections. Its profile also sets "Packet loss: none", so loss has to be tested on purpose. Slower profiles still matter: the Ericsson report finds only half of mobile data traffic is carried over 5G.
The preset profiles in TestMu AI's Appium network throttling cover the poorer and better ends of that range. Values below are from the TestMu AI docs.
| Profile name | Download (Kbps) | Upload (Kbps) | Latency (ms) | Use it to test |
|---|---|---|---|---|
| 2g-gprs-poor | 20 | 6 | 1000 | Worst case: does the app load at all? |
| 2g-gprs-good | 50 | 16 | 500 | Text-first screens and timeouts |
| 3g-umts-poor | 200 | 64 | 400 | Image-heavy screens and retries |
| 3g-umts-good | 5000 | 2000 | 100 | Faster than the Lighthouse baseline |
| 4g-lte-poor | 1000 | 500 | 200 | Congested 4G, high latency |
| 4g-lte-good | 15000 | 7000 | 70 | Typical urban 4G |
| 4g-lte-advanced-good | 25000 | 12000 | 20 | Best-case mobile baseline |
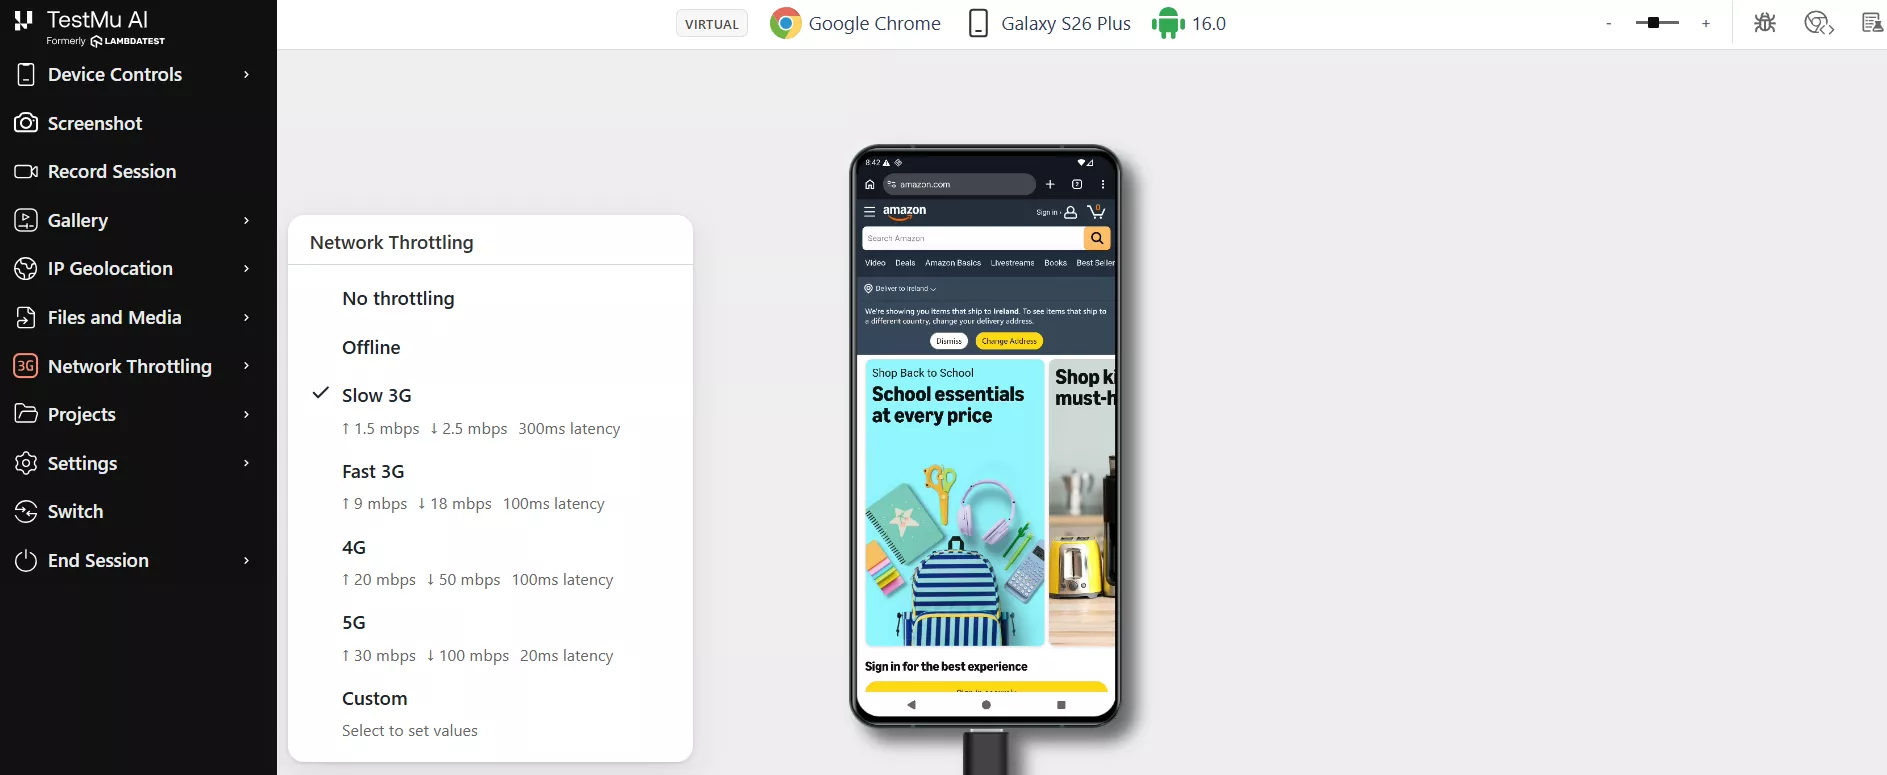
In a live session, the same choice sits in the Network Throttling menu: No throttling, Offline, Slow 3G, Fast 3G, 4G, 5G and Custom, each labeled with its upload, download and latency values.
On each profile, measure what the user waits for:
- Largest Contentful Paint (LCP) - for web pages, Google's LCP guidance on web.dev rates 2.5 seconds or less as good and above 4.0 seconds as poor, measured at the 75th percentile of page loads.
- Time to first usable screen - for native apps, time from launch or tap until the user can act. It sits alongside startup time and frame rate in the core mobile app performance metrics.
- API timeouts and retries - which calls exceed your client timeout, and how many times each repeats.
- Payload size - on a 50 Kbps 2G profile, a 2 MB image (about 16,000 kilobits) takes 320 seconds to download.
- Offline and network switching - whether queued actions survive a dropped connection and requests retry when Wi-Fi hands over to 4G.
For a step-by-step walkthrough on mobile web, see how to test mobile websites on different network conditions.
What Breaks When the Network Is Slow?
Throttled runs are designed to catch the defects below. Write one test case for each and run it on your poorest profile, such as 3g-umts-poor with its 400 ms latency.
- Network calls on the main thread - the UI freezes until a slow response returns, which can trigger an ANR on Android.
- Missing or infinite timeouts - a spinner that never ends on 2G, because the client waits forever for a response.
- Retry storms - every failed call retries immediately, which multiplies traffic on the connection that is already struggling.
- Lost offline writes - a form submitted while offline disappears instead of syncing when the connection returns.
- Duplicate actions - a slow payment response makes the user tap again, and the order is placed twice.
- Oversized first loads - full-resolution images and unused bundles that are fine on Wi-Fi and unusable on 3G.
The duplicate-action case matters most on payment and booking flows. Tap the submit button twice on the throttled profile and assert that the backend records one order.
How Do You Test App Network Performance on Real Devices?
Emulators and simulators are the fastest way to check throttled flows early, and TestMu AI's Appium network throttling works on both virtual and real devices. Before a release, run the same tests on real devices, where real memory limits, chipsets and radio hardware shape how the app copes with a slow connection.
On TestMu AI's real device cloud, you pick from 10,000+ real Android and iOS devices and set a 2G, 3G, 4G, 5G, offline or custom network profile for the session.
When a throttled test fails, the session's network log shows which request caused it, with request URLs, response codes, response times and payload sizes. CPU, memory and network throughput are recorded over the same timeline.
- Pick the devices your analytics show on slow networks, not only flagships.
- Start each Appium session with the network and networkProfile capabilities set to your baseline profile.
- At the point in the flow you want to stress, switch profiles with the updateNetworkProfile hook, for example during checkout or a file upload.
- Assert on what the user sees, such as a loading state that appears, a request that retries, and a screen that completes within your budget.
- Open the session's network log to find which calls timed out or downloaded the most data. To capture full response bodies or include and exclude specific domains, see network configurations in real devices.
The capabilities and hooks below follow the network throttling for Appium tests documentation.
# Appium on TestMu AI real devices: start on a throttled profile
caps = {
    "network": True,
    "networkProfile": "3g-umts-good"
}

# Mid-test: drop to a poor 4G profile without restarting the session
driver.execute_script("updateNetworkProfile=4g-lte-poor")

# Mid-test: apply custom values (Kbps and ms)
driver.execute_script("customNetworkProfile: { \"downloadSpeed\": 500, \"uploadSpeed\": 250, \"latency\": 100 }")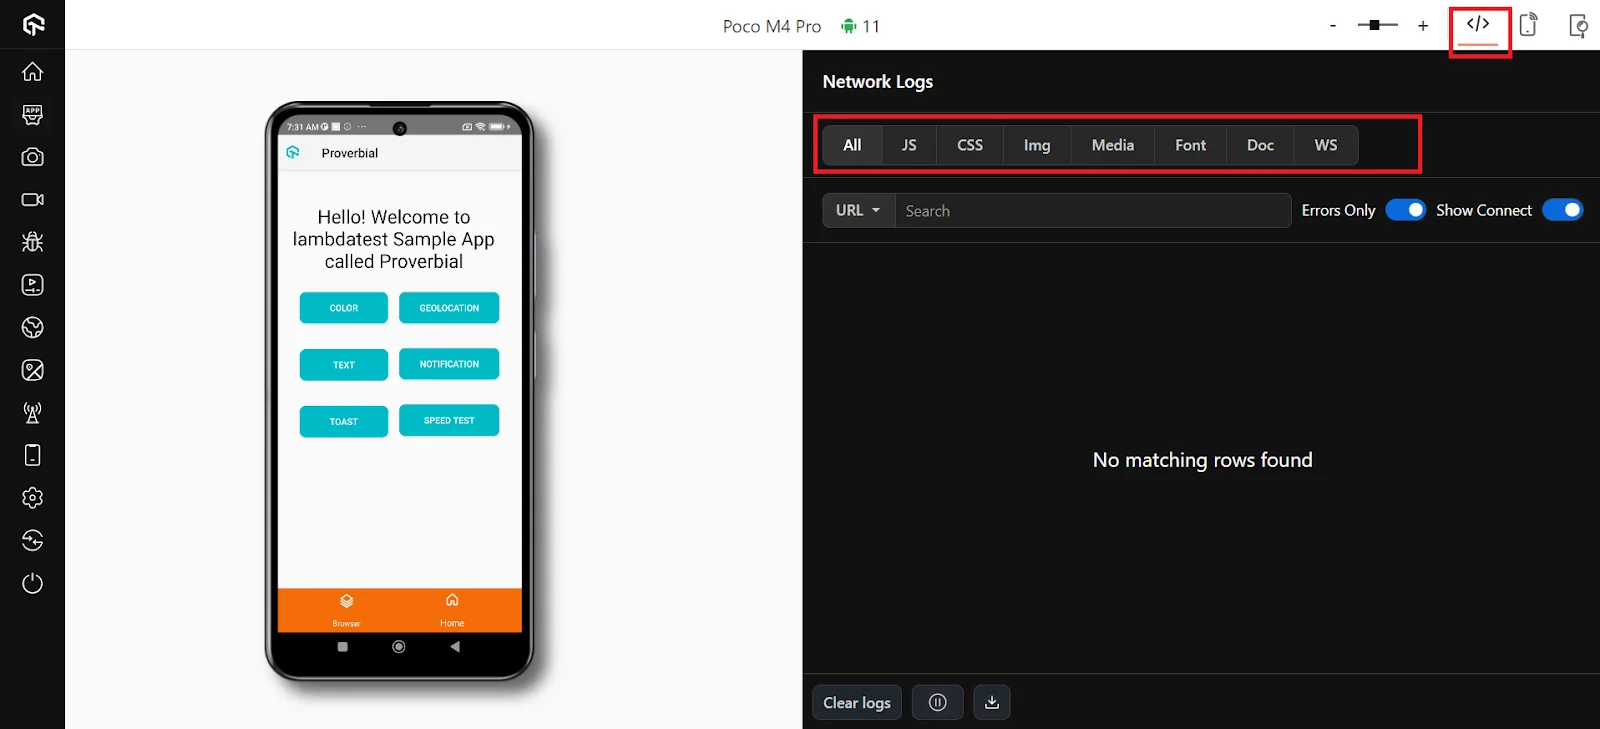
Use the network log to find the fix. Filter by request type (JS, CSS, Img, Media, Font, Doc or WS) or switch on Errors Only, then sort by response time or payload size to see which requests block the screen.
To assert on those requests in code, see the guide to automation scripts for checking network traffic.
Web Tests on Throttled Browsers
For browser tests, the network throttling for Selenium tests capability takes a preset such as Offline, GPRS, Regular 2G, Good 3G or Regular 4G. A custom profile sets download, upload and latency for anything else.
// Selenium on TestMu AI: start the session on a preset network profile
DesiredCapabilities capabilities = new DesiredCapabilities();
capabilities.setCapability("networkThrottling", "Regular 3G");
For quick manual checks, Chrome DevTools offers Fast 4G, Slow 4G, 3G and Offline in the Network panel. The Chrome DevTools throttling settings documentation also shows how to add packet loss in percent to a custom profile.

Note: Test your app on 3G, 4G, 5G and offline profiles across 10,000+ real Android and iOS devices on TestMu AI. Start testing on real devices for free
How Does Network Latency Affect Performance Under Load?
A slow network also changes what your servers see. Users far from your API region add round-trip time to every request, so the same backend can look fast from one region and slow from another.
To see that gap before users do, run your JMeter, Gatling or k6 (up to version 0.52) plans with TestMu AI cloud performance and load testing from six named regions, with up to 8,000 concurrent virtual users on the Pro plan. The product page notes that "splitting users across regions reveals region-specific latency and CDN behaviour that a single-region run misses" and lets you weight traffic to match where customers are.
Multi-region load is part of the Enterprise plan; the Free, Basic and Pro plans load from a single region.
- Split the load by the share of users in each region, such as East US, Central India and Southeast Asia.
- Compare p95 and p99 response times and error rates by region in the same run.
- If one region is much slower, check CDN coverage and API placement before tuning the code.
How Do You Add Network Performance Tests to CI?
Running every test on every profile multiplies run time, so split the suite by how often it runs.
- Every pull request - your critical paths (launch, login, search, checkout) on one custom profile set to the Lighthouse values of 150 ms, 1.6 Mbps down and 750 Kbps up.
- Nightly - the same paths as a matrix across a poor profile, the baseline and a good 4G profile, plus the offline and network-switch cases.
- Weekly - an iPerf3 run between your user regions and your API region, compared against last week's baseline.
- Before a release - the nightly matrix on the device list your analytics show for your slowest markets, plus a multi-region load run.
Fail the build on performance budgets as well as assertions. A web LCP above the 2.5-second "good" threshold on the baseline profile, or any critical API call beyond your client timeout, should block a merge.
Conclusion
Start network performance testing with a baseline: one iPerf3 run between your users' region and your API, and one critical app flow, such as checkout, on a 3g-umts-poor profile and offline. Record throughput, latency, LCP or time to first usable screen, and the slowest request in the network log.
For the app side, set the networkProfile capability from the Appium throttling docs, run the flow on TestMu AI Real Device Cloud, and add it to your nightly pipeline once the baseline holds.
Author

Shantanu Wali
Blogs: 9

Shantanu Wali is Vice President of Product Management at TestMu AI (formerly LambdaTest), where he owns several product lines across the testing platform, including the Real Device Cloud and the Digital Experience Testing Cloud. He has also contributed significantly to the development and scaling of KaneAI, TestMu AI's flagship GenAI-native testing agent that uses natural language to make software testing faster and more reliable in this AI era. He brings 7+ years of experience across software development and product management, starting as a backend developer at Infosys building solutions for Fortune 500 clients. Shantanu holds an MBA from IIM Calcutta and a B.Tech in Mechanical Engineering.
Reviewer

Sawan Garg
Reviewer
Sawan Garg is Senior Vice President of Engineering at TestMu AI (formerly LambdaTest), leading platform and infrastructure engineering across the testing cloud. He designed the microservices architecture and databases behind the platform and built the streaming technologies, including VNC, Guacamole, and WebRTC, that deliver live and real-time testing. He also contributed to the distributed proxy-based Tunnel that lets teams test firewall-protected and locally hosted websites. He brings 13+ years of engineering experience across Python, Java, Golang, Node.js, Kafka, Elasticsearch, Redis, and Kubernetes. Sawan holds a B.Tech in Computer Science and Engineering.


Network Performance Testing FAQs
Did you find this page helpful?
More Related Blogs
TestMu AI forEnterprise
Get access to solutions built on Enterprise
grade security, privacy, & compliance
- Advanced access controls
- Advanced data retention rules
- Advanced Local Testing
- Premium Support options
- Early access to beta features
- Private Slack Channel
- Unlimited Manual Accessibility DevTools Tests