

Power Your Software Testing with AI Agents and Cloud
The Native AI-Agentic Cloud Platform to Supercharge Quality Engineering. Test Intelligently and Ship Faster.


- TestMu AI (Formerly LambdaTest)
- /
- Blog
- /
- Introducing Thunder: Load Tests From What You Already Have
Introducing Thunder: Load Tests From What You Already Have
Thunder by TestMu AI is a free Chrome extension that turns a recording, cURL or API spec into a correlated JMeter or k6 load test and replays it before you run.
Published on:
Thunder by TestMu AI launches today in beta: a free Chrome extension that writes the load test for you, correlates it, proves it works, and then runs it at scale on HyperExecute.
You know the moment it is built for. A script runs perfectly with one user, you scale to 500, and the dashboard fills with 401s. What the test found was a stale token, a CSRF value recorded once and replayed 500 times, or a login result only one thread could see, and hours go into correlation before a single meaningful number comes back.
TL;DR
Thunder by TestMu AI is a free Chrome extension, in beta, that turns what you already have, such as a browser recording, an API spec, or a Postman collection, into a correlated JMeter or k6 load test. Thunder replays the plan at one user in your browser, then runs it at scale on HyperExecute.
What Thunder Does
- Input sources: Thunder accepts eight inputs: a Chrome recording, cURL commands, an OpenAPI or Swagger spec, a Postman collection, an Excel or CSV sheet, a list of page URLs, an existing .jmx, and a TestMu AI automation session ID.
- Auto-correlation: Thunder finds values a server issues in one response, wires them into later requests, and lists each one with the rule that matched, a confidence level, and the two requests it travels between.
- Replay: Thunder runs the finished plan once, at one user, inside the browser, reports each request's status code, and proposes the correlation a failed request was missing.
- Output files: Thunder writes a plain Apache JMeter .jmx and renders the same plan as a k6 script with thresholds, groups, and checks. A recording also yields its HAR and, with browser steps recorded, a Playwright script.
- Benchmark result: In an auto-correlation benchmark using a recording with eight planted dynamic values, Thunder correlated 8 of 8 and BlazeMeter's free HAR converter correlated 0 of 8. TestMu AI re-ran the test on 1 October 2026 with the same result.
What You Need to Run Thunder
- Price: Thunder is free and in beta. Running a plan on HyperExecute draws on the performance testing plan of your TestMu AI account, and the run form shows your limits first.
- Requires an account: Yes. Thunder opens only when the browser is signed in to a TestMu AI account, which is free to create, and it never asks for an access key.
- Uploads your recording: No. Thunder's engine runs in WebAssembly inside the extension, so the recording and the plan stay in your browser unless you send the plan to HyperExecute.
- Supported browsers: Thunder runs on Chrome 116 or newer and other Chromium browsers such as Edge and Brave. Thunder does not run on Firefox or Safari.
- Requires JMeter installed: No. Thunder authors, replays, downloads, and triggers a plan without JMeter on your machine. JMeter is needed only to run the .jmx locally.
- Installation: Thunder's beta installs from GitHub as an unpacked extension through Chrome's Load unpacked option. Thunder has no Chrome Web Store listing yet.
Start From What You Already Have
Most teams already hold the raw material for a load test: a Postman collection somebody maintains, an OpenAPI spec in the repo, or a cURL command pasted into a ticket. Thunder takes any of them, and all eight sources feed the same engine.
On 1 October 2026 we ran the sample file for each source in Thunder's public repository through the engine. The last column is what came back.
| Source | What Thunder does with it | Result from the sample file |
|---|---|---|
| Browser recording | Records in your own Chrome profile, with SSO and VPN intact, and captures response bodies | Kept 3 of 58 recorded requests with Keep set to api; 42 static assets and 13 third-party calls dropped |
| cURL commands | Reads -X, -H, -d, -F and -u, and sends a POST body raw instead of URL-encoded | 3 commands became 3 requests |
| OpenAPI or Swagger spec | Takes a file or a URL and keeps path parameters as variables | 3 requests; /products/{id} became /products/${ID} |
| Postman collection | Turns folders into Transaction Controllers and environment chaining into extractors | 3 requests, 2 transactions, 1 extractor |
| Excel or CSV sheet | Reads the assert and extract columns into real assertions and extractors | 3 requests, 4 assertions, 1 extractor |
| List of page URLs | Fetches each page and reads its HTML for scripts, stylesheets, images and forms | 1 URL became 19 samplers; 5 third-party resources dropped |
| Existing .jmx | Checks the file's encoding, characters and XML structure, and reports problems by line and column | 6 requests read; 1 undefined variable flagged |
| TestMu AI session ID | Converts a Selenium automation session into a plan grouped by the steps the test performed | Not run for this post; it needs a signed-in session |
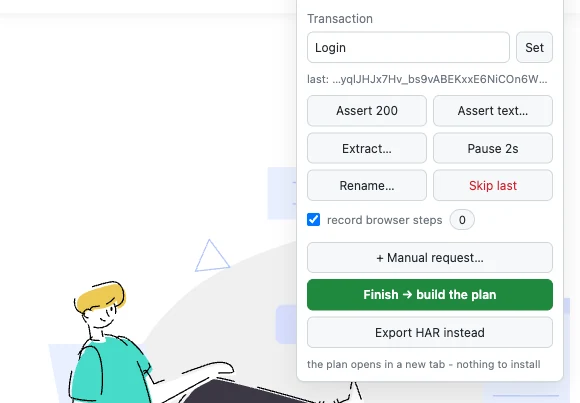
A recording is the one source you can annotate as you browse. While Thunder records, a panel on the page sets the transaction that each following request lands in, and its buttons add an assertion, a JSON extractor, a pause or a new label to the last request captured, or drop it from the plan. This screenshot from the product documentation shows the panel on a demo site:
Plans built from cURL, an OpenAPI spec or a Postman collection are API tests from the first request. That makes Thunder the authoring step for API load testing on the same managed cloud generators.
If you run Selenium tests on TestMu AI, set network.full.har to true in the test capabilities, the same switch that feeds the HAR log viewer, and each automation session already holds what a load test needs. Thunder reads it by session ID, with nothing recorded again.
To look inside a recording before you hand it over, the free HAR file viewer opens it in the browser.
Correlation You Can Audit
Thunder finds the values a server issues in one response and wires them into the requests that use them: JWTs, CSRF tokens, OAuth codes, ViewState, nonces, cart and order IDs. Each decision is listed with the rule that matched, a confidence level, and the hop the value travels.
This is what the engine's command-line report printed for the eight-request journey in our benchmark on 1 October 2026; the extension lists the same rows on its Correlations tab:
  correlated 8 value(s):
    ${CSRF_TOKEN}            heuristic          low       from body     GET /login -> POST /login
    ${VIEWSTATE}             asp.net-viewstate  high      from body     GET /login -> POST /login
    ${ACCESS_TOKEN}          bearer-token       high      from body     POST /login -> GET /oauth/authorize
    ${CODE}                  oauth-code         high      from headers  GET /oauth/authorize -> GET /callback
    ${X_REQUEST_TOKEN}       heuristic          low       from headers  POST /login -> GET /callback
    ${CART}                  heuristic          low       from body     GET /api/carts -> POST /api/checkout
    ${NONCE}                 oauth-state        medium    from body     GET /api/carts -> POST /api/checkout
    ${ORDER_ID}              heuristic          low       from body     POST /api/checkout -> GET /api/orders/904173
  4 of those matched no rule - review them before a long run
We show the rule and the confidence because auto-correlation that guesses wrong silently is worse than none: the plan still runs, and the numbers mean nothing. The four rows marked low matched no named rule, so the report asks you to review them before a long run. All eight were right here, which the benchmark below scores independently.
Logins get the same care. Give Thunder the login request and the token path, and it moves the login into a setUp Thread Group, runs it once, and publishes the token as a JMeter property that every user thread reads.
The JMeter user manual states why it has to be a property: variables are local to a thread, and properties are common to all threads.
A token that one thread extracts into a variable is invisible to every other thread, which is the usual reason a plan passes with one user and fails with 500.
We checked that behaviour against a public demo API with two users in JMeter 5.6.3:
- Login - ran once, in the setUp thread, and published the token.
- Protected endpoint - both user threads passed GET /auth/me with the token read back as ${__P(AUTH_TOKEN)}.
- Result - 5 of 5 samples passed.
Proof Before You Pay for Load
A failed load run costs virtual-user hours and an afternoon. Thunder checks every plan as it is built: XML validity, loadability, missing files, undefined variables, and a heap and CPU checklist. In our sample runs it flagged a missing CSV file in one plan and an undefined variable in another before either reached a runner.
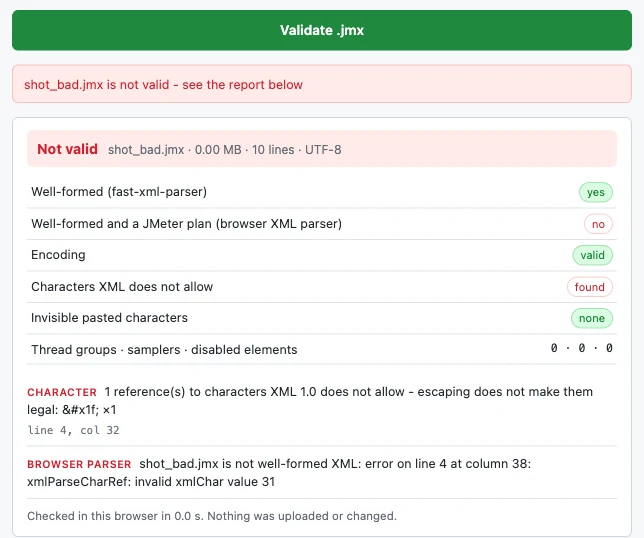
A .jmx you bring gets a report of its own. This one finds a character that XML 1.0 does not allow at line 4, column 32, and ends by saying the file was checked in the browser and nothing was uploaded:
Replay then runs the plan once, at one user, inside your browser. When a request fails, Replay looks for a value an earlier response handed out, traces it back through the recording, and proposes the extractor the request needed.
We built the benchmark plan with correlation switched off and replayed it against a server that rejects stale values, running the extension's replay code from the command line. Our harness printed this on 1 October 2026:
== replay 1: the plan as authored
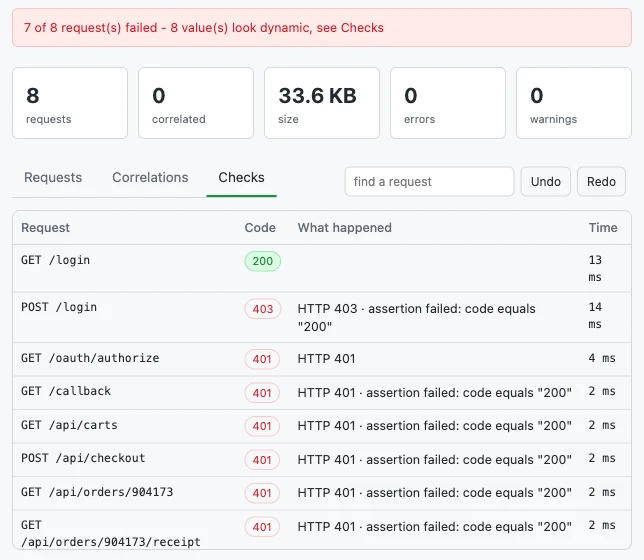
7 of 8 request(s) failed - 8 value(s) look dynamic
  ok    200  GET /login
  FAIL  403  POST /login - HTTP 403 · assertion failed: code equals "200"
  FAIL  401  GET /oauth/authorize - HTTP 401
  FAIL  401  GET /callback - HTTP 401 · assertion failed: code equals "200"
  FAIL  401  GET /api/carts - HTTP 401 · assertion failed: code equals "200"
  FAIL  401  POST /api/checkout - HTTP 401 · assertion failed: code equals "200"
  FAIL  401  GET /api/orders/904173 - HTTP 401 · assertion failed: code equals "200"
  FAIL  401  GET /api/orders/904173/receipt - HTTP 401 · assertion failed: code equals "200"
It then listed each stale value with the response that had handed it out and the request that needed it:
  values that look dynamic:
    ${CSRF_TOKEN}  c5f1e8a9b27d4c3e9f0a6b1d2e4f  GET /login -> POST /login  (boundary)
    ${VIEWSTATE}  dDwtMTI3OTMzNDM4NDs7Pg+/Zx9=  GET /login -> POST /login  (boundary)
    ${ACCESS_TOKEN}  eyJhbGciOiJIUzI1NiJ9.eyJzdWI  POST /login -> GET /oauth/authorize  (json)
    ${CODE}  ac_7HkP2sQx9Lm4Wn6R           GET /oauth/authorize -> GET /callback  (regex)
    ${X_REQUEST_TOKEN}  rt.K8p3Xq6Vz1Nm5Bw7           POST /login -> GET /callback  (regex)
    ${CART}  cart-3b7f9e21                 GET /api/carts -> POST /api/checkout  (json)
    ${NONCE}  n-5e2b9c71-3f4a-4d8e-a1b6-0c  GET /api/carts -> POST /api/checkout  (json)
    ${ORDER_ID}  904173                        POST /api/checkout -> GET /api/orders/904173  (json)
The same check in the extension lands on the Checks tab, shown here in a screenshot from the product team:
We then applied Replay's suggestions and ran the plan again:
- Suggestions applied - all 8, each adding an extractor and replacing the stale value everywhere it appeared.
- Second replay - every request passed.
- JMeter 5.6.3 - the repaired plan passed 8 of 8 requests, against the app as recorded and against a changed build.
Replay is a pre-flight and makes no claim about load. It skips JSR223, JDBC and WebDriver steps and counts them as skipped, never as passed.
Your Recording Stays in Your Browser
A recording of a logged-in session holds session tokens, personal data and internal hostnames. Thunder's authoring engine ships inside the extension and runs in WebAssembly, so capture, authoring and the finished plan stay on your machine, and the extension collects no analytics.
The product documentation lists every outbound call the extension makes:
- Your target - the site you are recording or replaying against, plus any spec or page URL you give it as a source.
- TestMu AI account service - to look up the account the browser is signed in to.
- HyperExecute API - only when you choose to run there, which uploads the plan and its data files.
- Session log API - only when the source is a TestMu AI session ID.
No access key is typed or stored. Thunder reads the browser's TestMu AI sign-in, asks the account service for the matching credentials, and keeps them in page memory until the page closes.
BlazeMeter's Chrome extension makes a different trade. It is free, but its documentation states that converting a recording into a .jmx requires a BlazeMeter account because the conversion is performed on the server side, and that the script is uploaded to BlazeMeter.
For teams in banking, healthcare and other regulated industries, where a logged-in recording counts as sensitive data, that is one less data flow for a security review to approve.
Thunder asks for Chrome's debugger permission because the DevTools protocol is how it reads response bodies, and correlation depends on them. Chrome shows a banner for as long as it is attached, and it attaches only to a tab you start recording.
One Plan, JMeter or k6
The .jmx Thunder writes is plain Apache JMeter. It runs on a laptop, in Jenkins, on HyperExecute, or on any other platform that runs JMeter, so nothing locks you in.
- .jmx - the plan, with transactions, assertions, extractors and a parameterised load profile.
- HAR - the recording itself, annotations included, when the source is a recording.
- Playwright script - the browser steps as a Python test, when you tick record browser steps before you start.
- k6 script - the same plan in JavaScript, with a group per transaction and checks from the plan's assertions.
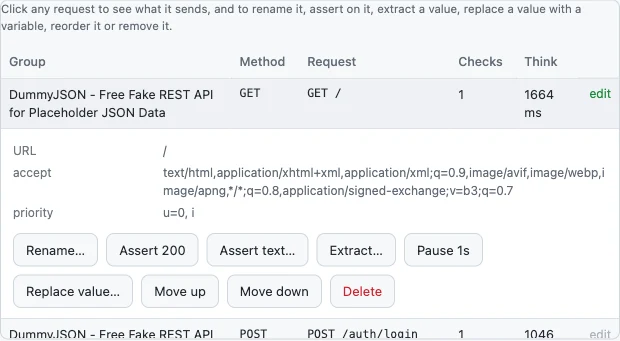
Before you download anything, you can edit the plan. Click a request on the Requests tab to see the URL, headers and body it will send, then rename it, assert on it, extract a value, replace a value with a variable, reorder it or delete it. Each edit is applied to the plan's spec, and the plan is rebuilt and checked again.
The k6 documentation on checks states that failed checks do not cause a test to abort or finish with a failed status.
Checks alone cannot fail a run, so the k6 script Thunder generates always carries thresholds. These are the threshold lines of the script it generated for the benchmark journey, with the scenario settings left out:
const MIN_CHECKS = __ENV.MIN_CHECKS || "0.99";
const MAX_FAILED = __ENV.MAX_FAILED || "0.01";
const MAX_P95 = __ENV.MAX_P95 || "";

export const options = {
  // ...
  thresholds: {
    checks: ["rate>" + MIN_CHECKS],
    http_req_failed: ["rate<" + MAX_FAILED],
    ...(MAX_P95 ? { http_req_duration: ["p(95)<" + MAX_P95] } : {}),
  },
};
We ran that script with k6 v2.2.0 against the benchmark server on 1 October 2026. It exited with code 0, and its summary read:
Checks passed         100.00%
Requests              16
Requests failed       0.00%
Duration avg          1 ms
Duration p(95)        2 ms
Duration max          2 ms
Iterations            2
Virtual users, most   1
Pointed at a stopped server, the same script exited with code 99, and k6 reported the checks and http_req_failed thresholds as crossed.
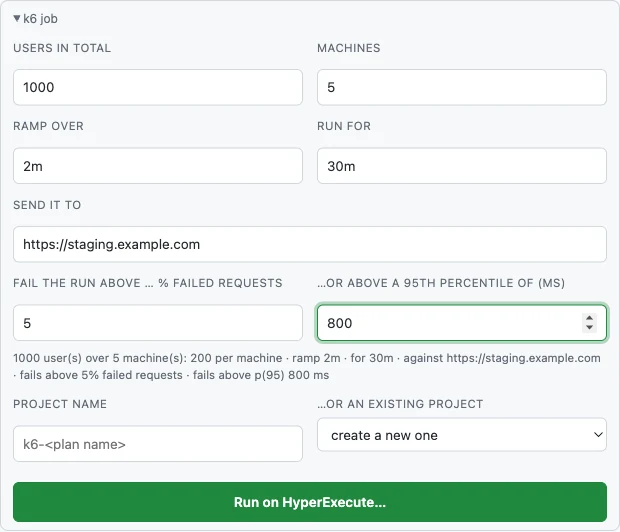
The thresholds read their limits from environment variables, so the same script runs at any size without edits. The k6 job panel on the authoring page sets the failed-request and 95th-percentile limits per run, along with users, machines, ramp, duration and the host to send traffic to, then reads the settings back as a sentence before anything starts:
If k6 is new to your team, our k6 testing tutorial covers scripts, checks and thresholds from the start.
Thunder Benchmark Results and Method
The original benchmark ran on 17 September 2026 against BlazeMeter's free HAR converter, on the same input. Its method, inputs and scoring script are written up so the numbers can be disputed or reproduced.
We re-ran the first three rows on 1 October 2026 before publishing, and the run column says which figures are from that day.
| Test | Thunder | BlazeMeter HAR converter | Run |
|---|---|---|---|
| Planted dynamic values correlated | 8 of 8 | 0 of 8 | Re-run, 1 October 2026 |
| Live server, requests passed in JMeter | 8 of 8 | 1 of 8 | Re-run, 1 October 2026 |
| After the app changed (drift build) | 8 of 8 | 1 of 8 | Re-run, 1 October 2026 |
| Samplers from a real 157-request session | 21 | 157 | 17 September 2026 |
| Static-asset samplers in that plan | 0 | 99 | 17 September 2026 |
The last two rows come from the original run, because the session capture behind them is not published with the scripts. For the live-server row, this is each request's result in the re-run, tabulated from the result files JMeter 5.6.3 wrote. Thunder's plan:
== Thunder plan, app as recorded: 8 of 8 HTTP samples passed
  PASS  200  GET /login
  PASS  200  POST /login
  PASS  302  GET /oauth/authorize
  PASS  200  GET /callback
  PASS  200  GET /api/carts
  PASS  200  POST /api/checkout
  PASS  200  GET /api/orders/{order_id}
  PASS  200  GET /api/orders/{order_id}/receipt
  JMeter, transaction Recorded: Number of samples in transaction : 8, number of failing samples : 0
The plan from BlazeMeter's converter, same server, same run settings:
== BlazeMeter converter plan, app as recorded: 1 of 8 HTTP samples passed
  PASS  200  https://shop.example.test/login
  FAIL  403  https://shop.example.test/login
  FAIL  401  https://shop.example.test/oauth/authorize?client_id=web&response_type=code
  FAIL  401  https://shop.example.test/callback?code=ac_7HkP2sQx9Lm4Wn6R&state=xyz
  FAIL  401  https://shop.example.test/api/carts
  FAIL  401  https://shop.example.test/api/checkout?cart=cart-3b7f9e21
  FAIL  401  https://shop.example.test/api/orders/904173
  FAIL  401  https://shop.example.test/api/orders/904173/receipt?lang=en-US
failures by code: 6 x 401, 1 x 403- Input - a synthetic recording with ten planted cases: eight values that must be correlated, one session cookie that belongs to the cookie manager, and one repeated value that is not dynamic.
- Scoring - a value counts as correlated only when the recorded literal is gone from every later request, a variable stands in its place, and an extractor in the plan finds the value in the recorded response. The script reads the XML and ignores what a plan reports about itself.
- Live server - a local mock shop that issues a fresh CSRF token, session, JWT, nonce, cart ID and order ID on every run and answers 4xx when a stale one arrives. The drift build changes the login form and an order status string.
- Thunder's side - the engine and replay code that ship in the extension, run from the command line with the authoring page's default options, one user, one iteration.
- Converter's side - only the synthetic recording went through BlazeMeter's public converter. Its plan failed with six 401 responses for a stale bearer token and one 403 for a stale CSRF token.
- Counting - the 17 September run reported 15 of 15 samples for Thunder on the live server. The re-run counts the 8 HTTP requests in one iteration.
- Scope - these results describe that converter and no other BlazeMeter product; its recorder was not tested. The session capture carried no response bodies, so neither tool correlated anything in that test.
BlazeMeter is ahead on reporting and on the platform around a test. Its reports include a dashboard that updates while a test runs, baseline comparison and trend charts across runs, and its platform adds service virtualization, API monitoring and test data. Thunder with HyperExecute gives you the job view and the JMeter HTML report, with no trend analysis yet.
Authoring is where teams lose their days, so that is where we started. For the wider category, see our comparison of performance testing tools.
One-Click Runs on HyperExecute
When the plan is ready, choose Run on HyperExecute. Thunder creates the project, uploads the plan and triggers the job as your signed-in TestMu AI account, with no CLI, no repo and no access key.
The job runs on Performance Testing by HyperExecute, the managed cloud load testing service from TestMu AI. It provisions the load generators, drives the run, tears the infrastructure down and reports the result, so there is no grid to build or keep alive between tests.
JMeter plans run there as their own project type, which is what Thunder creates for you. The page on running JMeter load tests in the cloud covers that path in full.
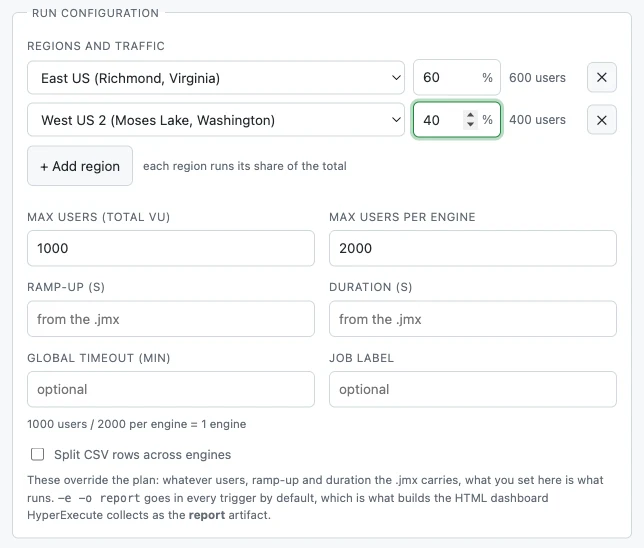
- Load overrides - users, ramp-up and duration set on the run form override whatever the .jmx carries.
- Regions - one row per region, each with its share of the users. The regions you may use depend on your plan.
- CSV split - each engine gets its own slice of the test data, so no two machines replay the same rows.
- Report - JMeter's HTML dashboard is collected as the job's report artifact.
- Plan check - before triggering, the form reads your account's limits and refuses a run over its user ceiling, job length or monthly virtual-user hours.
What you can run depends on your account's performance testing plan. The Free plan on the TestMu AI pricing page lists up to 100 concurrent virtual users, 100 VUH a month as an introductory offer, and a 40-minute maximum test duration.
For the reports a finished job gives you, see the JMeter on HyperExecute documentation. For regions and load distribution, see how to run performance tests at scale.

Note: Thunder signs in with your TestMu AI account, and creating one is free. Record a journey, replay it once, and send the plan to HyperExecute from the same window. Try TestMu AI free!
Limits in the Thunder Beta
Thunder is early, and these are the edges we know about. Each one comes from the product documentation or from our 1 October 2026 runs.
- Browsers - Chromium only: Chrome 116 or newer, Edge, Brave, Arc and Opera. Firefox does not implement the debugger API Thunder needs for response bodies.
- Sign-in - every surface, recording and export included, opens only when the browser is signed in to TestMu AI.
- Correlation needs responses - only a recording carries them, so plans built from cURL, OpenAPI, a spreadsheet or a URL list start with zero correlated values. Those sources reported 0 correlated in our sample runs.
- Low-confidence matches - on the sample recording the engine correlated the login token at high confidence and also treated the site's own host name as a dynamic value at low confidence, which is wrong. The report marks such rows for review, and removing one today means editing the plan's spec.
- Shared login - the Authentication option logs in once and shares one token across every user. For a login per virtual user, keep the login inside the recorded journey so each thread correlates its own token.
- Recorded Authorization headers - a pasted cURL that carries its own Authorization header keeps it. In our run that stale header overrode the fresh token and the request returned 401, so remove it before you generate the plan.
- Session source - Selenium sessions run with network.full.har only. Playwright sessions are not supported.
- Browser steps - recording them is off by default, and a browser-type plan runs at most 4 users per engine.
- k6 output - browser steps, JSR223 scripts, JDBC steps and any second thread group are left out, each named in a comment at the top of the script.
- Reporting - no trend analysis or run-to-run comparison yet. That is first on our list.
Get Started
Thunder's beta ships from GitHub as an unpacked Chrome extension.
The setup guide puts the whole path, from receiving the zip to a job on the dashboard, at about five minutes.
- Download the file ending in -share.zip from the repository's dist folder (version 1.8.17 at the time of writing) and unzip it somewhere permanent.
- Open chrome://extensions, turn on Developer mode, choose Load unpacked, and select the unzipped folder. Then pin it from the puzzle-piece menu, so the TestMu AI mark in the toolbar opens it.
- Sign in to your TestMu AI account in the same browser.
- Open the extension, choose cURL as the source, paste a request, and press Generate plan.
- Press Replay once, then Download .jmx or Run on HyperExecute.
Thunder is free and in beta. Tell us what breaks, which authentication schemes it has not met yet, and what you want next.
If you are planning the test around the script, our guide to load testing covers workload models and how to read the results.

Austin Siewert
Co-Founder, Steadfast Systems
Discovered @TestMu AI yesterday. Best browser testing tool I've found for my use case. Great pricing model for the limited testing I do 👏
2M+ Devs and QAs rely on TestMu AI
Deliver immersive digital experiences with Next-Generation Mobile Apps and Cross Browser Testing Cloud

Record once, replay once, then add load.
Author

Anmol Gupta
Blogs: 7

Anmol Gupta is Vice President of Product Management at TestMu AI (formerly LambdaTest), driving HyperExecute, the test orchestration cloud that runs and accelerates automated test execution. He led the development of the Unified Test Execution Cloud Platform and now leads a 30-member cross-functional product organization across product lines contributing $7M+ in revenue. He brings over nine years of experience and previously co-founded the SaaS company Timble as CTO, where he grew the team from 5 to 40 and launched an AI KYC platform that processed 600K+ applications in five months while cutting verification time from 12 minutes to under 30 seconds. Anmol holds an MTech and BTech from IIT Delhi.
Reviewer

Japneet Singh Chawla
Reviewer
Japneet Singh Chawla is an Engineering Manager at TestMu AI (formerly LambdaTest), where he leads a team driving HyperExecute, the AI-native Test Orchestration Cloud Platform, and integrations with Cypress, Provar, Tosca, and Selenium, improving test execution efficiency and driving adoption across 500+ enterprise clients. He also spearheaded zero-downtime deployments that cut release-related downtime by 90%, and mentors new engineers into productive contributors. He brings 9+ years of experience building and scaling distributed systems, SaaS platforms, and developer tools, with deep hands-on backend engineering across Golang, Python, Node.js, Kafka, and Redis. Earlier at Sumo Logic he built award-winning developer tools, including a VS Code Parser Linter, and at Indus Valley Partners he was a founding member of the Sentiment Analyzer team, building ML-powered solutions for financial clients. Japneet holds an MCA in Computer Science from GGSIPU.


Thunder FAQs
Did you find this page helpful?
More Related Blogs
TestMu AI forEnterprise
Get access to solutions built on Enterprise
grade security, privacy, & compliance
- Advanced access controls
- Advanced data retention rules
- Advanced Local Testing
- Premium Support options
- Early access to beta features
- Private Slack Channel
- Unlimited Manual Accessibility DevTools Tests