

Power Your Software Testing with AI Agents and Cloud
The Native AI-Agentic Cloud Platform to Supercharge Quality Engineering. Test Intelligently and Ship Faster.


- TestMu AI (Formerly LambdaTest)
- /
- Blog
- /
- Monitoring Network Traffic With Automation Scripts
Monitoring Network Traffic With Automation Scripts
Automated Monitoring Network Traffic enables real-time analysis, notification, and response to events, improving network security and performance.
Last Updated on:
Automation scripts check network traffic by recording every request and response a browser issues during a test run, then asserting on status codes, response times, and payload sizes.
Packet analyzers such as Wireshark read traffic at the network interface, while browser automation libraries expose the same requests through Chrome DevTools Protocol and WebDriver BiDi events.
This guide covers automation testing, network traffic, traffic inspection for a web application, what to look for, how to capture network traffic, how AI agents run these checks, and integrating automation with traffic monitoring.
Key Takeaways
- Network traffic is the full exchange of data between a browser and a server, including HTML, images, scripts, and API calls.
- Automated network traffic monitoring reports failed requests, slow responses, and unusual request volumes in real time instead of after a manual review.
- HTTP requests, HTTP response time, load time, failed requests, IP address, and location are the six parameters a traffic monitoring script should record.
- A status code of 400 means the request was malformed, and a status code of 500 means the server failed while processing it.
- Wireshark captures packets at the network interface, Observium tracks device health across a network, and pktmon is the in-box packet capture command on Windows.
- An AI agent can group failed requests from a HAR archive, but it cannot confirm that a 200 response carries the correct body.
What is automation testing?
A simplified process of developing a program to test software, automation testing reduces human effort. An automation testing program or script, written by developer uses test data. The data is automatically entered to generate output. This further creates an analysis of the entire data, measuring the efficiency of the program.
But Why do we need to automate the testing process?
As the name itself implies, automating specific tasks can profoundly reduce the effort required in addition to the investment of time and money. Automating a process means, no more human interaction for long hours to verify the working. It slashes the scope of human error, increases efficiency, and the scope of work.
Key Takeaway: Automation testing replaces repeated manual verification with a script that feeds test data in and reports the result, which cuts both human error and the hours spent checking the same behaviour twice.
What is network traffic?
Network traffic, in simple terminology, is the amount of data travelling through a network. Precisely put, the network traffic includes the entire exchange of data between a browser and server. For instance, when opening a website, downloading images, text and any other templates are included in the network traffic.
Watch this video to learn about network interception using bidirectional APIs in Selenium 4.

Key Takeaway: Network traffic covers every byte moving between a browser and a server, so a page that loads images, fonts, scripts, and API responses generates dozens of separate requests worth inspecting.
Traffic inspection for a web application
Now that we know what traffic is, let’s understand why it is necessary to monitor the traffic. For any web, application efficiency is the most critical factor. Also, one would like to keep a check on network usage and any possible data drain. Analyzing the traffics gives us such insights, making it easier to find solutions.
The process of inspecting traffic is simple. Once all the requests have been triggered on a web page, it is easy to collect the responses which in turn help the user find out the shortcomings (if any). This will help measure all the functioning and create reports to analyze the statistics.
Key Takeaway: Traffic inspection collects the responses to every request a web page triggers, which exposes wasted bandwidth, slow endpoints, and resources the page loads but never uses.
What should be looked for?
Whenever traffic monitoring is done, several parameters need special attention to get maximum accuracy.
- HTTP Requests: HTTP requests are packets of information communicated between the browser and the server. The higher the number of applications, the lower is the experience of the user. Browser caching is one technique which can bring down the number.
- HTTP Response: The time taken for the packet communication of the response needs to be reported precisely.
- Load Time: This includes the entire set of resources which have to be loaded for the webpage to open. This includes text, media, and other plugins.
- Failed Requests: There might be errors in the application or there might be some network issues. This leads to failed requests. Status Code of a Response will indicate if the request failed or succeeded. For example, a status code of 400 indicates that the request made was incorrect, or a status code of 500 indicates that the application had issues processing the request. A lot of failed requests might indicate some serious issues in the application.
- IP Address: requests from IP addresses need to be monitored. unusually high number of requests from the same IP address could mean that someone might be trying to attack your website with a DoS(Denial of Service) Attack. This will also allow you to discover what is the typical number of requests made per IP address per session.
- Location: Though it might not be possible to determine the originating location of all traffic, a majority of it can be monitored. This will help you in analyzing the various regions from which your website is getting traffic and you can apply your business intelligence to determine if there are anomalies or a potential market opportunity.
Key Takeaway: Six parameters carry most of the signal in a traffic capture: HTTP requests, HTTP response time, load time, failed requests, originating IP address, and request location.
How to Capture Network Traffic
Capturing network traffic requires specialized tools that monitor the network in which it is deployed. These tools aggregate, segregate, apply user-provided rules and visualize various aspects related to network traffic. Here are some of the most popular tools used for this purpose.
1. Wireshark
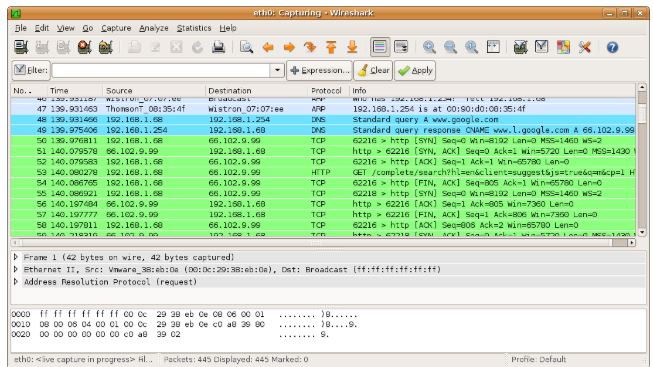
Wireshark is one of the most widely used network monitoring tools today. A free and an open source tool, Wireshark equips you with a packet analyzer that can go to microscopic levels of networking monitoring.
It has some powerful features such as a feature-rich GUI for monitoring, a pluggable interface to monitor a new type of protocol, live data connection to ports, multi-protocol scalable dissectors, and more. You can learn more about Wireshark through their official video guides.
2. Microsoft Network Monitor
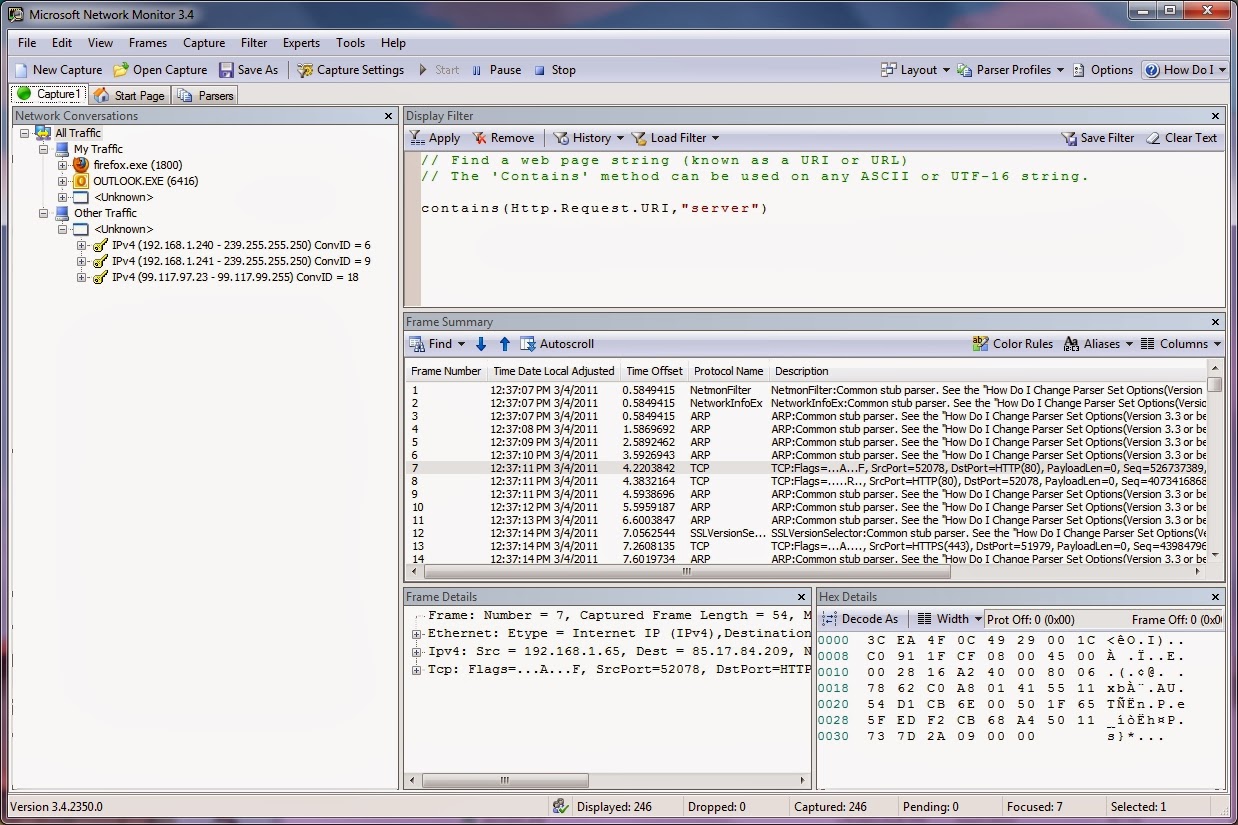
Microsoft Network Monitor is no longer the in-box capture tool on Windows. Windows ships pktmon.exe from build 19041, and Network Monitor now reads the ETL logs pktmon produces through its parsers. Apart from the broader capabilities of capturing traffic through the adapters or even the subnets, this tool can be used for much finer operations.
Performing detailed tasks such as frame filtering and frame analysis can be easily performed via this tool and it provides a summary of each frame that eases the user’s work. The Microsoft Learn documentation for pktmon covers the capture syntax, the filters, and the Network Monitor parser support.
3. Observium Community
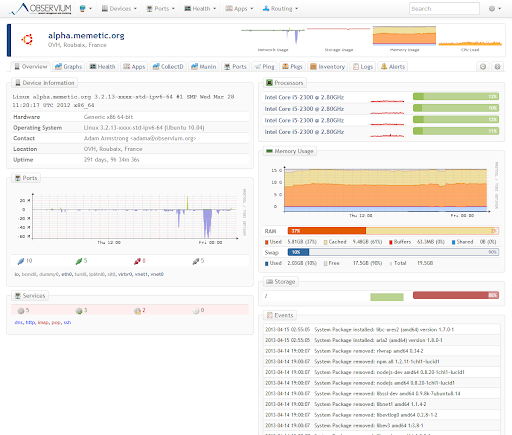
When the goal of traffic monitoring is to have an eye on the health of the network, it becomes imperative to monitor each device state and the communication that occurs within the network. For such purposes, this multi-OS network monitoring tool Observium performs extremely well.
Observium will help you to improve visibility within your network. With features such as device auto-discovery, health checks of existing devices and reporting features makes it one of the most sought-after tools for discovery and status check use cases.
Key Takeaway: Wireshark captures and dissects packets at the network interface, pktmon does the same in-box on Windows, and Observium watches device health across a whole network, so the choice depends on whether the question is about one packet or one network.
How Do AI Agents Check Network Traffic?
AI agents check network traffic by reading the request and response events a browser automation library already emits, then grouping the failures. An agent does not sniff packets. It consumes the same event stream a test script consumes.
- MCP browser servers: the Playwright MCP server exposes a network requests tool, so a language model client can list every request a page issued without anyone writing a capture script.
- WebDriver BiDi events: the network.beforeRequestSent and network.responseCompleted events stream request and response metadata to the agent as the page loads. Read more on WebDriver BiDi, the future of browser automation.
- HAR archives: an agent parses an exported HAR file and sorts the entries by status code, host, and transfer time, which turns a raw capture into a short defect list.
- Proxy capture: routing the browser through a proxy records traffic the page never surfaces, including requests made before the automation session attaches. A playwright proxy setup does this for a Playwright run.
- Payload assertions: an agent compares a response body against a schema, the same check api testing performs on an endpoint directly.
- Unverified 200 responses: an agent reports a 200 status as healthy even when the body is wrong, so explicit assertions still belong in the script rather than in the prompt.
Agents do not replace the capture layer. They read what automation testing tools already produce and shorten the time between a failed request and a named cause.
Key Takeaway: An AI agent reads browser network events or a HAR archive and groups failed requests by status code and host, but it cannot judge whether a successful response carries the correct payload.
Integration of Automation and Traffic Monitoring
Now that you have the required parameters and the resources to fetch the data and get results, traffic monitoring seems simple, right? Well, it might. However, would it be as good as an automated process? Let’s have a look!
With an automated traffic monitoring model, the automation script enables sample data to be pitched in to generate situation based results.
Moreover, the use of automation scripts and tools can reduce the expenses involved as well as manual effort. An automated script not only reduces cost but also cuts down on the scope of human error. This consists of the simulation of bandwidth and latency whenever required. Its benefit being filtration of specific URL patterns in an attempt to get maximum data for analysis. Traffic monitoring with the help of automation scripts also helps gain insights in real time.
A very common saying goes by as,” Prevention is better than cure.” Also, that is precisely what automation enables the user to do. Before shipping out the actual product, any potential problem will be reported. For any organization looking to grow with an efficient system of working and satisfied employees as well, automation is the key to an unbeaten run.
It goes without a doubt that automating the monitoring process is one more step towards delivering a more successful product.
Key Takeaway: Automated traffic monitoring simulates bandwidth and latency, filters specific URL patterns, and returns results in real time, which a manual capture cannot repeat on every build.

Author

Akshay Pai
Blogs: 11


Akshay Pai is a community contributor with 10+ years of experience in building and delivering enterprise-scale AI and data-driven systems. He specializes in agentic AI, generative AI platforms, and cloud-native architectures, with hands-on experience designing systems that are production-ready, scalable, and resilient. As a Technical Architect and Project Manager, Akshay has led cross-functional teams across global projects and brings a strong focus on system reliability, performance, and quality-driven engineering practices. He holds a Bachelor’s degree in Information Technology.


Network Traffic Monitoring FAQs
Did you find this page helpful?
More Related Blogs
TestMu AI forEnterprise
Get access to solutions built on Enterprise
grade security, privacy, & compliance
- Advanced access controls
- Advanced data retention rules
- Advanced Local Testing
- Premium Support options
- Early access to beta features
- Private Slack Channel
- Unlimited Manual Accessibility DevTools Tests