
Power Your Software Testing with AI Agents and Cloud
The Native AI-Agentic Cloud Platform to Supercharge Quality Engineering. Test Intelligently and Ship Faster.

- TestMu AI (Formerly LambdaTest)
- /
- Use Cases
- /
- Run Performance Tests at Scale
Run Performance Tests at Scale
Run load tests across machines and regions without a generator fleet. JMeter and Gatling portal walkthroughs, plus a Gatling CI config verified on a real run.
Last Updated on:
Key takeaways
Running a performance test at scale means generating load from several machines at once, which changes what your stated user count actually produces. HyperExecute provisions those machines on demand and exposes the regional split as a configuration field, so JMeter and Gatling plans run across regions with no load-generator fleet to maintain.
What Changes When Load Is Distributed
- Load replication: On any HyperExecute multi-generator setup, the thread count inside a .jmx file runs on every machine in every region. A 250-user plan on 3 machines across 2 regions generates 1,500 concurrent users, not 250, unless overrides are set.
- Load infrastructure: HyperExecute provisions virtual machines per task and destroys them when the job ends, so there is no load-generator fleet to provision or maintain.
- Regional origin: HyperExecute generates load from six documented regions. Default region: East US, in Richmond, Virginia. A test that never sets this measures latency from Virginia regardless of where the users are.
- Running tests manually: HyperExecute runs a JMeter .jmx plan or a Gatling .java simulation uploaded through its Projects dashboard, with load configured in a form. No configuration file and no CLI are required.
- Automating tests in CI: HyperExecute runs Gatling and k6 from a hyperexecute.yaml file triggered by a single binary, which is the documented path that works unattended in a CI pipeline.
- Tool support: JMeter yes, Gatling yes, k6 yes, Locust no. Locust is not documented anywhere in the HyperExecute docs and should be treated as unsupported.
Which Path Should You Start With?
- Portal upload: Pipeline trigger, no. Runs start from the HyperExecute dashboard, which makes it the right choice for a first manual baseline.
- CLI and hyperexecute.yaml: Pipeline trigger, yes, for Gatling and k6. A single binary takes a config path and returns an exit code, so a schedule or pipeline trigger can drive it nightly.
A checkout endpoint that responds instantly in staging can still collapse the Monday after release, when real concurrent traffic arrives. The functional suite never saw it coming, because every test in that suite exercised the endpoint one user at a time.
Web performance work has published, measured outcomes attached to it. In a case study published in March 2021, Vodafone ran an A/B test where version A was optimized for Web Vitals and scored 31% better on Largest Contentful Paint in the field than version B, and the published results report that the faster version generated 8% more sales, an 11% improvement in cart-to-visit rate, and a 15% improvement in lead-to-visit rate.
What Breaks When You Scale a Load Test?
Running one load test from one machine is straightforward. Running enough load to represent real traffic means generating it from several machines at once, and that is where the numbers stop meaning what you think they mean.
The trap below is not specific to any one platform. It applies to any setup that spreads load across more than one generator, and it is the single most common reason a capacity number turns out to be wrong.
The mechanism is simple. A thread count written into a .jmx file is a per-generator instruction, not a global one, so every machine you add runs the whole plan again.
- Without overrides - A plan specifying 250 users, run on 3 machines across 2 regions, generates 250 x 3 x 2 for a real total of 1,500 concurrent users against your endpoint.
- With overrides - A target of 500 users across 2 regions with a 100-user-per-machine cap resolves to 3 machines per region carrying roughly 84, 83, and 83 users each, summing to the 500 you asked for.
- Why it hurts twice - The first failure is a false capacity signal, because the system was never tested at the level you recorded. The second is a false pass, when a plan you believed was heavy got split so thin it exercised nothing.
Verify the real number before trusting any result. Compare the sample count in the results against what your plan should have produced.
Load can originate from six documented regions, and the default is East US in Richmond, Virginia. A test that never touches this setting measures latency from Virginia regardless of where your customers actually are.
- West US 2 - Moses Lake, Washington.
- East US - Richmond, Virginia, and the default when nothing is configured.
- Central India - Pune, Maharashtra.
- Southeast Asia - Singapore.
- Brazil South - Sao Paulo State, Brazil.
- Mexico Central - Queretaro State, Mexico.
The 2000-user figure quoted for JMeter is a ceiling the infrastructure can support under favorable conditions, meaning lightweight requests, sensible timeouts, and load spread across enough machines and regions. Treat it as a planning bound rather than a target.
The rest of this guide is a worked solution on HyperExecute, the TestMu AI orchestration cloud, because it provisions the generators for you and exposes the regional split as a configuration field rather than something you wire up yourself. Both documented routes are covered: uploading a JMeter plan or Gatling simulation through the portal, and driving Gatling or k6 from a config file in CI. For a product overview of both routes, see TestMu AI's cloud performance testing.
The Gatling CLI configuration was executed on HyperExecute CLI v0.2.356. If you want conceptual grounding on test types first, the performance testing guide covers load, stress, spike, and soak testing as categories.
What Do You Need Before You Start?
For the upload path, a TestMu AI account and a test file are the whole list. There is no load-generator fleet to provision, because HyperExecute allocates machines per task and releases them when the job ends.
- For JMeter - A .jmx test plan authored in the Apache JMeter GUI. Standard Thread Group is supported by default, and custom thread groups also work.
- For Gatling - Simulation files in .java format, ideally reading their load values from system properties so the portal fields can drive them.
- For the Gatling and k6 CLI path only - The HyperExecute binary and your credentials exported as environment variables.
# Linux
curl -O https://downloads.lambdatest.com/hyperexecute/linux/hyperexecute
chmod +x hyperexecute

# macOS
curl -O https://downloads.lambdatest.com/hyperexecute/darwin/hyperexecute
chmod u+x ./hyperexecute

# Windows (PowerShell)
Invoke-WebRequest -Uri "https://downloads.lambdatest.com/hyperexecute/windows/hyperexecute.exe" -OutFile "hyperexecute.exe"

# Credentials, read automatically by the CLI
export LT_USERNAME="your_username"
export LT_ACCESS_KEY="your_access_key"
Confirm the binary before writing config, because schema rules changed between YAML versions and error messages reference the version you are on.
$ ./hyperexecute --version
HyperExecute version 0.2.356
Running JMeter Load Tests
JMeter is the tool the TestMu AI documentation covers most thoroughly, and its documented route is the Projects portal upload below.
Upload a .jmx Plan and Run It
Author the plan in the Apache JMeter GUI as you normally would, then hand the file to HyperExecute and configure the load in a form.
Step 1: Create the project and upload the plan
- Open the HyperExecute Projects dashboard.
- Click New Project.
- Browse to your JMeter test files and upload them.
- Click Save.
Step 2: Configure the load
- Select the .jmx file you want to run.
- Click Run.
- Fill in the configuration fields described below.
- Click Continue, then click Run Test.
Each field changes what your results actually mean, so it is worth knowing what you are setting rather than accepting defaults.
| Field | What it controls | Practical note |
|---|---|---|
| Total Users | The number of users you intend to test for | Read the load math section before trusting this figure, because it interacts with machine count |
| Duration (min) | How long the test runs | Pair it with ramp-up rather than setting it alone |
| Ramp-up Time (min) | The amount of time it should take to reach the peak test load | A realistic ramp separates a real capacity limit from a cold-start artifact |
| Total Load Distribution | The regions load is generated from, as a percentage of users per region | Defaults to East US, so untouched tests measure latency from Virginia |
| Machine count | The number of machines used for parallel test execution | This is the multiplier in the load math trap |
| Split CSV | Splits input data from a CSV file among different threads or regions | Without it every generator replays identical test data |
| Java Version | The runtime the plan executes on | Java 11 is the default and Java 25 is available |
| Job Labels | Tags applied to the execution for identification | Makes performance runs filterable alongside functional builds |
Two JMeter user properties can be overridden from the same screen, and both are genuinely useful rather than obscure.
- jmeter.save.saveservice.subresults - Setting it false reduces the results file size, which matters a lot on plans with many embedded resources.
- httpclient.socket.https.cps - Simulates constrained bandwidth, where 0 means unlimited. This is how you model a mobile network rather than a datacentre connection.
Step 3: Read the results
Open the Jobs section, where a completed JMeter run exposes five views. The JMeter on HyperExecute documentation covers each screen in detail.
Summary opens on six tiles: virtual users, average response time, average throughput, error percentage, 90th percentile response time, and average bandwidth. Underneath, the Load and Response Time charts share a time axis, and Additional Details lists start time, end time, and every region the load came from.
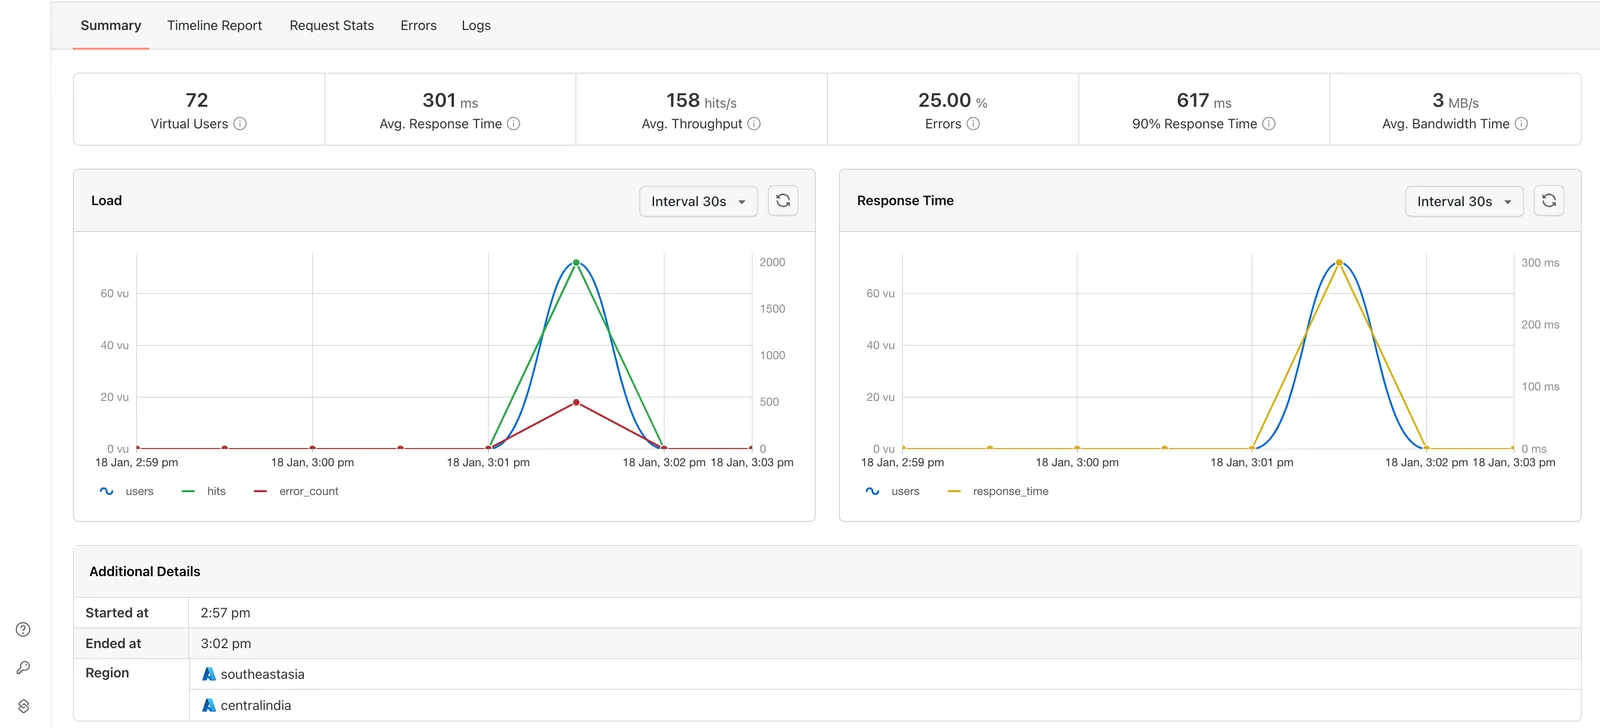
Reading the two charts together is the whole skill. When the users line keeps climbing while response time climbs with it, you have found the saturation point rather than a flat capacity wall.
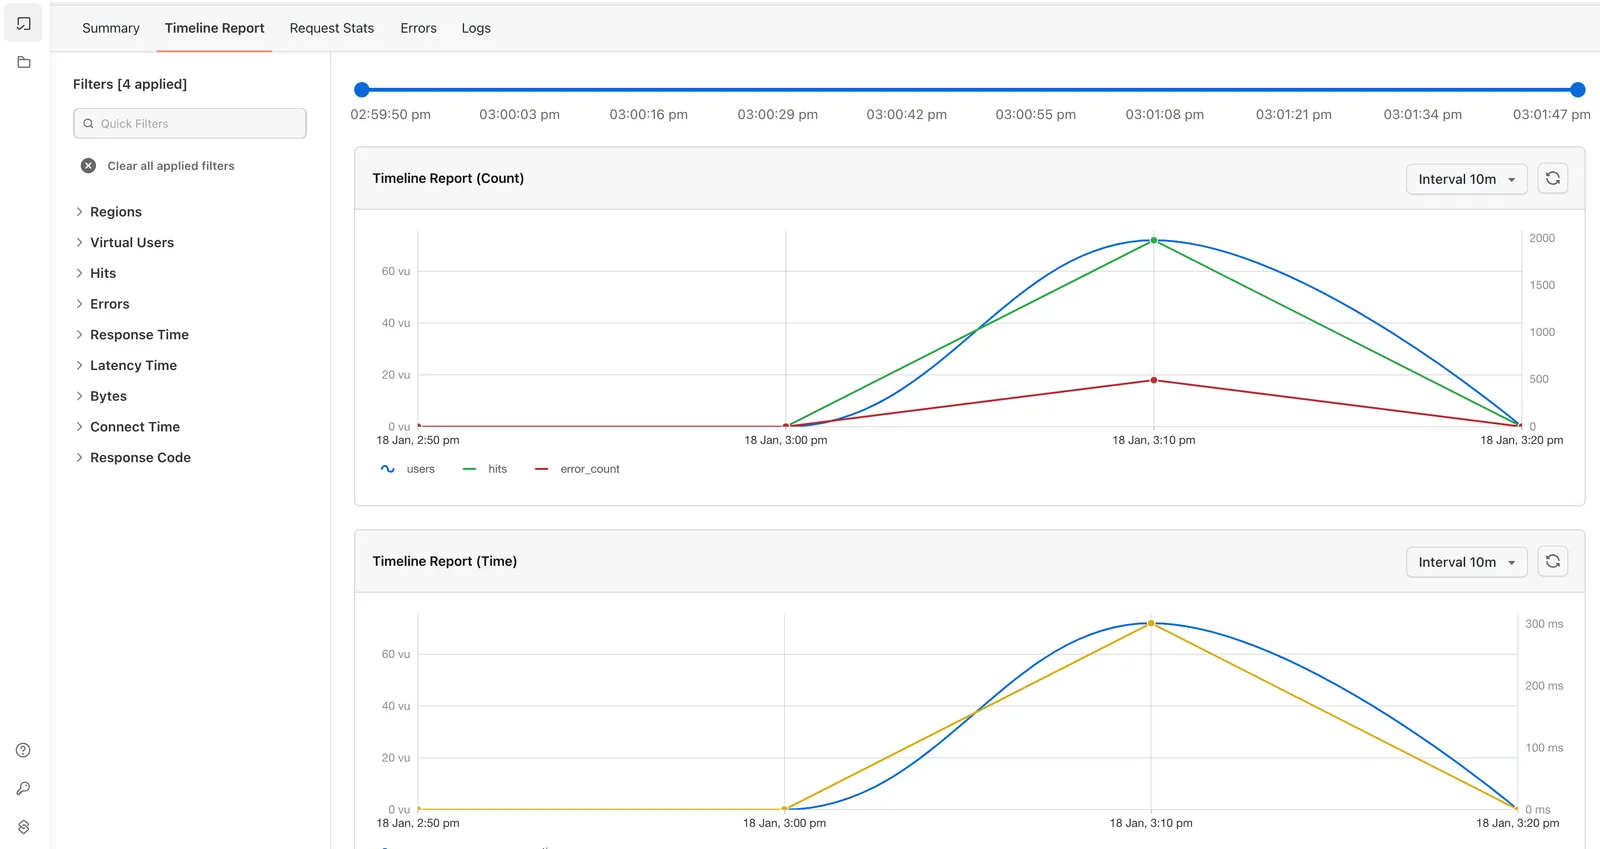
Timeline Report plots performance across the run, which is where a gradual degradation curve separates itself from a single spike.
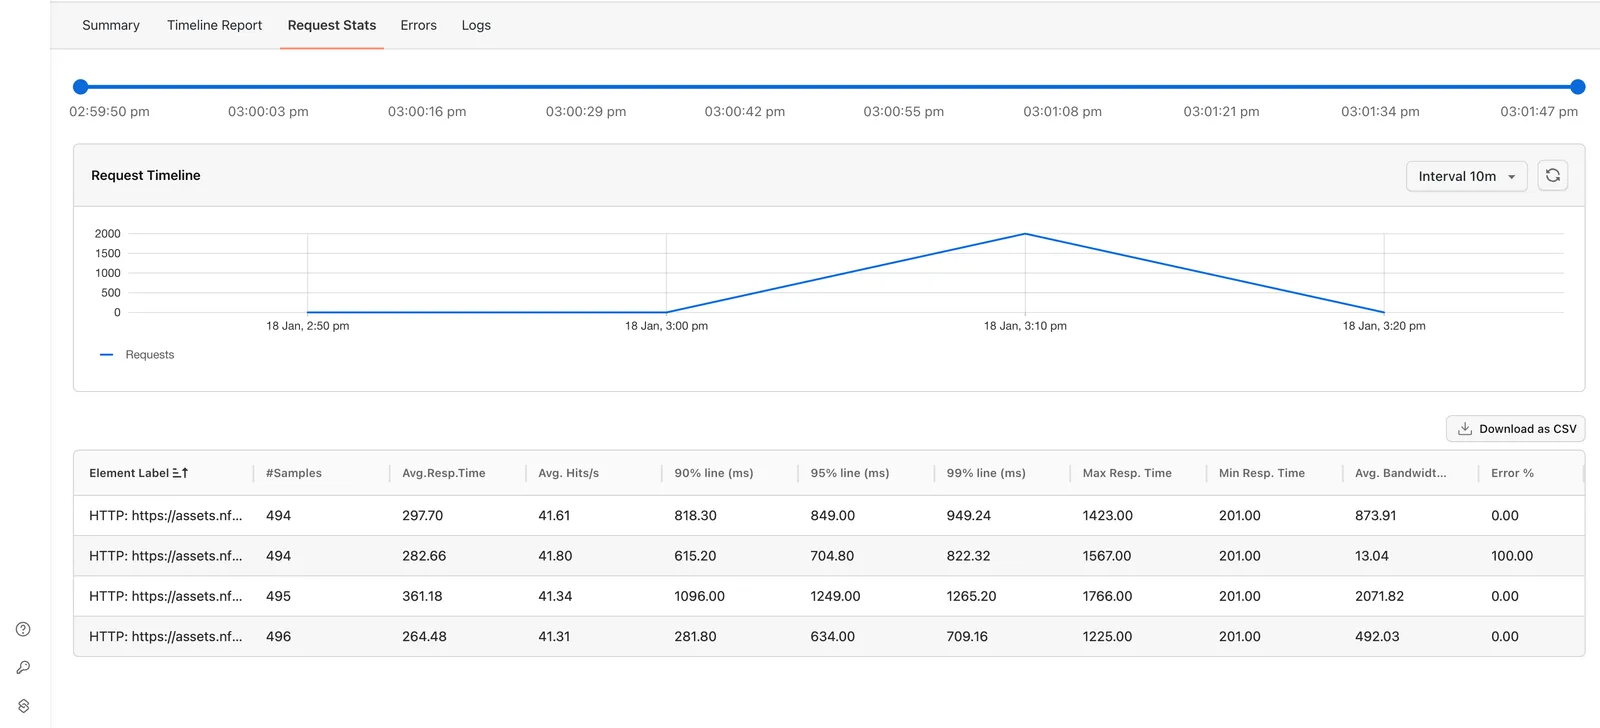
Request Stats breaks the run down per request, so a single slow endpoint stops hiding inside a healthy-looking average.
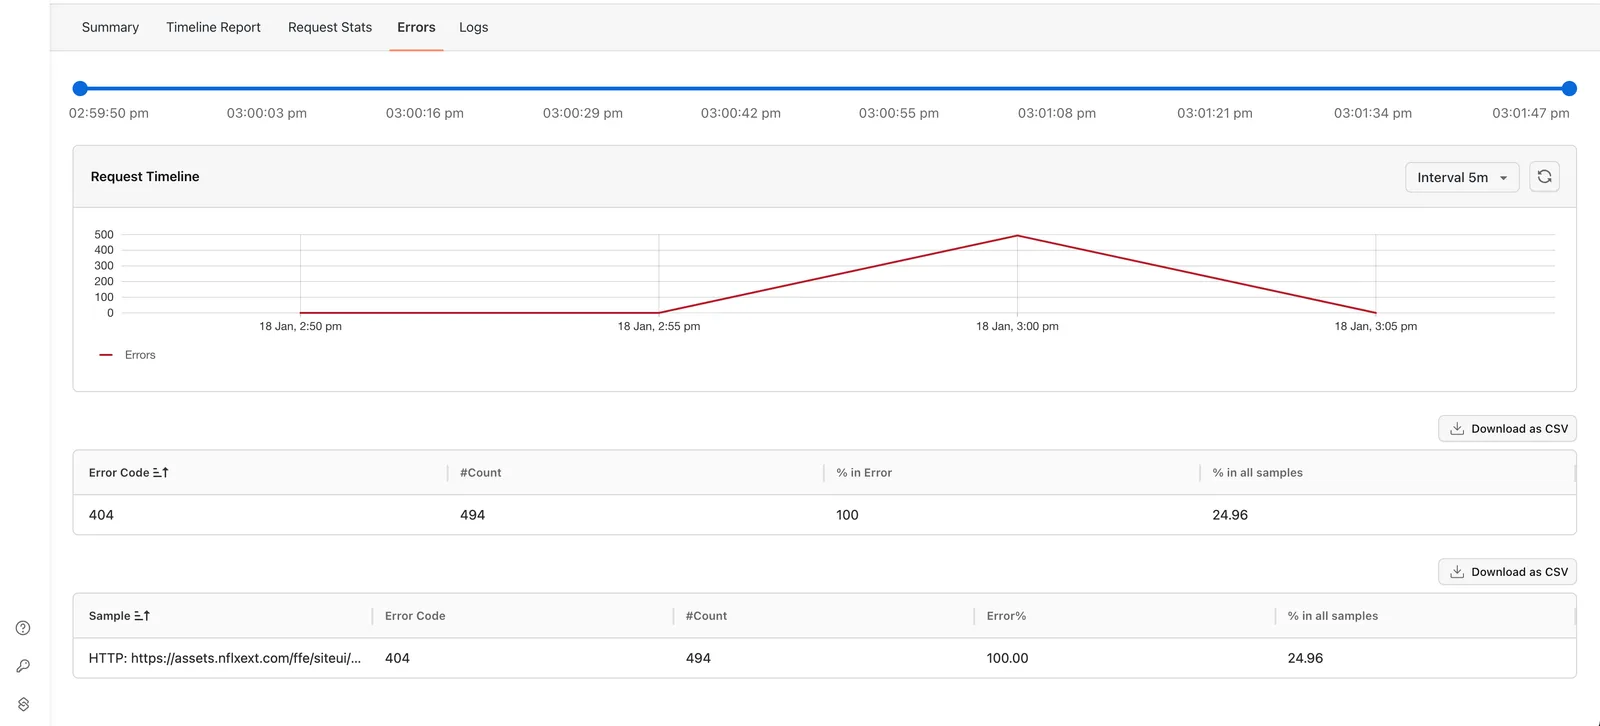
Errors lists error codes with counts and percentages. Check this before celebrating a fast run, because a high error rate makes throughput look better than it is.
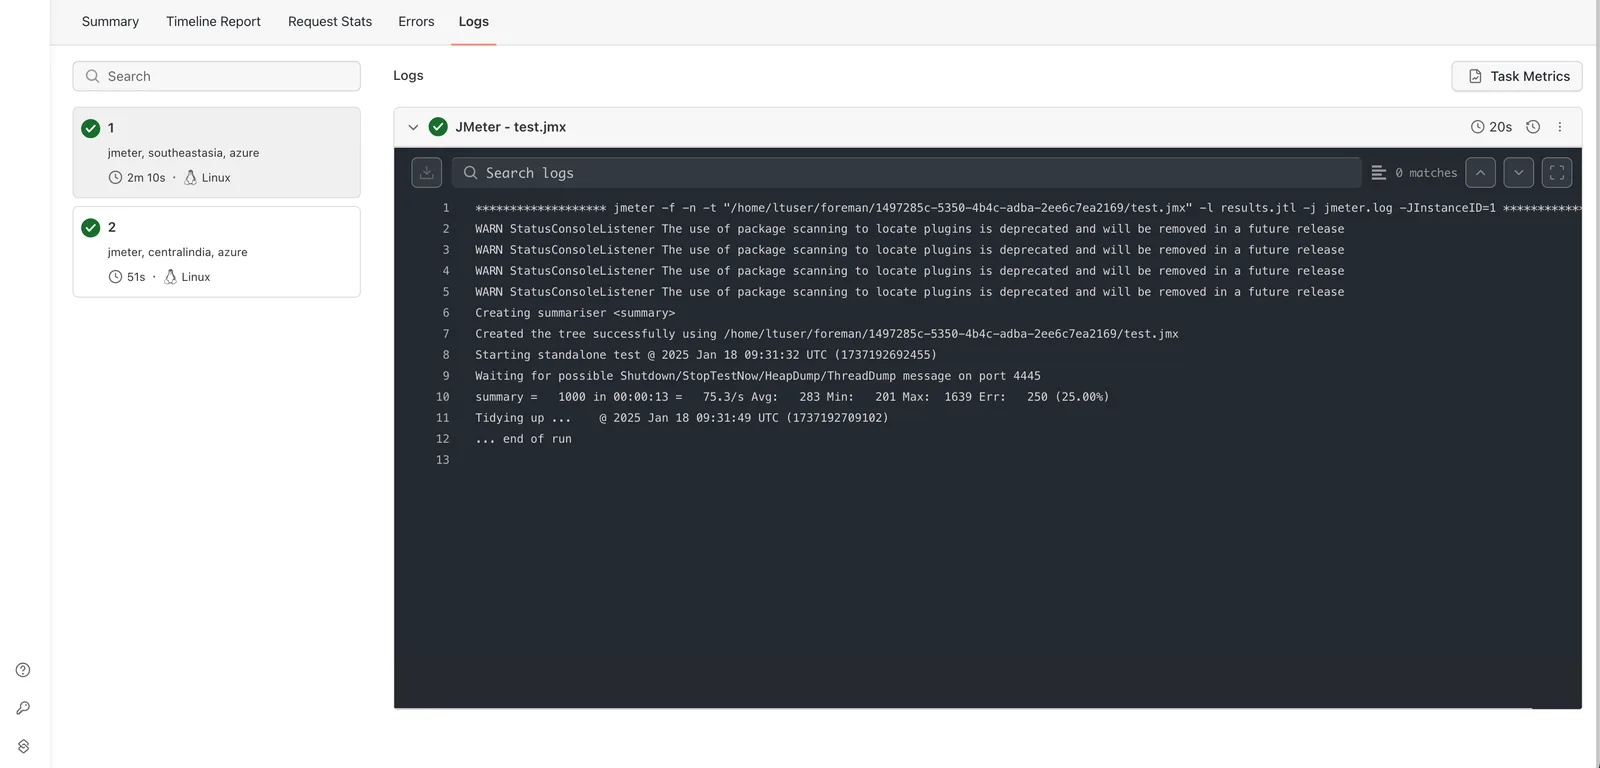
Logs holds the raw execution output, which is where you go when the other four screens agree that something failed but not why.

Note: Performance runs draw on the same test-execution minutes as your functional suite, so there is no separate load-testing contract to negotiate. Upload an existing JMeter plan or Gatling simulation and get a result in one sitting. Try it free!
Running Gatling Load Tests
Gatling has documented portal and CLI routes, and its portal flow is more opinionated than JMeter's, since it asks you to declare what kind of test you are running before it asks for numbers.
Method 1: Upload a Simulation and Run It
Step 1: Create the project and upload the simulation
- Open the HyperExecute Projects dashboard and click New Project.
- Select Gatling as the performance testing framework.
- Browse and upload your Gatling simulation files in .java format.
- Click Save.
Step 2: Choose a test type
Select the simulation, click Run, and pick one of three test types. Each takes different parameters, and picking the wrong one produces a perfectly valid run that answers a question you did not ask.
| Test type | What it answers | Parameters it takes |
|---|---|---|
| Capacity Test | How far the application scales before it degrades | Duration (min), Initial Users, Final Users, expressed as user arrival rate per second |
| Stress Test | Where it crashes and whether it recovers | Duration (min), Total Injected Users |
| Soak Test | Whether it degrades over extended production-like use | Duration (min), Constant User Arrival Rate |
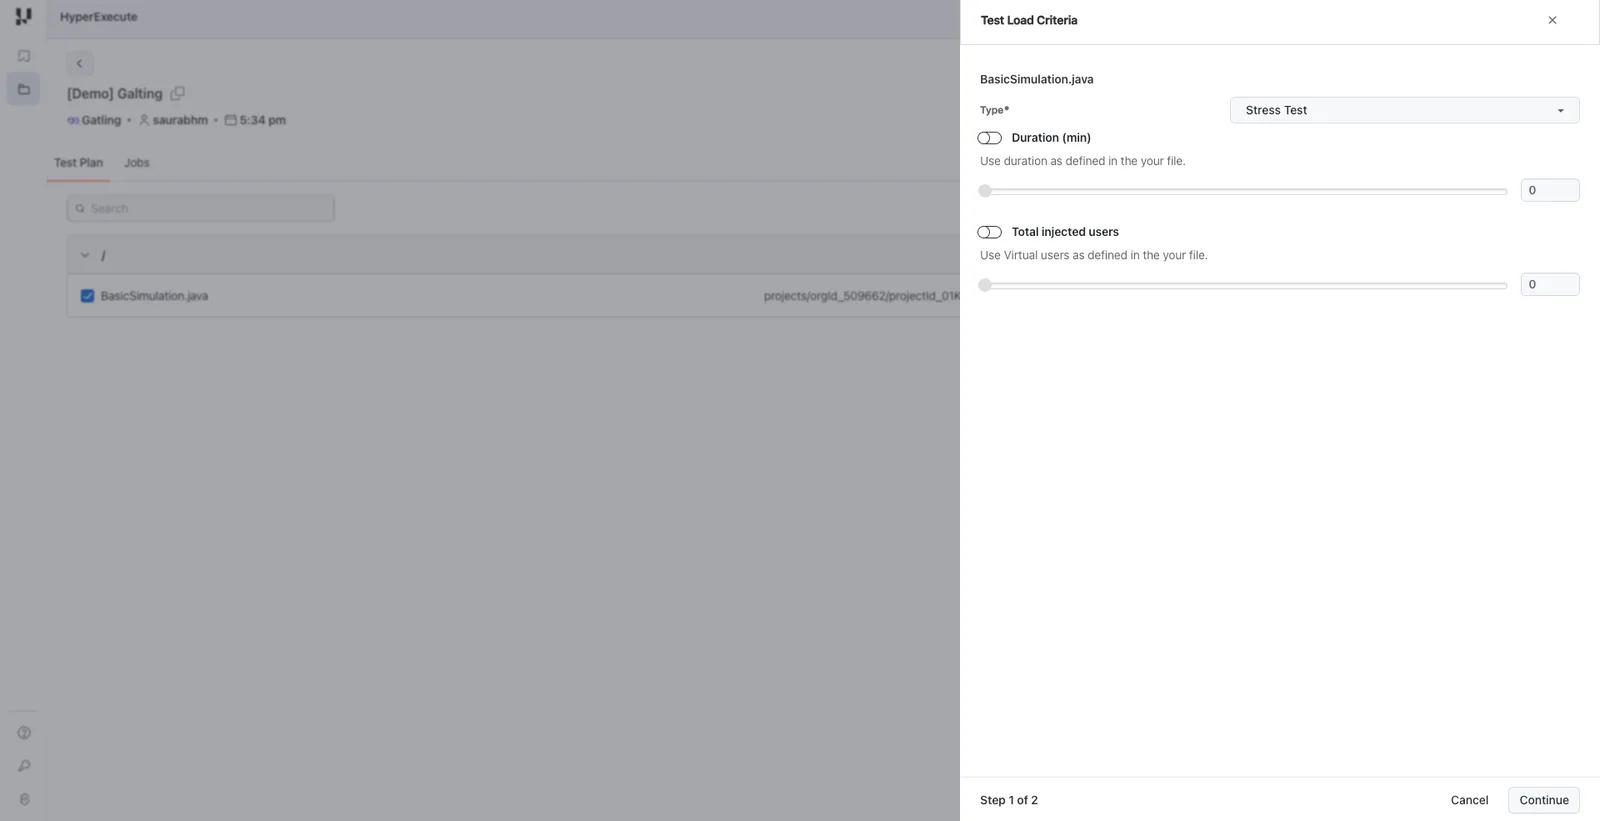
The Test Load Criteria panel opens as step 1 of 2, and each parameter has its own toggle, so a field left switched off is simply not applied. Capacity Test asks for a duration and the initial and final user arrival rates per second.
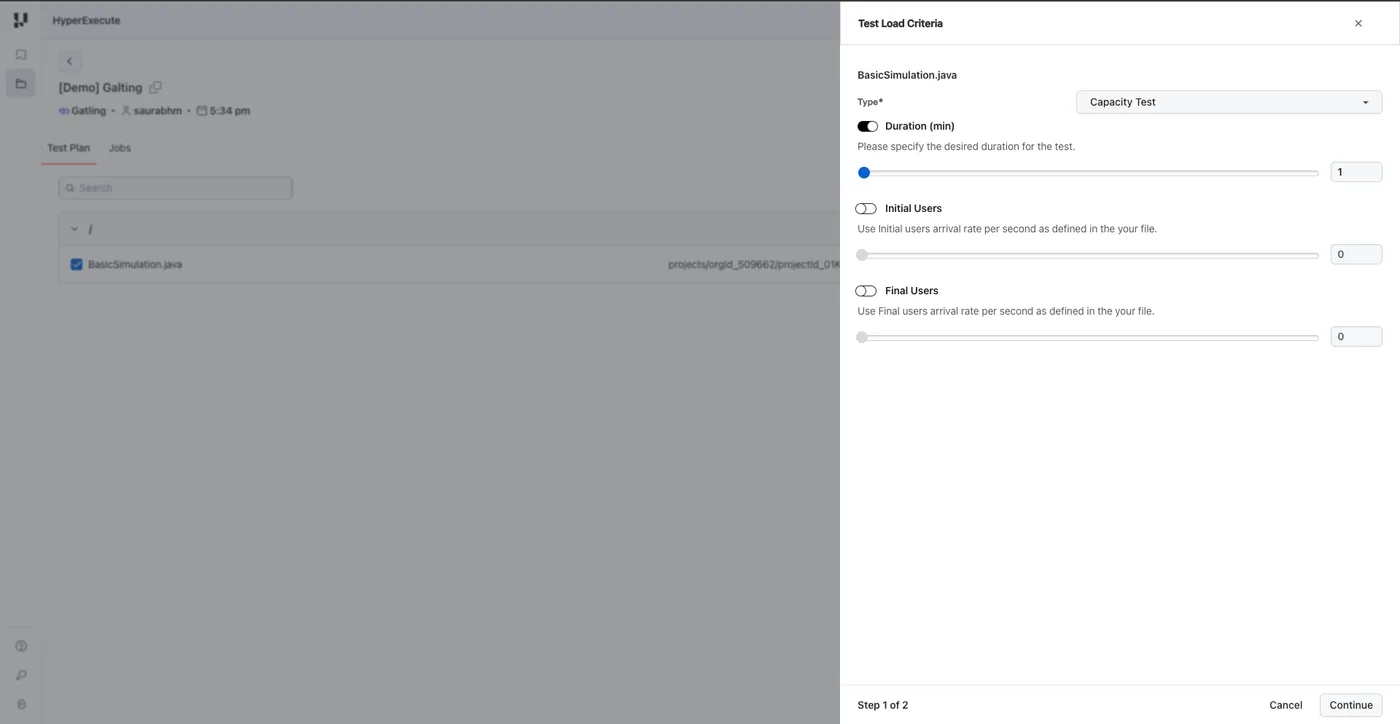
Stress Test replaces those arrival rates with a single total injected user count, which is the population pushed at the system to find its breaking point.
Soak Test holds a constant user arrival rate for the duration, which is the only one of the three that surfaces a slow memory leak.
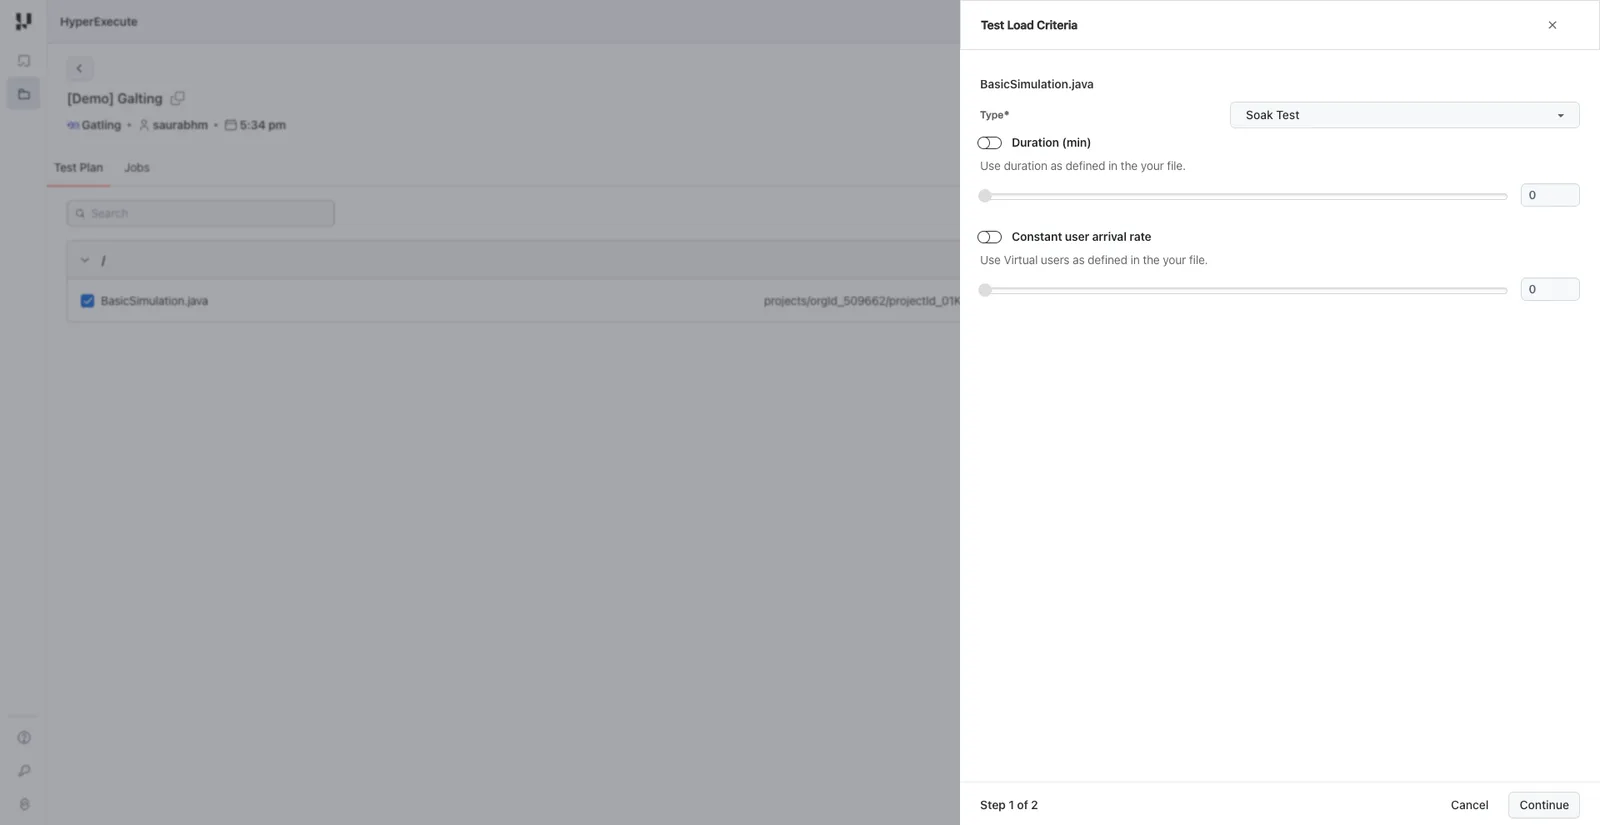
The distinction between Capacity and Stress is worth getting right. Capacity ramps between two arrival rates to find the degradation point, while Stress injects a total population to find the breaking point, and a memory leak shows up in Soak rather than in either of the other two.
Step 3: Configure load distribution and limits
- Region - The geographic origin of the load, defaulting to East US.
- % of Traffic - The share of load generated from each selected region.
- Max Users per Engine - The per-engine virtual user cap, which defaults to 2000.
- Global Timeout - The maximum job duration, which defaults to 90 minutes.
- Job Labels - Identification tags for the run.
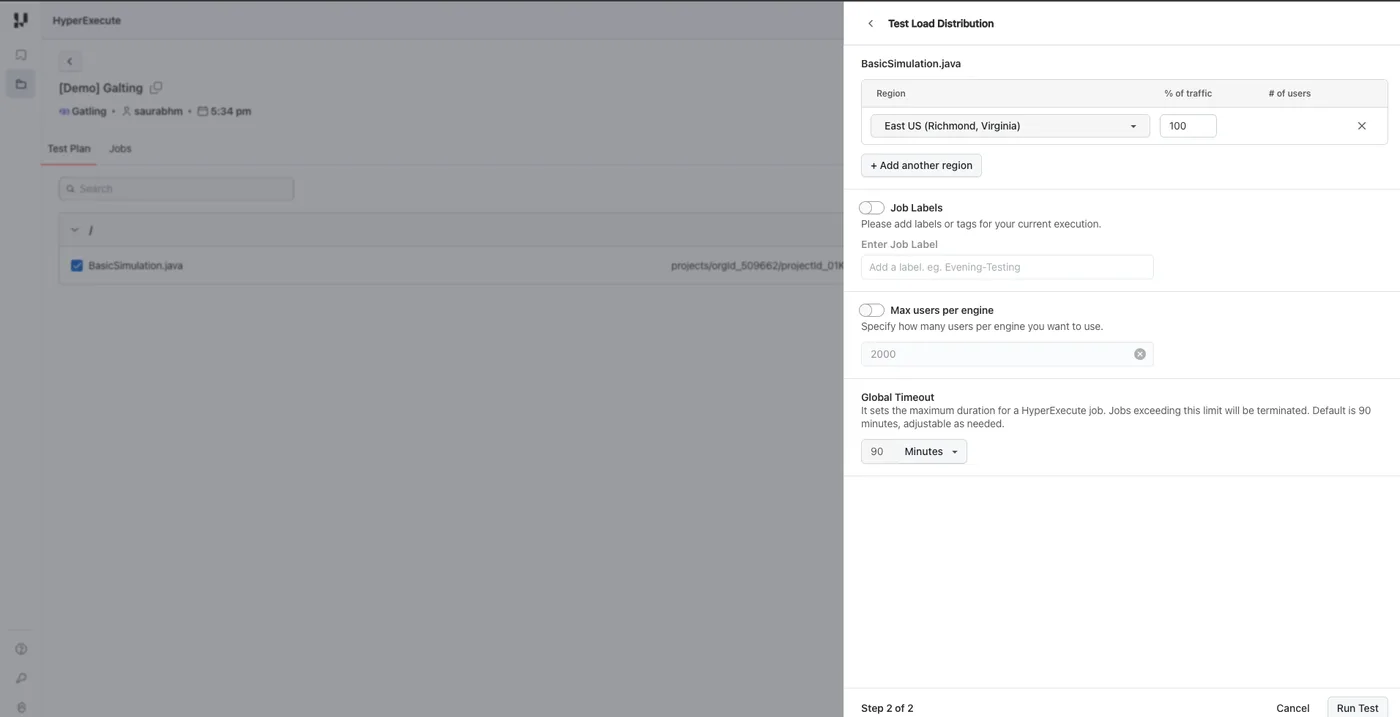
Click Run Test to start the job.
Step 4: Read the results
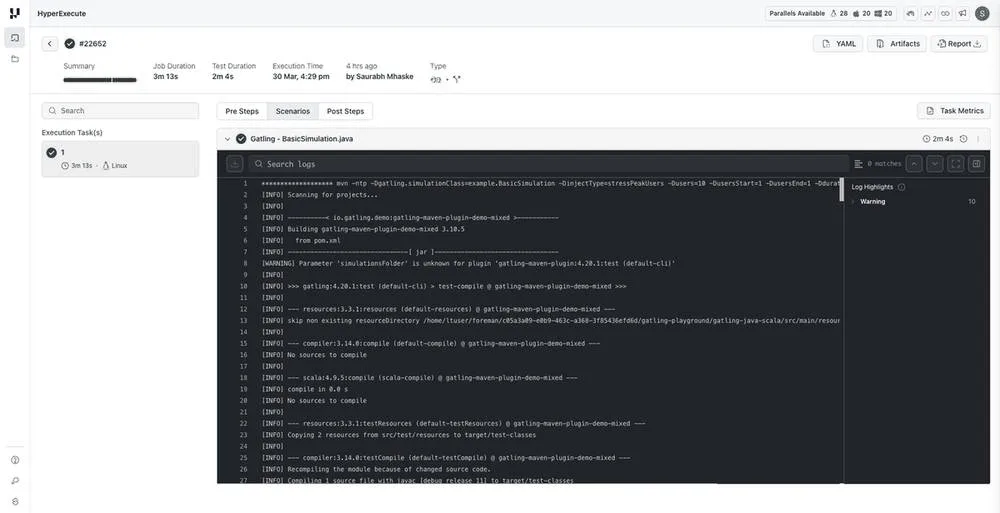
A finished Gatling run appears in the Jobs section with five tabs, and the last one is the one most teams actually want.
- Job Summary - Duration, execution time, and status.
- Scenarios - Per-scenario execution validation.
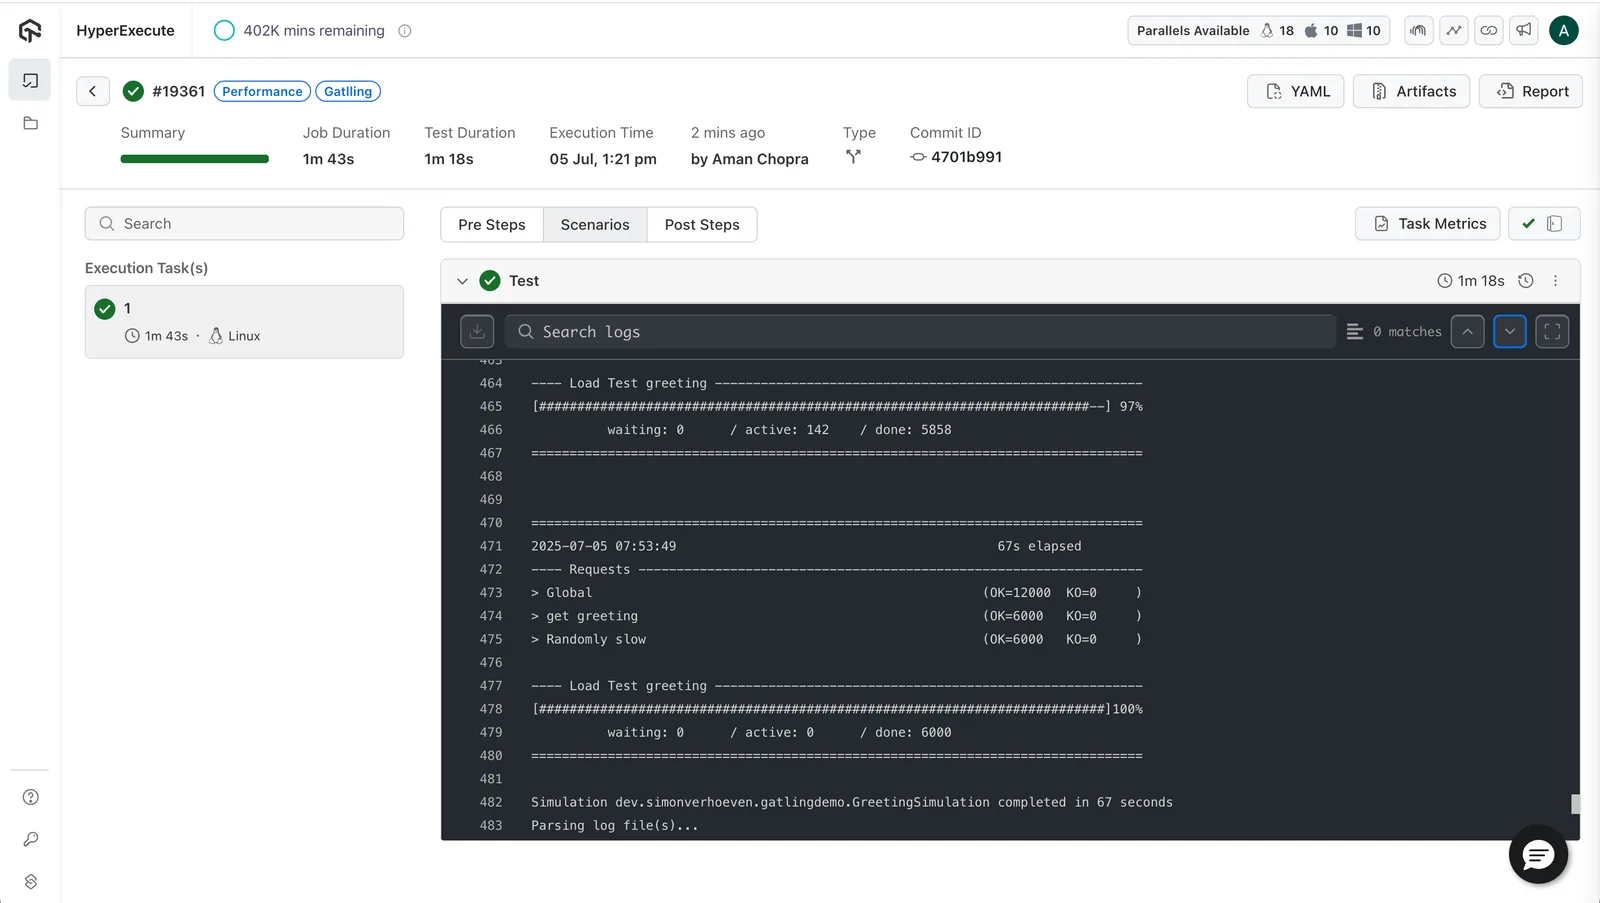
- Logs - Maven build output alongside the Gatling simulation output.
- Artifacts - The Gatling HTML reports as files.
- Report - The consolidated HTML report, downloadable in one click.
One authoring detail decides whether the portal fields do anything at all. Your simulation should read its load values from system properties rather than hardcoding them, so the values you type into the form reach the code.
LoadSimulation.java
// Read load parameters from system properties so the portal fields drive the run.
// Recognized injectType values: constantUsersPerSec (default), constantUsers,
// rampUsersPerSec, stressPeakUsers, soakTest, capacityTest.
String injectType = System.getProperty("injectType", "constantUsersPerSec");
String workloadModel = System.getProperty("workloadModel", "open");

int users = Integer.getInteger("users", 10);
int duration = Integer.getInteger("duration", 30);
int rampDuration = Integer.getInteger("rampDuration", 60);
int usersStart = Integer.getInteger("usersStart", users / 2);
int usersEnd = Integer.getInteger("usersEnd", users);
A simulation with hardcoded injection values still runs, and the portal will still accept your numbers, but the run ignores them. That failure is silent, which makes it worth checking before your first real measurement.
Method 2: Run Gatling From the CLI
Gatling runs through Maven, so the config resolves dependencies in the pre step and hands execution to the Maven plugin. The application under test can be started as a background service so the simulation has a target.
hyperexecute.yaml
---
version: 0.1
runson: linux

autosplit: true
concurrency: 1
scenarioCommandStatusOnly: true

runtime:
  - language: java
    version: "17"

background:
  - mvn spring-boot:run -Dspring-boot.run.main-class=dev.simonverhoeven.gatlingdemo.GatlingDemoApplication || true

pre:
  - mvn dependency:resolve

vars:
  INJECT_TYPE: constantUsersPerSec
  WORKLOAD_MODEL: open
  USERS: 10
  DURATION: 30
  RAMP_DURATION: 60
  USERS_START: 5
  USERS_END: 10

testDiscovery:
  type: raw
  mode: static
  command: echo "Test"

testRunnerCommand: >
  mvn gatling:test
  -Dgatling.jvmArgs="-DinjectType=${INJECT_TYPE}
  -DworkloadModel=${WORKLOAD_MODEL}
  -Dusers=${USERS}
  -Dduration=${DURATION}
  -DrampDuration=${RAMP_DURATION}
  -DusersStart=${USERS_START}
  -DusersEnd=${USERS_END}"

uploadArtefacts:
  - name: TestReport
    path:
      - target/gatling/**

retryOnFailure: true
maxRetries: 1

jobLabel: [Performance, Gatling]Verified: this is the configuration from the official Gatling sample repository. Run unchanged on HyperExecute CLI v0.2.356, it completed with 600 requests and 0 failures, and the Gatling HTML report downloaded as the TestReport artifact.
The vars block is what makes the CLI path equivalent to the portal. On the upload route the form fields become system properties for you, but from the CLI nothing sets them, so the simulation silently falls back to its defaults. Declaring them under vars and forwarding them through gatling.jvmArgs is what actually reaches the code shown earlier.
Two details in that file look wrong and are not. The discovery command is deliberately trivial because Maven already knows which simulations to run, so discovery only needs to emit one entity for Auto Split to allocate.
The || true on the background service keeps a non-zero exit from that long-running process out of the job result. The Gatling on HyperExecute documentation covers the portal fields and the sample project this config is drawn from.
Note the runtime shape. Gatling uses the list form with language and version, while k6 uses a map with an addons key, and merging the two produces a config that fails validation.
Which Method Should You Use?
Gatling teams usually end up using both, because the two routes solve different problems. The portal answers a question today and the CLI answers it every night without anyone remembering to ask.
| Consideration | Upload and run | CLI and YAML |
|---|---|---|
| Documented tools | JMeter and Gatling | Gatling and k6 |
| Setup cost | Upload a file and fill a form | Author a config file and install a binary |
| Pipeline trigger | No, runs start from the HyperExecute dashboard | Yes, on a schedule or a pipeline trigger |
| Regional load split | Built into the form as a percentage per region | Not exposed as a YAML key |
| Version control | Configuration lives in the portal, not the repository | Configuration is a file, reviewed like any other change |
| Best first move | Proving the plan works and getting a baseline | Turning that baseline into a nightly regression check |
The regional split row is the one that decides architecture. If load has to originate from several geographies, the portal is the documented way to configure that, so a CLI-only setup means giving up geographic distribution.
Let an Agent Write the Config
Authoring the YAML is the slowest part of the CLI path, because discovery and runner commands depend on how your repository is laid out. TestMu AI publishes an open-source HyperExecute skill that hands that job to an AI coding agent.
git clone https://github.com/LambdaTest/agent-skills.git .claude/skills/agent-skillsIt ships four helper scripts that are runnable on their own, with or without an agent. doctor.js checks readiness, validate-config.js lints the YAML offline, build-command.js prints the correct CLI invocation, and summarize-artifacts.js triages a downloaded artifact tree.
The readiness check is the one worth running first in a new repository or a failing CI runner, because it names what is missing rather than just failing:
doctor.js output
$ node .claude/skills/agent-skills/hyperexecute-skill/scripts/doctor.js --config hyperexecute.yaml
OK: HyperExecute CLI found at ./hyperexecute
OK: HyperExecute CLI is executable
OK: Config file found at hyperexecute.yaml
OK: LT_USERNAME is set
OK: LT_ACCESS_KEY is set
WARN: No .hyperexecuteignore found. Consider excluding secrets, local artifacts, and unrelated monorepo files.
WARN: No .gitignore found. Ensure local secrets are not committed.
HyperExecute doctor finished without blocking issues.
That last warning is worth acting on. Without a .hyperexecuteignore the CLI packages the whole working directory into the uploaded payload, which on a monorepo means slow uploads and a real risk of shipping local secrets to the grid.
The skill also refuses to trigger a paid cloud job without asking, unless you explicitly opt into an autonomous session. That matters when an agent is holding keys that spend execution minutes.

Running k6 Suites
k6 is the third documented tool and is CLI-only, with no portal upload flow. It installs as a runtime addon with a pinned version rather than through a language runtime.
hyperexecute.yaml
---
version: "0.1"
runson: linux

autosplit: true
concurrency: 2

runtime:
    addons:
      - name: k6
        version: "v0.52.0"

env:
  K6_BROWSER_ENABLED: true
  K6_BROWSER_HEADLESS: false
  HE_CONTEXT_K6_SETUP_DEFAULT_BROWSER_PATH: true

pre:
  - k6 version

testDiscovery:
  type: raw
  mode: dynamic
  command: ls tests/*.js

testRunnerCommand: k6 run $test

scenarioCommandStatusOnly: true

jobLabel: [K6, 'HyperExecute', autosplit]
The three environment variables are only needed for browser-mode runs. A protocol-level k6 script does not need them, and leaving them set on a non-browser run is harmless but misleading to the next reader.
If you have not settled on a tool yet, load testing tools compares the options, and the k6 testing tutorial covers writing the scripts themselves.
Note: HyperExecute distributes tests with Matrix, Auto Split, and Hybrid strategies across just-in-time virtual machines, and the TestMu AI product page states up to 70% faster test execution than traditional grids as an upper bound rather than a per-suite guarantee. See how the orchestration cloud handles your existing suite on HyperExecute.
Troubleshooting
Every row below is a failure hit while testing HyperExecute for this guide, or one the documentation calls out explicitly. They are listed by the symptom your terminal or dashboard actually shows.
| Symptom | Cause | Fix |
|---|---|---|
| framework name is required under framework directive | YAML version 0.2 requires a framework block that version 0.1 does not | Set version to 0.1, as the official Gatling and k6 configs do. On CLI v0.2.356 a framework block naming gatling passes --validate but is rejected when the job is dispatched, with framework gatling currently not supported |
| A stage shows no passes with zero failed tasks | The post or artifact stage never ran successfully, usually because the declared path matched no files | Add mkdir -p for the output directory in pre and declare a post step. That moved the post stage from no passes to a full pass on an otherwise identical job |
| PARTIALLY COMPLETED despite every stage passing | A generic testRunnerCommand has no framework binding, so HyperExecute cannot map scenario-level results even though the command succeeded | Add scenarioCommandStatusOnly: true so the scenario is judged by command exit status. Two otherwise identical jobs confirm it: without the key the job ended PARTIALLY COMPLETED even at 100% stage pass, with it the job ended COMPLETED. Fixing the post stage alone does not change the status |
| Concurrency N is getting overwritten by M | Requested more machines than discovery found entities | Expected behavior rather than an error. Split plans more finely if you want the extra parallelism |
| Job runs but no tests execute | Discovery returned nothing, or testRunnerCommand is missing the $test placeholder | Run the discovery command locally and confirm it prints one entity per line |
| Gatling ignores the load numbers you typed | The simulation hardcodes its injection profile instead of reading system properties | Read users, duration, injectType, and workloadModel from system properties in the simulation |
| Load plateaus well below 2000 users | Load-generator resource limits, heavy request payloads, or too few machines | Raise machine count, spread across regions, and lighten per-request payloads |
| Payload upload is slow or leaks files | No .hyperexecuteignore, so the whole working directory is packaged | Add .hyperexecuteignore excluding local artifacts and secrets, which doctor.js warns about by default |
One capacity constraint is easy to hit on an aggressive schedule. Each organization has a maximum allowable daily test duration calculated from its provisioned parallel sessions, documented as 6 hours of runtime per parallel session per day.
Long sessions carry their own warning, since the documentation notes that runs exceeding 120 minutes can cause memory and CPU spikes. That is a direct argument for splitting a soak test across machines rather than running one very long task.
Conclusion
Start in the portal. Upload one existing .jmx plan or .java simulation, set a modest user count and a realistic ramp, and run it once to get a baseline you trust before automating anything.
Then reconcile the sample count in the results against what your plan should have generated. Getting that number right is what separates a capacity measurement from a guess, and it is the step teams most often skip.
Once one run is trustworthy, move your Gatling or k6 runs into a pipeline with hyperexecute.yaml and keep every artifact for trend comparison. The getting started with HyperExecute documentation covers account setup and first-job specifics.

Author

Anmol Gupta
Blogs: 9

Anmol Gupta is Vice President of Product Management at TestMu AI, driving HyperExecute, the test orchestration cloud that runs and accelerates automated test execution. He led the development of the Unified Test Execution Cloud Platform and now leads a 30-member cross-functional product organization across product lines contributing $7M+ in revenue. He brings over nine years of experience and previously co-founded the SaaS company Timble as CTO, where he grew the team from 5 to 40 and launched an AI KYC platform that processed 600K+ applications in five months while cutting verification time from 12 minutes to under 30 seconds. Anmol holds an MTech and BTech from IIT Delhi.
Reviewer

Japneet Singh Chawla
Reviewer
Japneet Singh Chawla is an Engineering Manager at TestMu AI, where he leads a team driving HyperExecute, the AI-native Test Orchestration Cloud Platform, and integrations with Cypress, Provar, Tosca, and Selenium, improving test execution efficiency and driving adoption across 500+ enterprise clients. He also spearheaded zero-downtime deployments that cut release-related downtime by 90%, and mentors new engineers into productive contributors. He brings 9+ years of experience building and scaling distributed systems, SaaS platforms, and developer tools, with deep hands-on backend engineering across Golang, Python, Node.js, Kafka, and Redis. Earlier at Sumo Logic he built award-winning developer tools, including a VS Code Parser Linter, and at Indus Valley Partners he was a founding member of the Sentiment Analyzer team, building ML-powered solutions for financial clients. Japneet holds an MCA in Computer Science from GGSIPU.


HyperExecute Performance Testing FAQs
Did you find this page helpful?

TestMu AI forEnterprise
Get access to solutions built on Enterprise
grade security, privacy, & compliance
- Advanced access controls
- Advanced data retention rules
- Advanced Local Testing
- Premium Support options
- Early access to beta features
- Private Slack Channel
- Unlimited Manual Accessibility DevTools Tests