

Power Your Software Testing with AI Agents and Cloud
The Native AI-Agentic Cloud Platform to Supercharge Quality Engineering. Test Intelligently and Ship Faster.


- TestMu AI (Formerly LambdaTest)
- /
- Blog
- /
- How To Generate HTML Reports With WebdriverIO
How To Generate HTML Reports With WebdriverIO?
In this WebdriverIO tutorial, you will learn about different WebdriverIO HTML reporters that can be generated using the WebdriverIO framework.
Last Updated on:
Reporting is an inevitable factor in any test automation framework. A well-designed and developed framework should not just let you write the test cases and execute them, but it should also let you generate the report automatically. Such frameworks allow us to run the entire test scripts and get reports for the complete project implementation rather than for the parts separately. Moreover, it contributes to the factors that determine the decision to choose a framework for Selenium automation testing.
Without a good report, even if the scripts are great, it is very difficult to find the bugs through automation. A nice and comprehensive report at the end of an automated test execution will help to summarize and conclude the test run.
In this Selenium WebdriverIO tutorial, we will discuss different WebdriverIO HTML reporters.
Starting your journey with Selenium WebDriver? Check out this step-by-step guide to perform Automation testing using Selenium WebDriver Tutorial.
TL;DR
- WebdriverIO HTML reporters turn test results into browser-viewable reports of passed, failed, and skipped tests.
- wdio-timeline-reporter creates a WebdriverIO HTML report with embedded screenshots and needs no post-processing.
- wdio-html-nice-reporter needs a ReportAggregator in wdio.conf.js to combine several test suites into one report.
- The WebdriverIO Allure Reporter needs Java and allure-commandline to convert raw results into an HTML report.
- wdio-timeline-reporter was last published to npm in July 2020, so check its compatibility with WebdriverIO v9.
What is Reporting in WebdriverIO?
WebdriverIO is an independent implementation of Webdriver protocol and is supported by all browsers. It provides a true cross browser testing experience.
In addition to that, WebdriverIO also supports an alternate automating solution based on the Chrome Dev Tools protocol. WebdriverIO v9 also supports WebDriver BiDi for event-driven automation.
WebdriverIO supports a variety of reporting methods. They can be classified into Webdriver IO HTML reporters and non-HTML reporters. Let us have a quick look at the classification and then deep dive into HTML reporting methods.

WebdriverIO Non-HTML Reporters
Any reporting method other than Webdriver HTML reporter would fall into this category. WDIO supports a number of non-HTML reporting of which we will discuss a few of them as mentioned below:
- Dot Reporter
- Spec Reporter
- JUnit Reporter
- Video Reporter
- JSON Reporter
- Markdown Reporter

Dot Reporter
Dot Reporter is the default reporting format of the WebdriverIO framework. It is a method in which test execution results are displayed in the console. ‘Dot’ in this reporting format indicates the number of test cases.
For example, if only one test case is executed, the reporter will show one dot. And if there are three tests, three dots will be displayed in the log. Suppose if one test failed out of the three tests, the reporter will show something like “..F”. This means that out of the three tests, one test is failed and marked as F in red color as shown in the below demonstration.

Spec Reporter
Spec Reporter is similar to the Dot Reporter but slightly better in terms of reporting the test results as it represents the results in readable statements.

JUnit Reporter
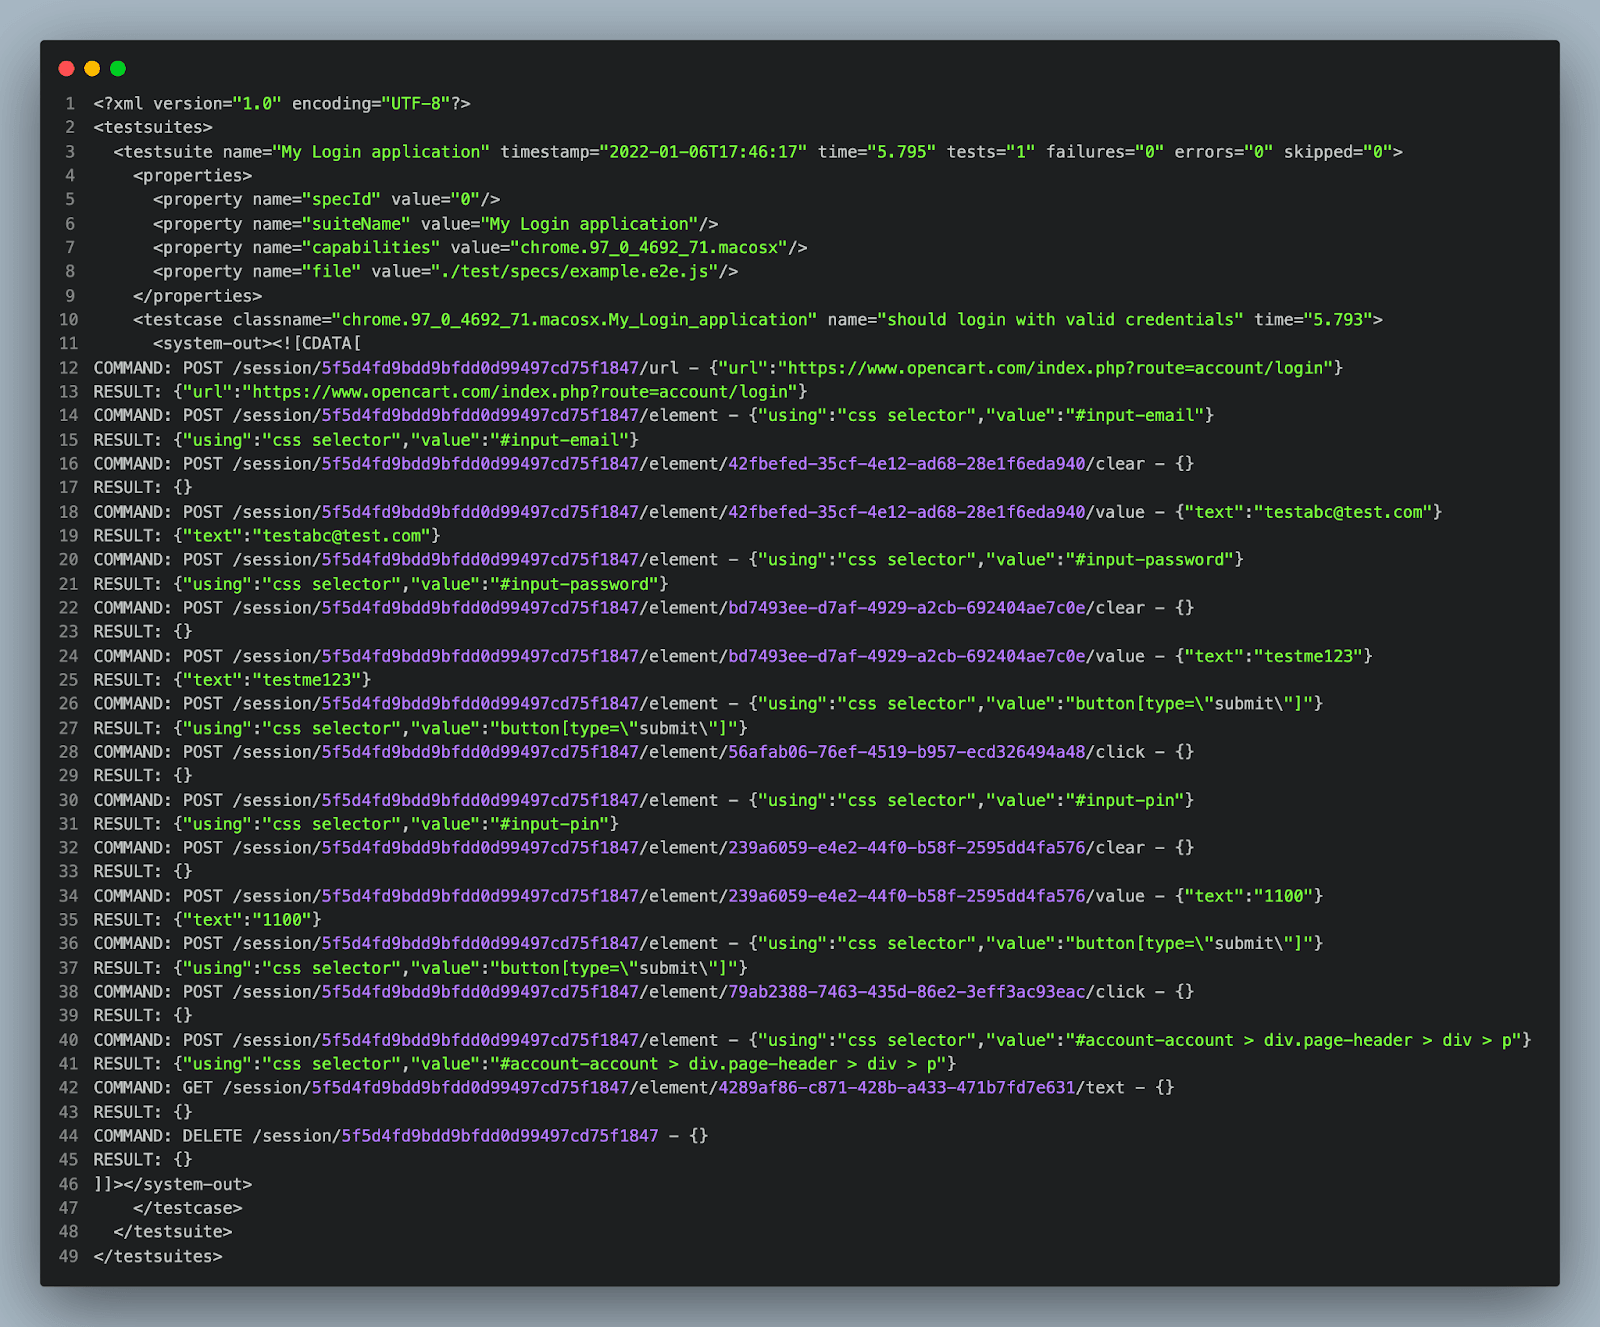
JUnit Reporter generates Jenkins compatible XML reports. Anyone who has worked on the JUnit framework will be familiar with the JUnit reports. JUnit Reporter is a plugin that can be used to generate such an XML report. This is much better than Dot Reporter as it’s more readable and gives in-depth details about the test execution.
The configuration is shown below:
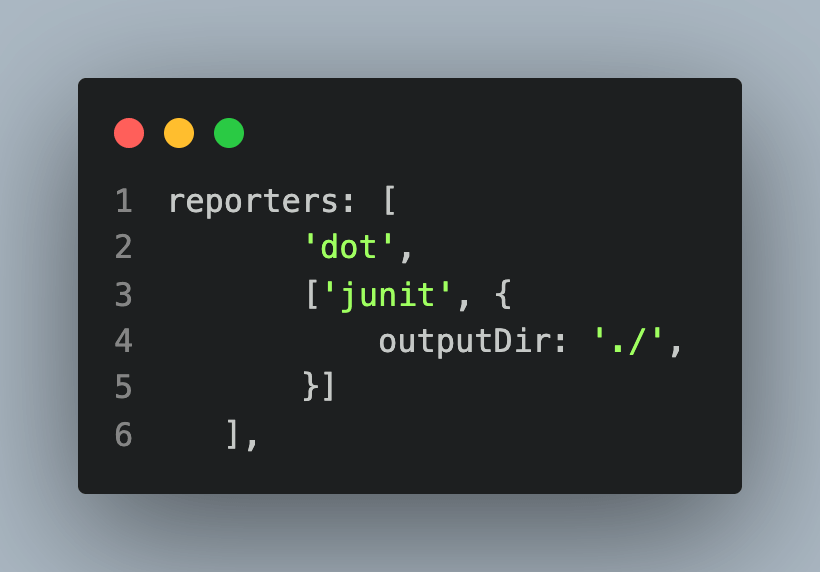
This would generate a log with JUnit XML after the test is executed, as shown below:
Also read - How To Generate TestNG Reports In Jenkins?
JSON Reporter
JSON Reporter is a reporting method to generate JSON reports. We know JSON reports are a very detailed reporting method that consists of every detail of the test execution.
Although it’s a very detailed reporting method, too much information could also impact the readability of the report and hence the usability as well (unless the report JSON file is integrated into one of the CI (Continuous Integration) tools or plugins)
Configuration is shown below:
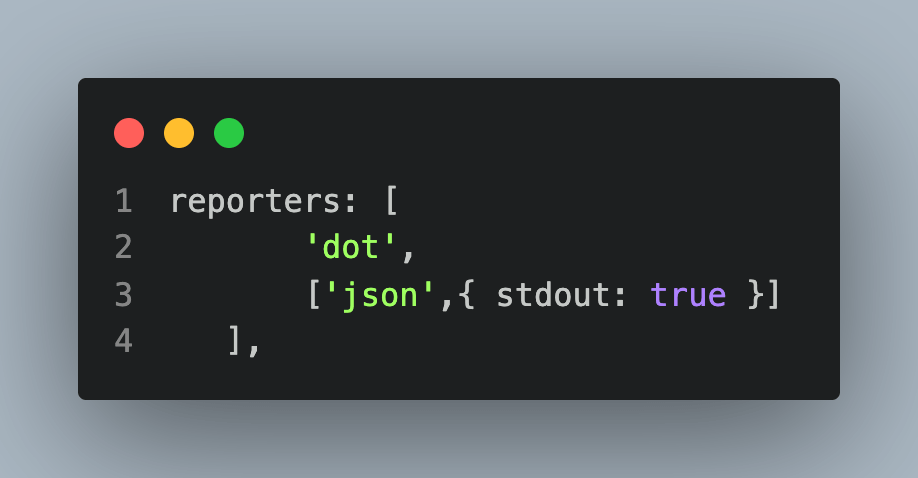
And the JSON log is shown below:

Markdown Reporter
If you are looking for a very textual reporting but with a little formatting/beautification (like a Readme file), then that would be the Markdown Reporter.
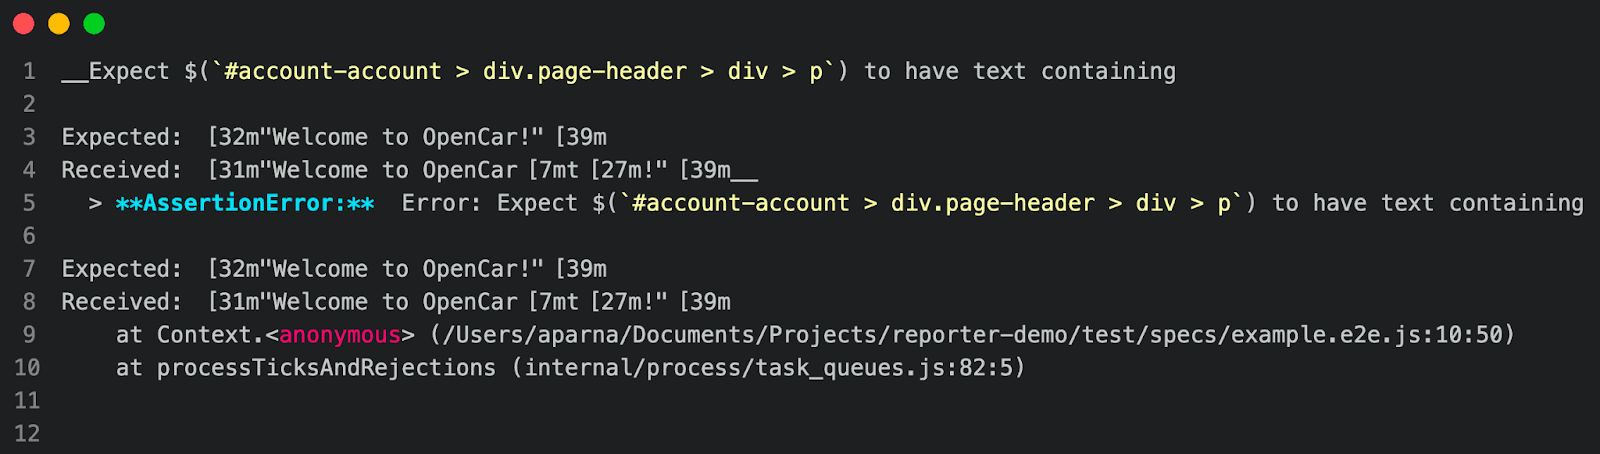
So far, we have discussed some of the non-HTML reporting methods that WDIO supports and saw that all the above reporting methods contain details of test execution.
These methods are probably helpful in debugging a small suite of tests, especially with Dot and Spec Reporter. However, something remains missing: a consolidated readable, simple representation of the test execution. So, this observation itself tells us the need for HTML Reporting methods. So, let us find out the different HTML reporting methods in WebdriverIO.
Also read - Generating XML And HTML Report In PyUnit For Test Automation

Austin Siewert
Co-Founder, Steadfast Systems
Discovered @TestMu AI yesterday. Best browser testing tool I've found for my use case. Great pricing model for the limited testing I do 👏
2M+ Devs and QAs rely on TestMu AI
Deliver immersive digital experiences with Next-Generation Mobile Apps and Cross Browser Testing Cloud

You can take this certification as proof of expertise in the field of Selenium automation testing with JavaScript to empower yourself and boost your career.
Here’s a short glimpse of the Selenium JavaScript 101 certification from TestMu AI:

WebdriverIO HTML Reporters
There are different types of WebdriverIO HTML reporters that support various integrations (Mocha, Jasmine, Cucumber, etc.). The most used ones are:
- Timeline Reporter
- HTML Reporter
- Allure Reporter
Before we deep-dive into WebdriverIO HTML reporters, please note the below prerequisites and considerations for the demonstration and hands-on examples.
Version note - These examples were written for WebdriverIO v7. WebdriverIO is now on v9. wdio-timeline-reporter was last published to npm in July 2020, so confirm it works with your version, while wdio-html-nice-reporter and @wdio/allure-reporter have newer releases.
Pre-requisites:
- Visual Studio Code IDE is installed.
- WebdriverIO is already installed and ready to use. To get started with WebdriverIO, please go through this Selenium WebdriverIO tutorial.
- In this example, we use the mocha-WebdriverIO test to demonstrate the reporting.
- Below is the snapshot of the test that we use in the demo (test to login to OpenCart application)

The test can be executed either on your local or on cloud Selenium Grid, like TestMu AI, the cross-browser/OS cloud testing platform using the command: npm run wdio
Selenium testing tools like TestMu AI is a cross browser testing platform that can be used to perform automated and manual (live) interactive testing on 3,000+ browser and operating system combinations online.
The example uses TestMu AI to execute the test. To get the test running on TestMu AI, update the wdio.config as follows:
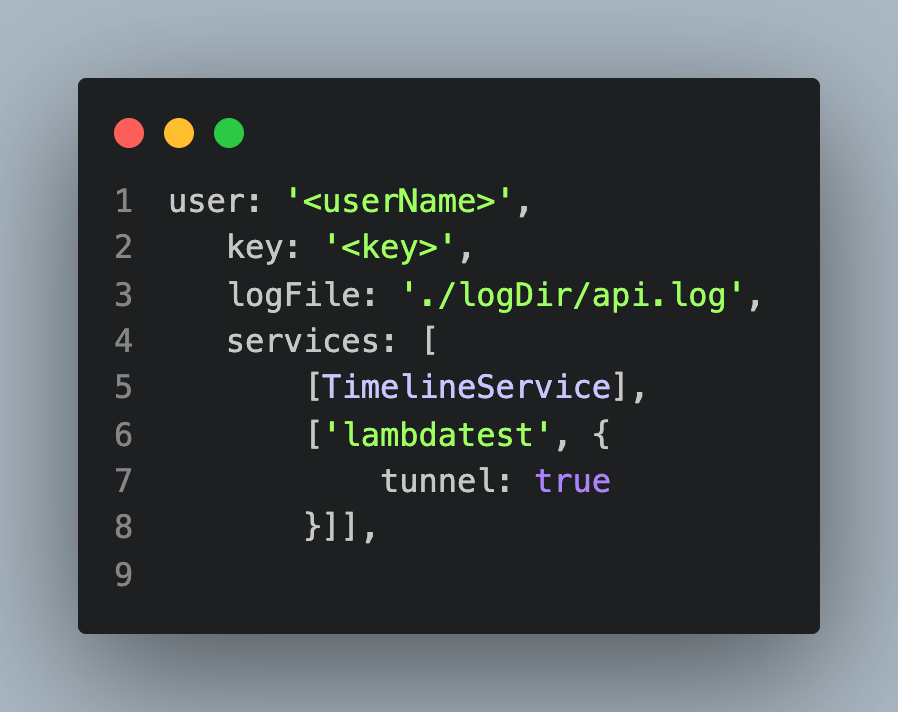
Here userName and key are the unique ones associated with your account. Please update the code accordingly after cloning the project. You can register on TestMu AI and get the Username and Access Key from the TestMu AI Profile Section.
Now let us look into the WebdriverIO HTML reporters in detail.
Also read - Cross Browser Testing With WebDriverIO [Tutorial]
Timeline Reporter
Timeline reporter is one of the most popular WebdriverIO HTML reporters that gives an aggregated visualization for your test results. It’s a very simple but very useful report framework. This report shows the test execution details nicely with a clear differentiation of passed, failed, and skipped tests. One can also attach screenshots in the html report using this reporting method.
Some of the high-level features, installation and usage (implementation) of Timeline Reporter is described below:
Timeline Reporter Features:
Here are some of the features of Timeline Reporter while working with WebdriverIO:
- Works great with Mocha and Jasmine frameworks. Though it works with Cucumber, every step of the Cucumber test will be reported as a test.
- Detailed reporting of the test with screenshots.
- Error stack trace attached to test.
- No post-processing is needed. Once the test run is complete, an HTML report will be generated.
- Test results filtering capability in the report (Ideal for debugging failure scenarios)

This Selenium JavaScript tutorial for beginners and professionals will help you generate Mocha reports with Mochawesome while working with JavaScript for Selenium automation testing.
However, you can visit the TestMu AI YouTube channel for more videos on Cypress Testing, Selenium testing, etc., so there’s never a shortage of learning opportunities.
Timeline Reporter Installation:
In this example, we use the Mocha-WebdriverIO test to demonstrate the reporting, assuming that WebdriverIO is already installed and ready to use. Below is a simple test written to log in to OpenCart.
- First, we need to install wdio- timeline-reporter using the following command:
npm install --save wdio-timeline-reporter - Once it is done, a dependency will be added to your package.json.
"dependencies": {
    	"wdio-timeline-reporter": "^5.1.4"
}
Timeline Reporter Usage:
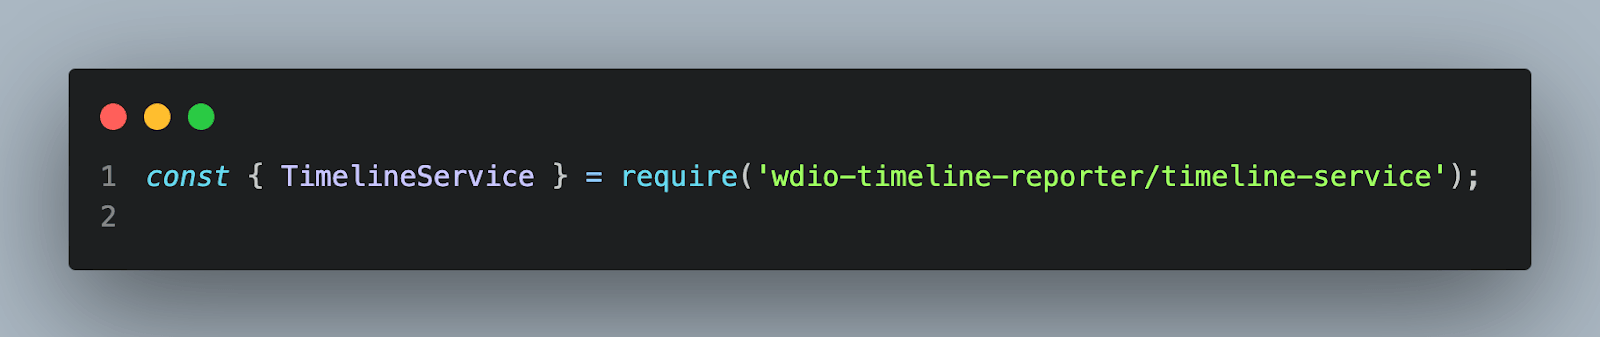
- First, we need to import the wdio-timeline-reporter to the wdio.conf.js file:
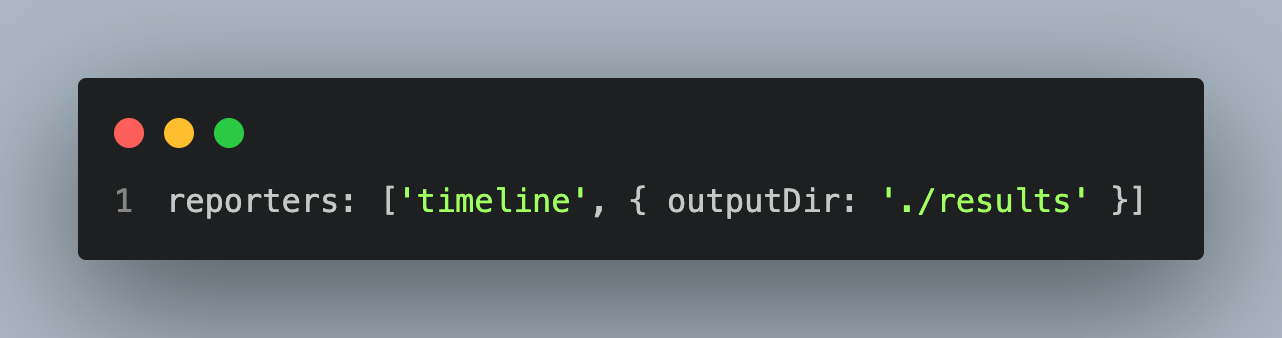
- Then in the same file, add ‘timeline’ to the reporters, and in options, set the directory name where we wish to see the HTML report. In this example, we will store them in the results folder.
- You can keep or remove spec; it has no dependency with the timeline report, but just to see the logs in the console.
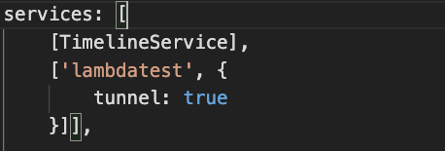
- Also, in services, add [TimelineService]. Since we are running the tests in TestMu AI, we should add “lambdatest” in the services too.
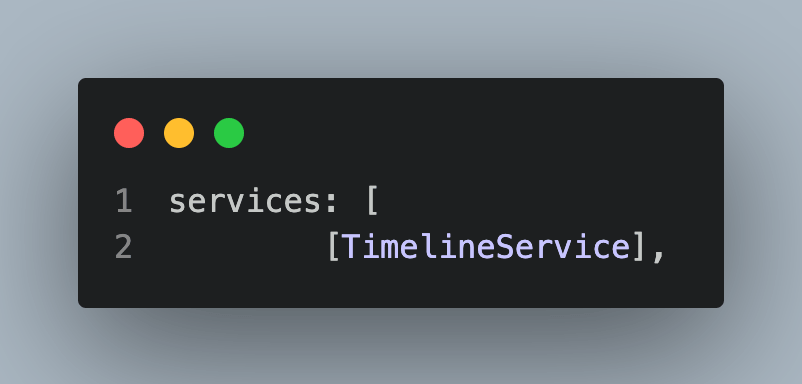 Please note that we have already added “lambdatest” services in “services” as part of the pre-requisites so that the tests will run on TestMu AI.
 - In case, if you want to execute in your local machine, remove the “lambdatest” service from the “services” array.
- Now, let’s run our test to see the timeline report. I have used the native script to run WDIO in this example. (i.e. npm run wdio).
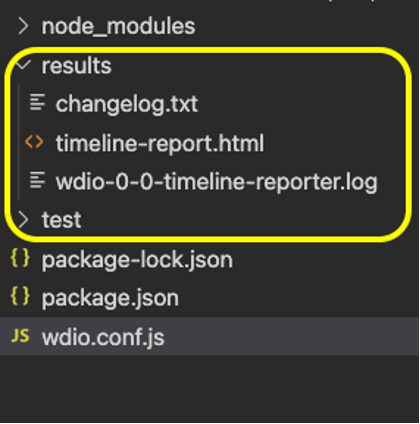
- Once the test is run, we will be able to see the ‘results’ folder (that is what we have given the path to keep reports) created, and a report with the name “timeline-report.html” is generated, as shown below.
And the report would look like this:
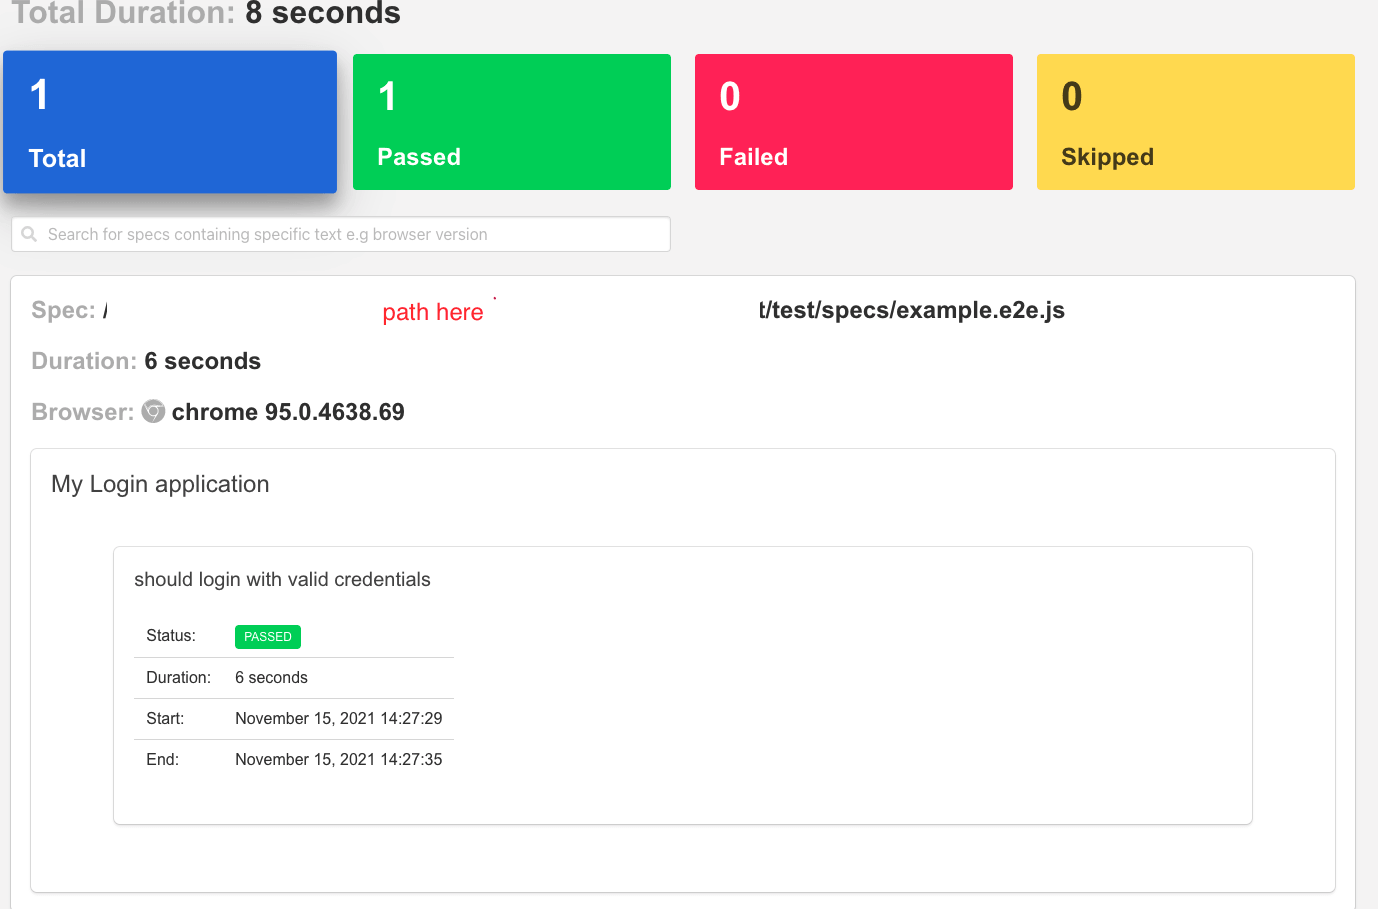
As there is no screenshot attached by default, we need to do a small config change to see the screenshots.
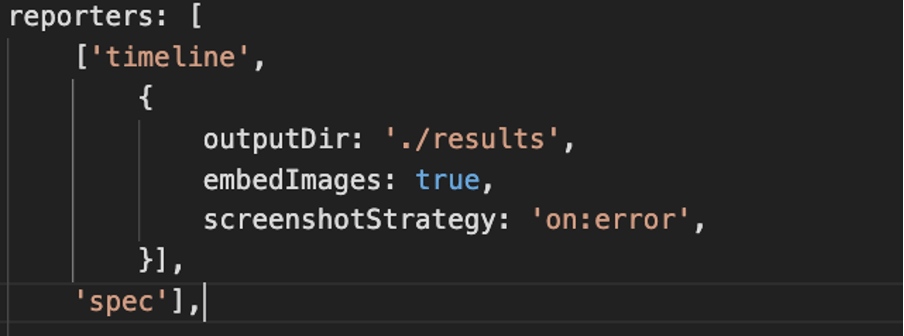
Now, if we run the test, we can see the report as shown below:
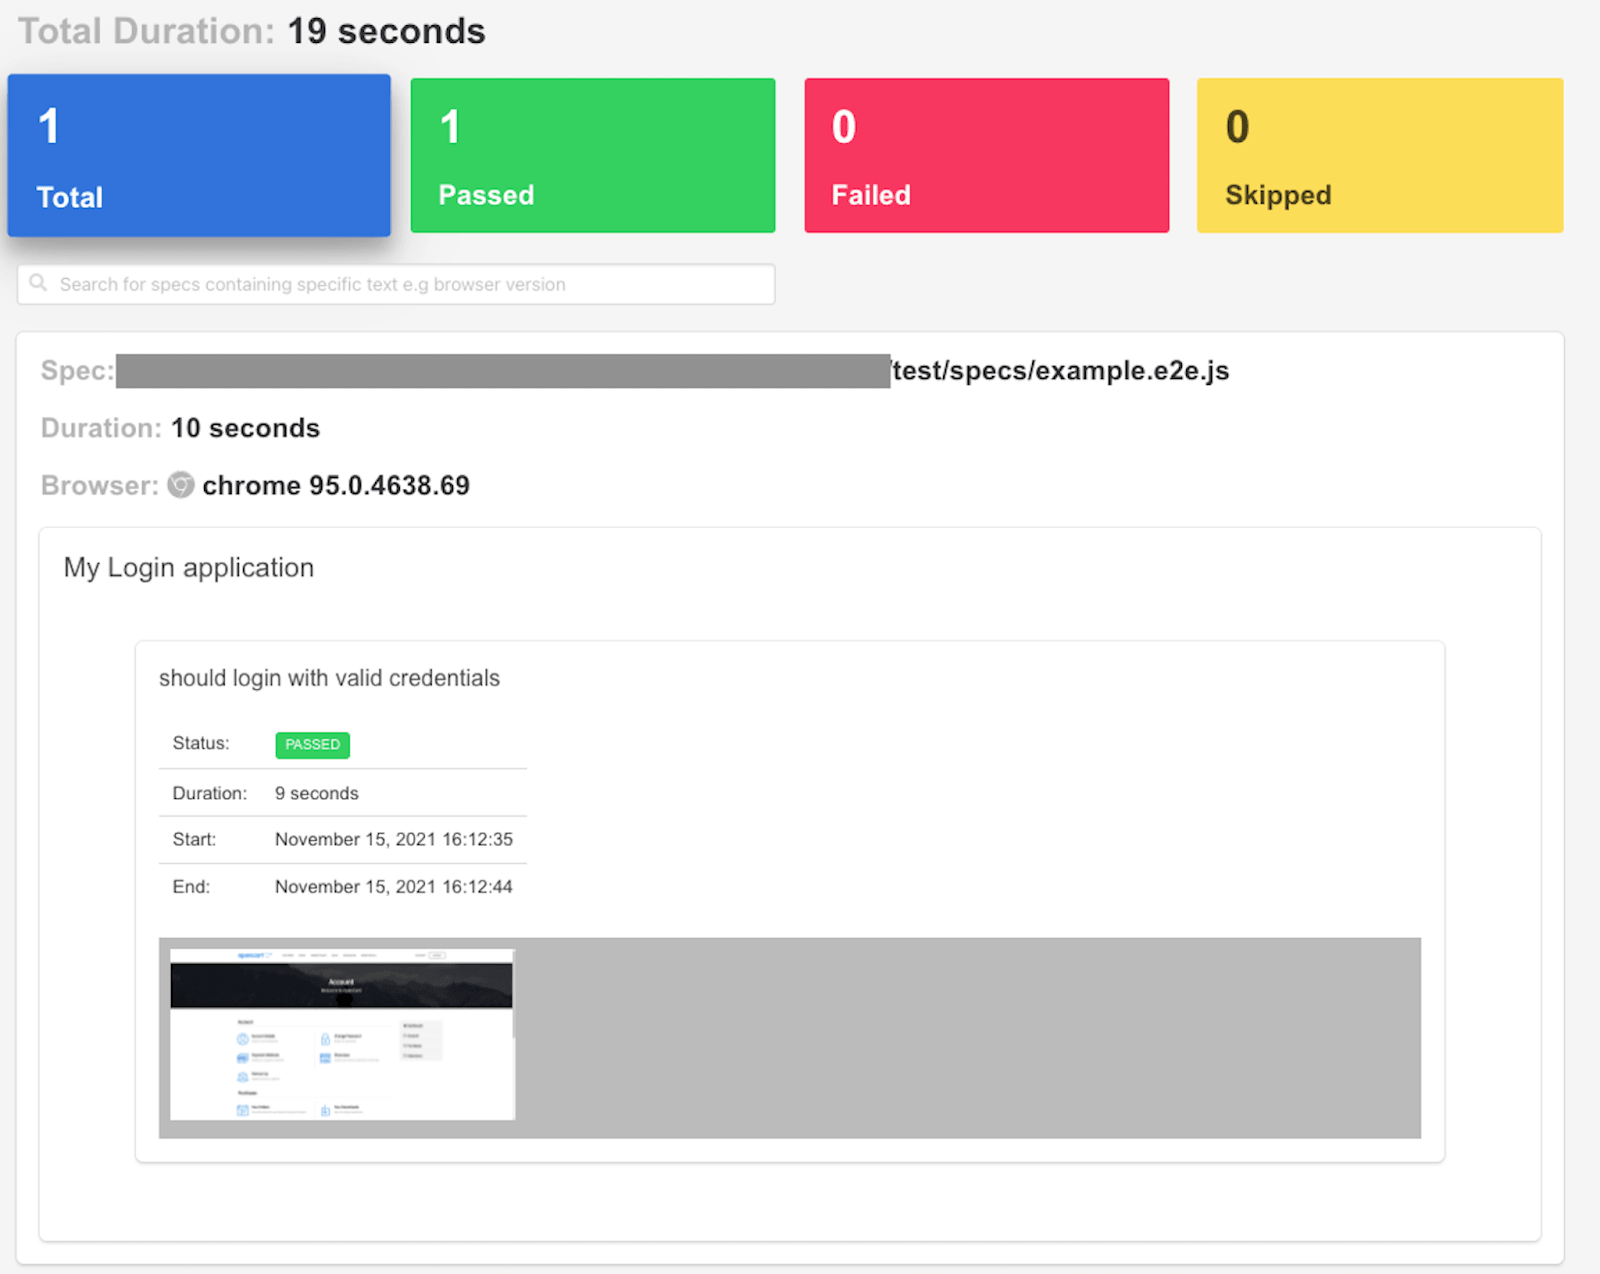
Please note here that we don’t want to call browser.takeScreenshot() in after hooks in this case as timeline reporter takes care of it internally through options embedImages and screenshotStrategy properties. However, if we use any other HTML reporting framework, we need to call browser.takeScreenshot() in after hooks.
Like we see here, a straightforward configuration, Timeline Reporter gives a very useful comprehensive HTML report.
Key Takeaway: Timeline Reporter builds one HTML report with passed, failed, and skipped tests and screenshots, but the package was last published in July 2020, so test it against your WebdriverIO version first.
HTML Reporter
This is another WebdriverIO HTML reporter that uses third-party packages to generate HTML reports. It provides a very detailed reporting of the test with screenshots. You can easily turn on and off the screenshots with a simple configuration from the WDIO config file. However, HTML reports will not be automatically generated unless an additional configuration is written in the event hooks of the WDIO config file (which is described in detail in the code example below).
HTML Reporter Features:
Here are some of the features of WebdriverIO HTML Reporter:
- Detailed reporting of the test with screenshots
- Error stack trace attached to test
- Post-processing is needed to aggregate test results of different suites
- Different filtering options are available to hide/unhide failed tests/suites
Let’s get it working:
HTML Reporter Installation:
To install HTML Reporter, please follow the below steps:
- Add the following dependency:
npm i wdio-html-nice-reporter - Shown below is the snapshot of the package installation:
"dependencies": {
    	"wdio-html-nice-reporter": "^7.8.7"
}
HTML Reporter Usage:
- Like what we have did for Timeline Reporter, import the dependency in wdio.conf.js
const {ReportAggregator, HtmlReporter} = require('wdio-html-nice-reporter');
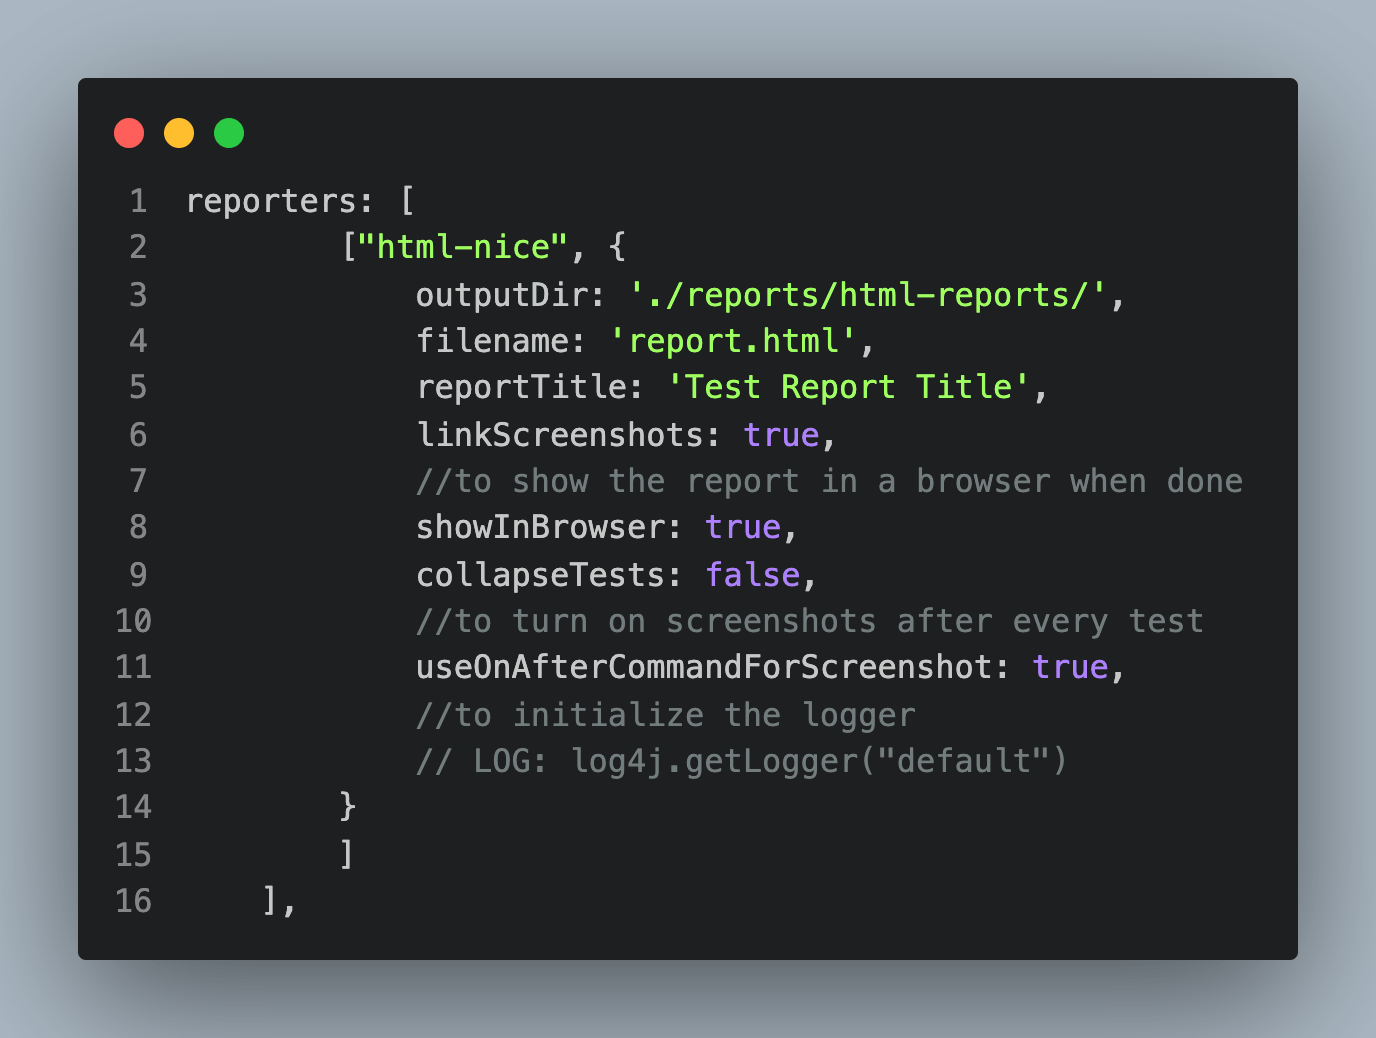
Where,
- outputDir is the path to keep the reports
- filename is the name of the report
- reportTitle is the report title (that would get displayed in the report)
- linkScreenshots: if it sets to true, screenshot will be attached to the HTML (given the takeScreenshot() method should be called in after hooks and sets in useOnAfterCommandForScreenshot to true)
WebdriverIO calls the reporter for each test suite. So, when we run multiple suits, just with the above code, we will not get an aggregated report. To get the aggregated report, we must add the following events to the WDIO config.
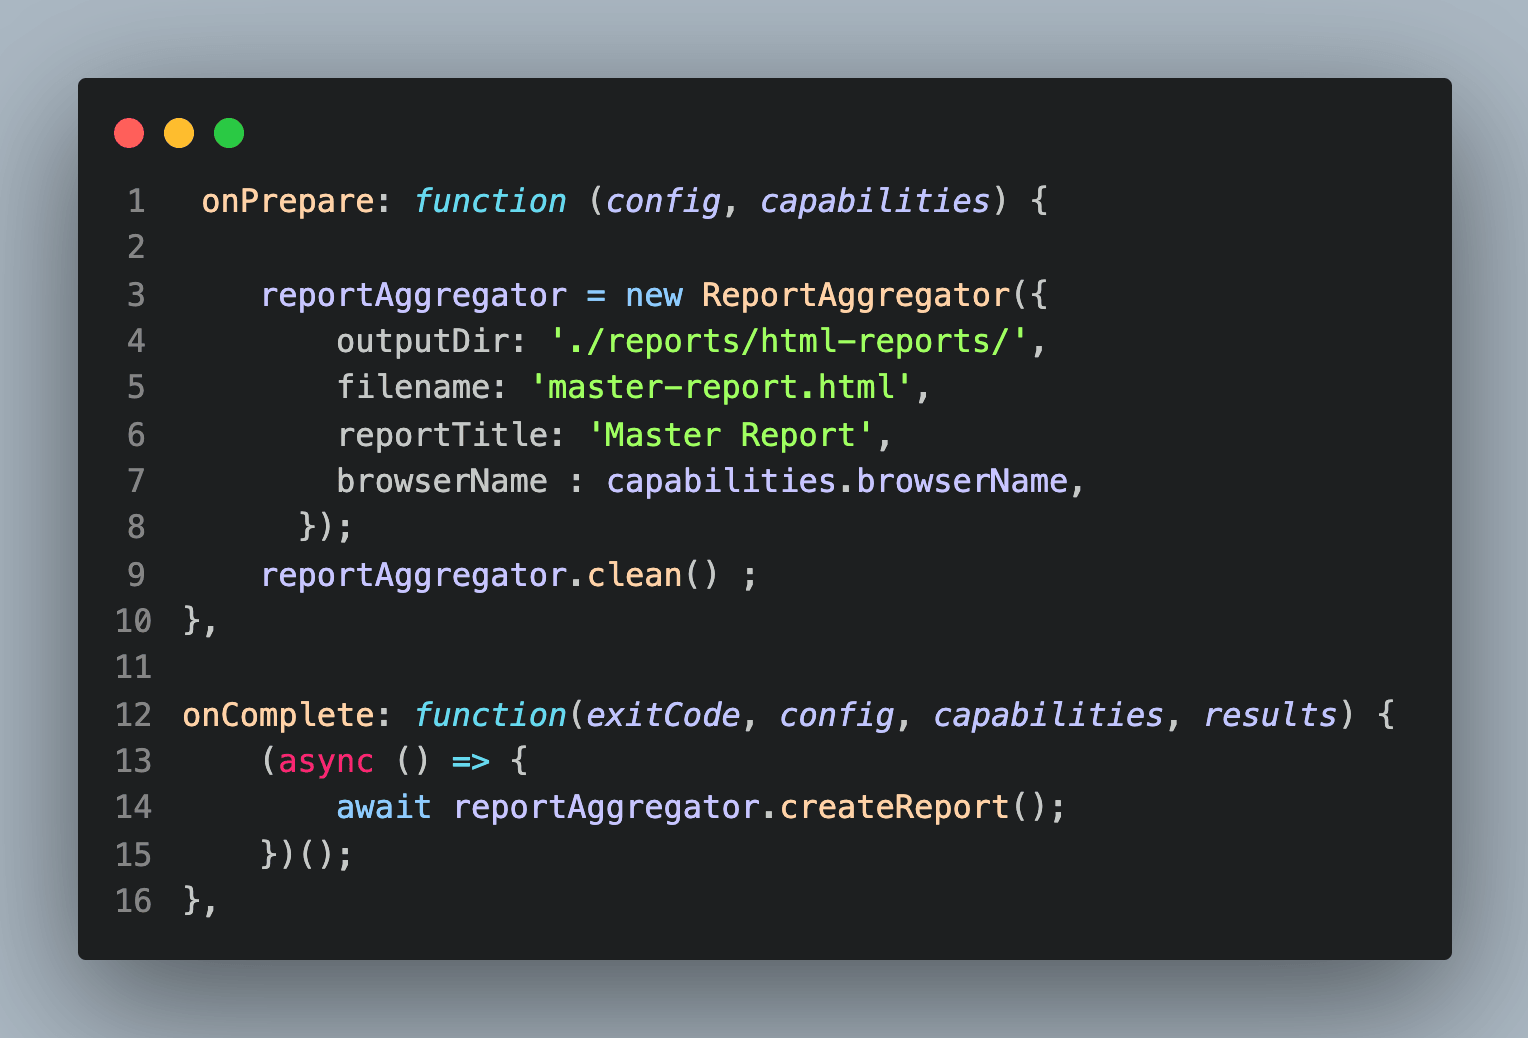
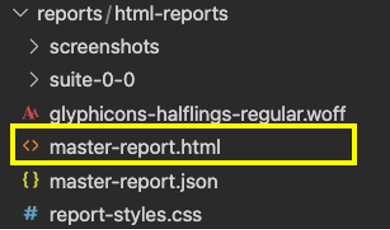
3. With all the above configurations, when we run the test, we will get a folder structure like below with a report (name can be changed in the config file):
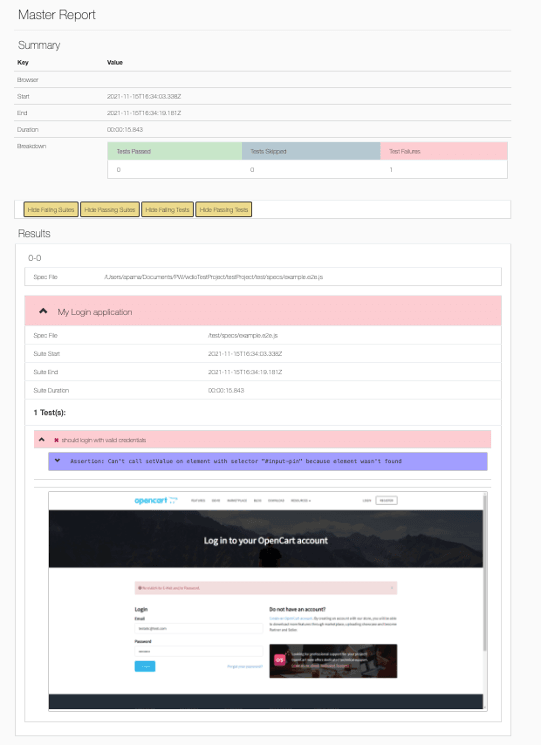
And below is the HTML report generated with screenshots for a failed scenario:
Allure Reporter
Allure reporter is one of the most used WebdriverIo HTML reporters, especially most popular with Cucumber frameworks.
Allure Reporter Features:
Here are some of the features of Allure Reporter while working with WebdriverIO:
- Allure reporter is a WebdriverIO plugin for Allure Framework
- Like any reports in the Allure framework, it generates reports in two easy steps:
- During test execution, it saves raw result files (JSON and attachments)
- Once test execution is done, during the report generation phase, those result files are converted into HTML
- Jenkins plugin is available for seamless CI (Continuous Integration) experience
- Report generated with screenshots and a detailed log is also attached in the report for every action in the test
Note: Please note that Java is a prerequisite (must) to generate Allure HTML reports
Allure Reporter Installation:
To install Allure Reporter, please follow the below steps:
- Like any dependency installation, it can be done by:
npm install @wdio/allure-reporter --save-dev - Once done, package.json will have the dependency added:
"devDependencies": {
    	"@wdio/allure-reporter": "^7.16.8",
Allure Reporter Usage:
- Configure wdio.conf.js to use allure reports. Then, update “reporters” with allure and configure the output directory.
reporters: [
    	['allure', {
    	outputDir: 'allure-results',
	}]
],
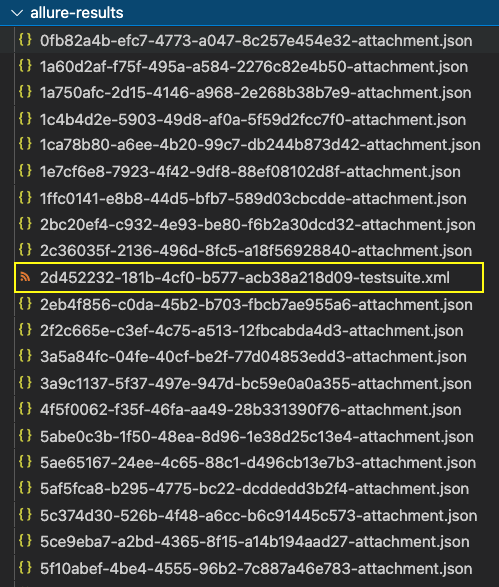
npm install -g allure-commandline
allure generate <allure-report-directory> && allure opene.g.: allure generate allure-results && allure open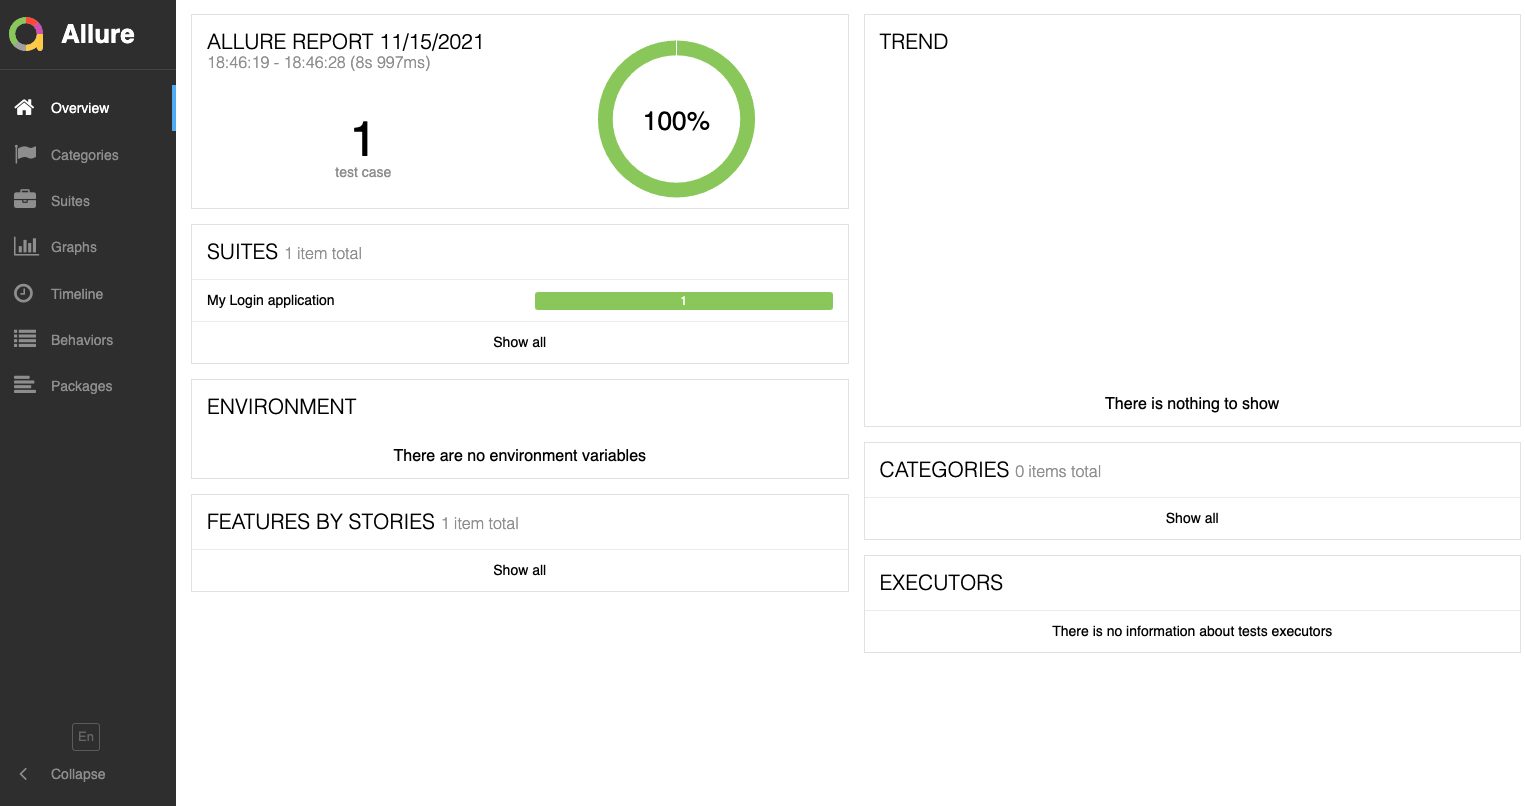
This is a very detailed report where we can see every request and response for each action in the test is captured as shown in the screenshot below:
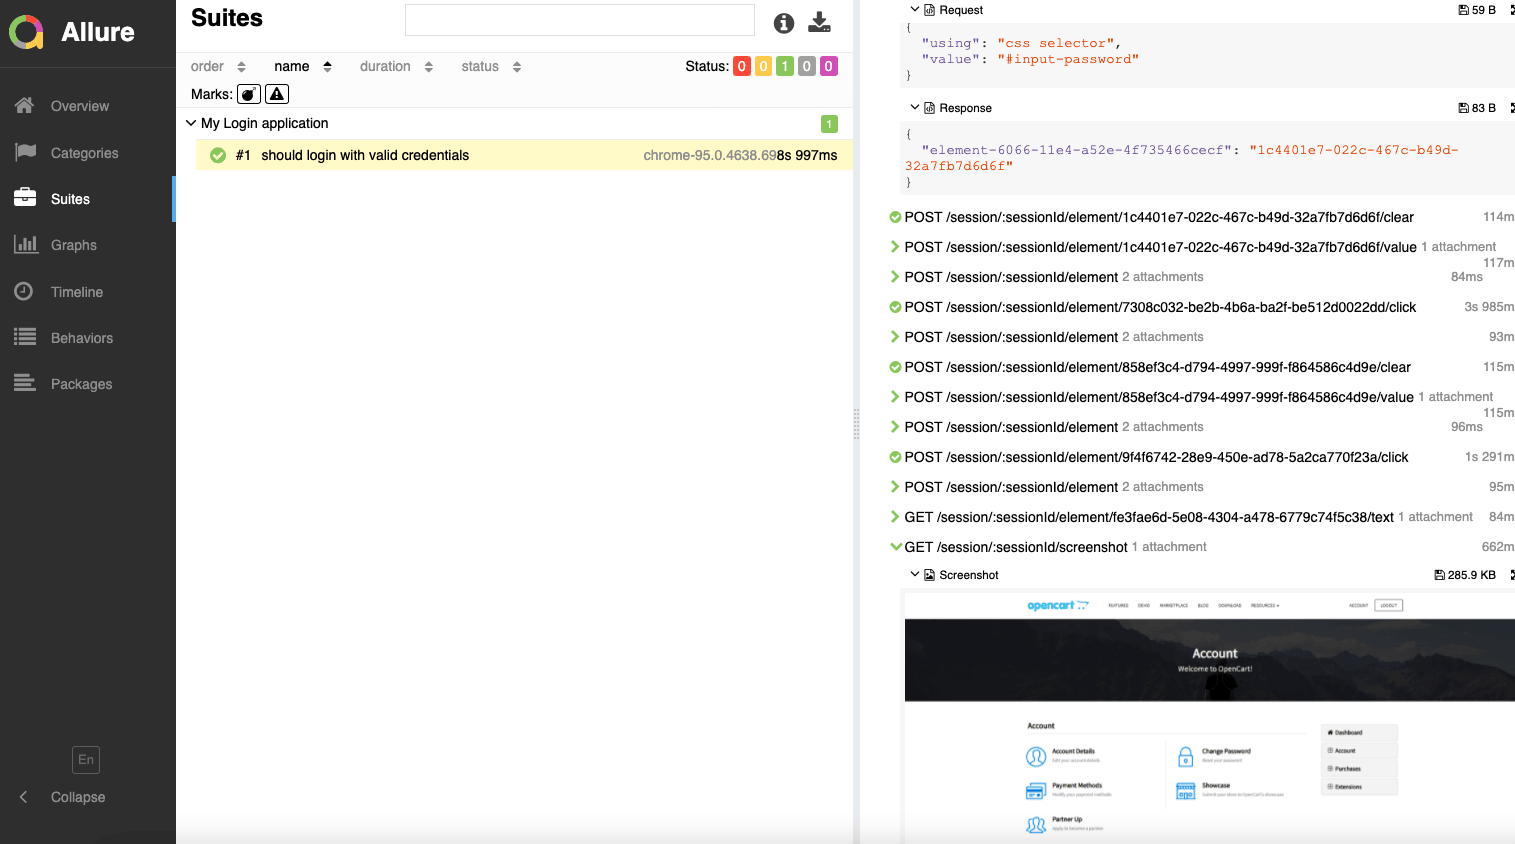
If we have more tests and test runs, we will be able to see details in TREND. There is also a section called Graphs, where we can find more details such as the Status of the entire suite, severity, duration, duration trend, and many more details as we explore. The TREND graph is handy to monitor the stability of the tests/suites.
Conclusion
The right WebdriverIO reporter depends on who reads the results and where:
| Need | Reporter to start with |
|---|---|
| Quick feedback in the terminal | Spec Reporter |
| Results for a CI server | JUnit Reporter |
| Rich, shareable HTML reports | Allure Reporter (@wdio/allure-reporter) |
| One aggregated HTML report across suites | HTML Reporter (wdio-html-nice-reporter with ReportAggregator) |
Timeline Reporter still produces a clean report, but its package was last published in July 2020, so confirm it works with your WebdriverIO version before adopting it.
To strengthen what those reports show, add clear WebdriverIO assertions to each test.
Author

Aparna Gopalakrishnan
Blogs: 1


Aparna A Gopalakrishnan is a Lead QA Engineer at Dojo in London with over 10 years of experience in test automation, quality engineering, and BDD-driven testing across enterprise applications. She specializes in building and scaling automation frameworks using WebdriverIO, Playwright, Cucumber, JBehave, and Selenium, with strong hands-on experience in accessibility, visual, and security testing. Before Dojo, she was a Senior QA Engineer at Trainline and a Quality Engineering and BDD consultant and trainer at Wipro. Aparna is a trainer, speaker, and blogger who has authored multiple articles on software quality, accessibility testing, and automation best practices. She holds a Master’s degree in Software Engineering from BITS Pilani.
Reviewer

Parth Mistry
Reviewer
Parth Mistry is a Member of Technical Staff at TestMu AI (formerly LambdaTest), building SmartUI, the visual regression testing product. He developed and owns the SmartUI CLI, a modular TypeScript tool built on Playwright for multi-browser automation, and built the Storybook CLI for visual regression of UI components. He maintains cross-language SDKs in Python, Java, Ruby, C#, and Node.js, and engineered a Node-based visual rendering service on Kafka, Redis, MySQL, and S3. His migration of that service to an event-driven, KEDA-autoscaled architecture improved execution speed by 60% and cut annual infrastructure cost by $9,600. He also built the end-to-end SmartUI integration with KaneAI. Parth is a Google Summer of Code 2024 contributor and an alumnus of IIT Jodhpur.
Frequently asked questions
Did you find this page helpful?
More Related Blogs
TestMu AI forEnterprise
Get access to solutions built on Enterprise
grade security, privacy, & compliance
- Advanced access controls
- Advanced data retention rules
- Advanced Local Testing
- Premium Support options
- Early access to beta features
- Private Slack Channel
- Unlimited Manual Accessibility DevTools Tests