

Power Your Software Testing with AI Agents and Cloud
The Native AI-Agentic Cloud Platform to Supercharge Quality Engineering. Test Intelligently and Ship Faster.


- TestMu AI (Formerly LambdaTest)
- /
- Blog
- /
- Gain Intelligent Insights With Analytics AI CoPilot Dashboard
Gain Intelligent Insights With Analytics AI CoPilot Dashboard
Enhance testing with Analytics AI CoPilot Dashboard - harness AI for smarter decisions, streamlined workflows, and improved productivity.
Last Updated on:
Developers and testers often face challenges such as excessive manual data analysis, inconsistent insights, and delayed issue identification. Large Language Models (LLMs) can address these issues by processing large volumes of text, identifying key features, and understanding context, which reduces manual effort and improves testing effectiveness. To make test analysis effortless, TestMu AI now has AI CoPilot, which uses LLMs, in the Test Analytics platform to enhance efficiency and accuracy.
It offers actionable insights and reduces manual intervention. The Analytics Dashboard AI CoPilot aims to streamline test management, improve decision-making, and boost overall productivity for QA teams by tackling these pain points. This ultimately accelerates the testing process and ensures higher-quality results.
To get started, head over to our documentation Analytics AI CoPilot Dashboard.
What Is Analytics AI CoPilot Dashboard?
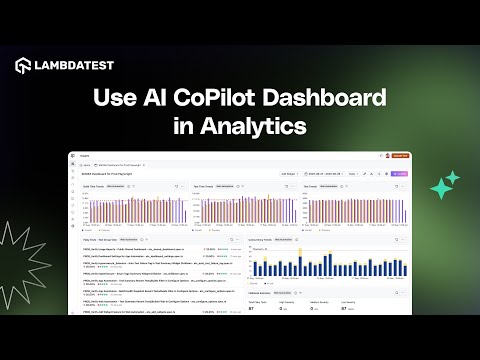
The AI CoPilot Dashboard in the TestMu AI Test Analytics platform is designed to elevate how to manage and analyze testing data. It offers an intuitive interface where users can interact with their data using queries, receive recommendations, and conduct detailed trend and comparative analyses.
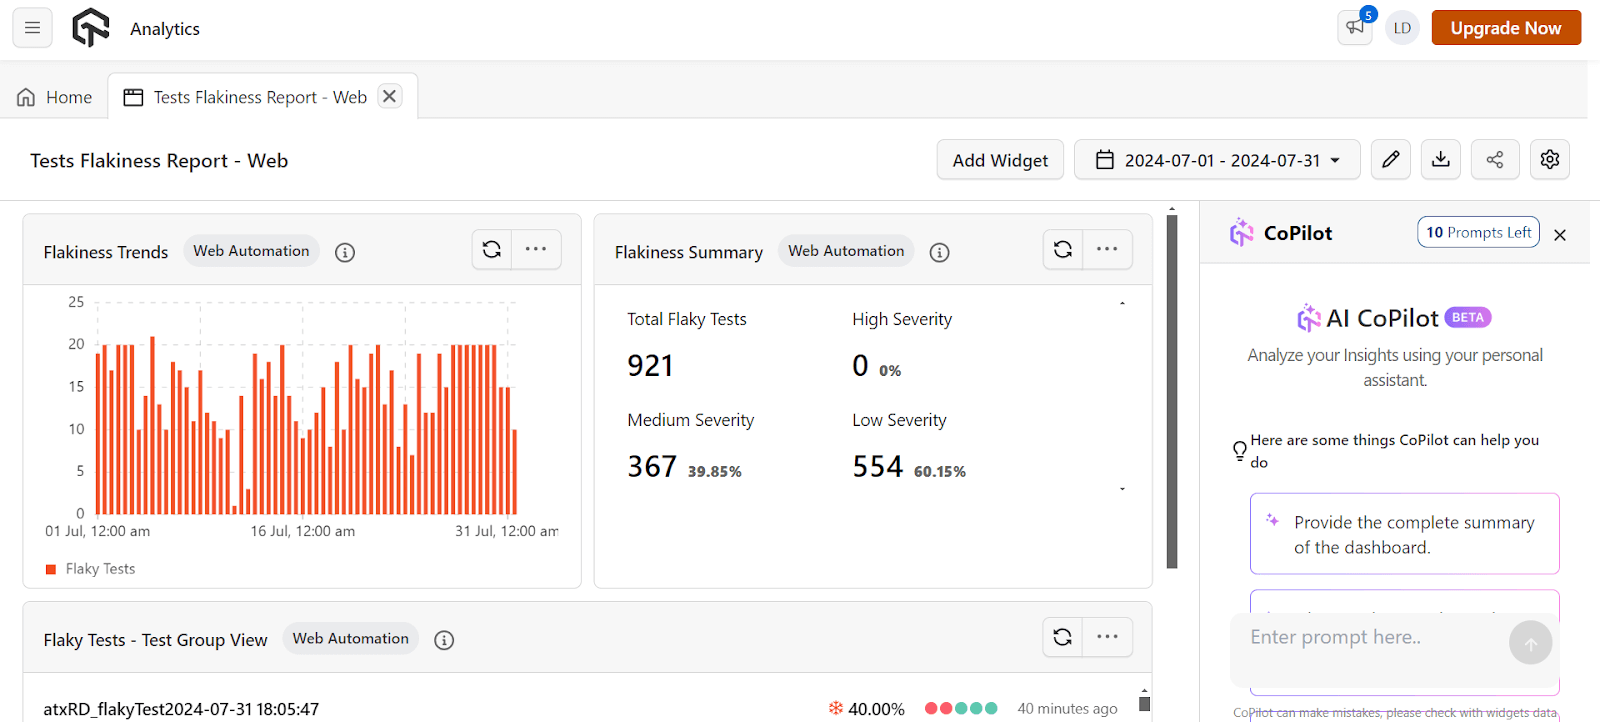
The Analytics AI CoPilot Dashboard features a wide range of widgets designed to enhance how you interact with data. They are AI-native and enable you to ask questions or submit queries directly.
In response, the AI CoPilot provides insightful recommendations and answers based on the data you’re exploring. We have implemented rate limits and usage guidelines for the Analytics AI CoPilot Dashboard to ensure optimal performance and availability.
The TestMu AI analytics platform also distinguishes unique test instances from re-runs, so retried tests are tracked separately and don’t distort your pass/fail metrics. See the analytics unique instances retry detection documentation.
How Does Analytics AI CoPilot Dashboard Help?
The AI CoPilot Dashboard for Test Analytics is a game-changer for testing and data analysis needs. Each feature is designed to enhance productivity, streamline workflows, and provide deep insights into your data:
- Natural Language Query: Interact with the AI CoPilot using natural language. Ask questions, seek clarifications, and express your data analysis requirements conversationally, just as you would with a human expert.
- Trend Analysis: By identifying patterns, seasonality, and notable changes over time, you can make strategic modifications by visualizing trends in your data.
- Customization and Flexibility: Customize data ranges, filter criteria, and visualization preferences to align with your unique business objectives.
- Insightful Analysis: Unlock a deeper understanding of data with the AI CoPilot. Identify key factors and find opportunities for enhancement through its advanced analytics capabilities.
- Detailed Comparisons: Conduct detailed analyses across various metrics, segments, or time periods. It helps to understand performance fluctuations and set benchmarks aligned with industry norms.

Note: Check high-quality impact issues with AI-native Test Analytics. Try TestMu AI Today!
Example Natural Language Prompts for Test Analytics
The fastest way to understand the AI CoPilot is to see the questions it answers. Instead of building a chart by hand, you type a request in plain English. Natural language processing (NLP) parses the intent, maps it to the underlying test data, and returns a chart or table you can pin to the dashboard. Here are practical prompts a QA team can copy and adapt.
- Find flaky tests:
Identify the top 5 flaky tests in our Safari suite over the last 14 days.The CoPilot returns a ranked table of the most unstable tests. See flaky tests for why these matter. - Trend an error type:
Show me the trend of timeout errors compared to last week.This produces a time-series chart contrasting the two periods. - Compare builds:
Compare the pass rate of build 482 against build 481.The CoPilot returns the delta as a table or bar chart. - Surface slow tests:
List the 10 slowest tests this sprint and their average duration.Useful for prioritizing performance cleanup. - Locate failure hotspots:
Which modules had the most failures in the last release?The answer points effort at the riskiest areas.
Because the CoPilot understands context, you can refine conversationally, for example following up with "now break that down by browser" or "change the chart to a line graph." Each prompt maps directly to the QA metrics the dashboard already tracks, so the output is grounded in your real results rather than a generic summary.
Manual Reporting vs AI CoPilot Analytics
The AI CoPilot changes the economics of test reporting. The table below contrasts the traditional manual workflow with the AI-driven approach.
| Dimension | Traditional Manual Reporting | AI CoPilot Analytics |
|---|---|---|
| Building a view | Manually configure filters, columns, and charts | Ask in natural language; the chart is generated for you |
| Skill required | Familiarity with the reporting tool and query filters | Ability to describe the question in plain English |
| Speed to insight | Minutes to hours per report, repeated each time | Seconds; refine conversationally without rebuilding |
| Finding anomalies | You have to know what to look for | The CoPilot surfaces anomalies and key drivers proactively |
| Consistency | Varies by who built the report | Same query returns the same structured result every time |
For teams that still rely on static exports, this guide to test reports shows the manual baseline the CoPilot is designed to replace.
The same shift applies when your own product ships a copilot or chat assistant: an agent that answers questions needs testing for wrong, incomplete, or context-blind answers before users rely on it. TestMu AI's AI agent testing platform does this with autonomous AI evaluators that converse with your agent like real users, scoring chat and voice interactions on 9 quality metrics including hallucination, completeness, and context awareness, then rolling the results into a Green, Yellow, or Red production-readiness verdict. It generates 60 to 100+ scenarios from your uploaded docs and is free to start.
How to Get Started With Analytics AI CoPilot Dashboard?
Getting started with the AI CoPilot Analytics Dashboard is simple. Follow the steps provided below to help in gaining actionable insights from your testing data.
If your organization uses Google Workspace, TestMu AI supports Google SSO for streamlined team access. See the TestMu SSO Google documentation.
- Sign In: Use your registered credentials to log into your TestMu AI account.
- Access Insights: Navigate to the “Insights” section from the left menu to access analytics and dashboard features.
- Select or Create Dashboard: Select an existing dashboard or create a new one, adding the necessary widgets and data.
- Launch AI CoPilot: Click on the “AI CoPilot” button in the top right corner of the dashboard to initiate the feature.
- Analyze Queries: Enter your queries or questions. The AI CoPilot will interpret your input and provide relevant insights based on your data.
Prerequisites and Role-Based Access Control (RBAC)
Before you can query the AI CoPilot Dashboard, a few things need to be in place, and access is governed by the same permission model as the rest of the platform.
Prerequisites
- An active TestMu AI account with access to the Insights section of Test Analytics.
- Test data flowing into the platform, so the CoPilot has results to analyze. The more history available, the richer the trend and comparison analysis.
- A role that permits analytics access. Advanced analytics capabilities, such as whitelabeled dashboards and advanced data-retention rules, are available on the Enterprise tier; confirm scope with the TestMu AI team.
Role-based access control
Access to the dashboard is controlled by role-based access control (RBAC), with administrator, user, and guest roles. A user only sees insights for the projects they already have permission to view, so there is no implicit cross-project visibility. Sign-in supports single sign-on (SSO) via SAML 2.0, with two-factor authentication for privileged access. This lets administrators delegate dashboard access to the right people and restrict sensitive analytics from everyone else, mapping analytics visibility onto the test automation metrics each team is responsible for.
Data Security, Privacy, and Governance
Test logs often contain sensitive information, so the AI CoPilot reads data the platform already holds under the platform's existing security controls rather than moving it somewhere new. To keep performance predictable and prevent abuse, TestMu AI also applies rate limits and usage guidelines to CoPilot queries.
Your Test Data Stays Protected
The Analytics platform follows recognized industry security standards. Your test data is protected by:
- Certifications: SOC 2 Type II and ISO 27001:2022, 27017:2015, and 27701:2019, with GDPR, CCPA, HIPAA, and PCI DSS compliance.
- Encryption: TLS 1.2 or higher in transit and AES-256 at rest.
- Isolation: per-tenant isolation, so your data is never commingled with another organization's.
- Access control: RBAC, SSO (SAML 2.0), two-factor authentication for privileged access, and audit logs. You only ever see the projects you are permitted to see.
For the full, current list of certifications and controls, and for specific questions about data residency, retention windows, or how data is handled with AI models, refer to the TestMu AI Trust and Security page or contact the TestMu AI team.
Conclusion
The AI CoPilot Analytics Dashboard is set to transform your testing and data analysis approach. By integrating AI-driven insights, we aim to enhance your productivity and simplify your workflows. Our dedicated support team is here to assist you 24/7, ensuring you have the best possible experience with our tools. For a tour of the dashboard widgets and what each one surfaces, see the Tests Overview analytics widgets docs.
You can also schedule automated report delivery on the TestMu AI analytics platform so insights reach your team without manual effort. See the analytics report scheduling documentation for setup steps.
Stay tuned for more exciting updates and features as we continue to innovate and push the boundaries of what’s possible in the world of software testing. Embrace the future of testing with the AI CoPilot Analytics Dashboard and unlock the full potential of your data today!
Author

Mythili Raju
Blogs: 58


Mythili is a Community Contributor at TestMu AI with 3+ years of experience in software testing and marketing. She holds certifications in Automation Testing, KaneAI, Selenium, Appium, Playwright, and Cypress. At TestMu AI, she leads go-to-market (GTM) strategies, collaborates on feature launches, and creates SEO optimized content that bridges technical depth with business relevance. A graduate of St. Joseph’s University, Bangalore, Mythili has authored 35+ blogs and learning hubs on AI-driven test automation and quality engineering. Her work focuses on making complex QA topics accessible while aligning content strategy with product and business goals.


Analytics AI CoPilot Dashboard FAQs
Did you find this page helpful?
More Related Blogs
TestMu AI forEnterprise
Get access to solutions built on Enterprise
grade security, privacy, & compliance
- Advanced access controls
- Advanced data retention rules
- Advanced Local Testing
- Premium Support options
- Early access to beta features
- Private Slack Channel
- Unlimited Manual Accessibility DevTools Tests