Test Run Instance View
This feature is currently being rolled out in phases and may not be available on all accounts. If you do not see the New View badge on your test instances, your account has not been enabled yet.
The Test Run Instance view provides a step-level execution replay that maps each executed action back to the original steps authored in KaneAI. Instead of reviewing raw automation logs, you can walk through the exact sequence of steps - with screenshots, command details, and failure context - in a single unified interface.
A test run is reported in one of two ways, depending on the Mode it runs with on HyperExecute:
- Classic Reporting - The view described in the sections from Test Run Summary Dashboard to Share a Test Run Instance.
- Evidence Reporting - A sealed evidence pack for the run, with a report, a step-by-step replay of each instance, issues with root cause analysis, and coverage. See Evidence Reporting.
Test Run Summary Dashboard
When you open a test run, the summary dashboard gives you an at-a-glance view of the entire run.
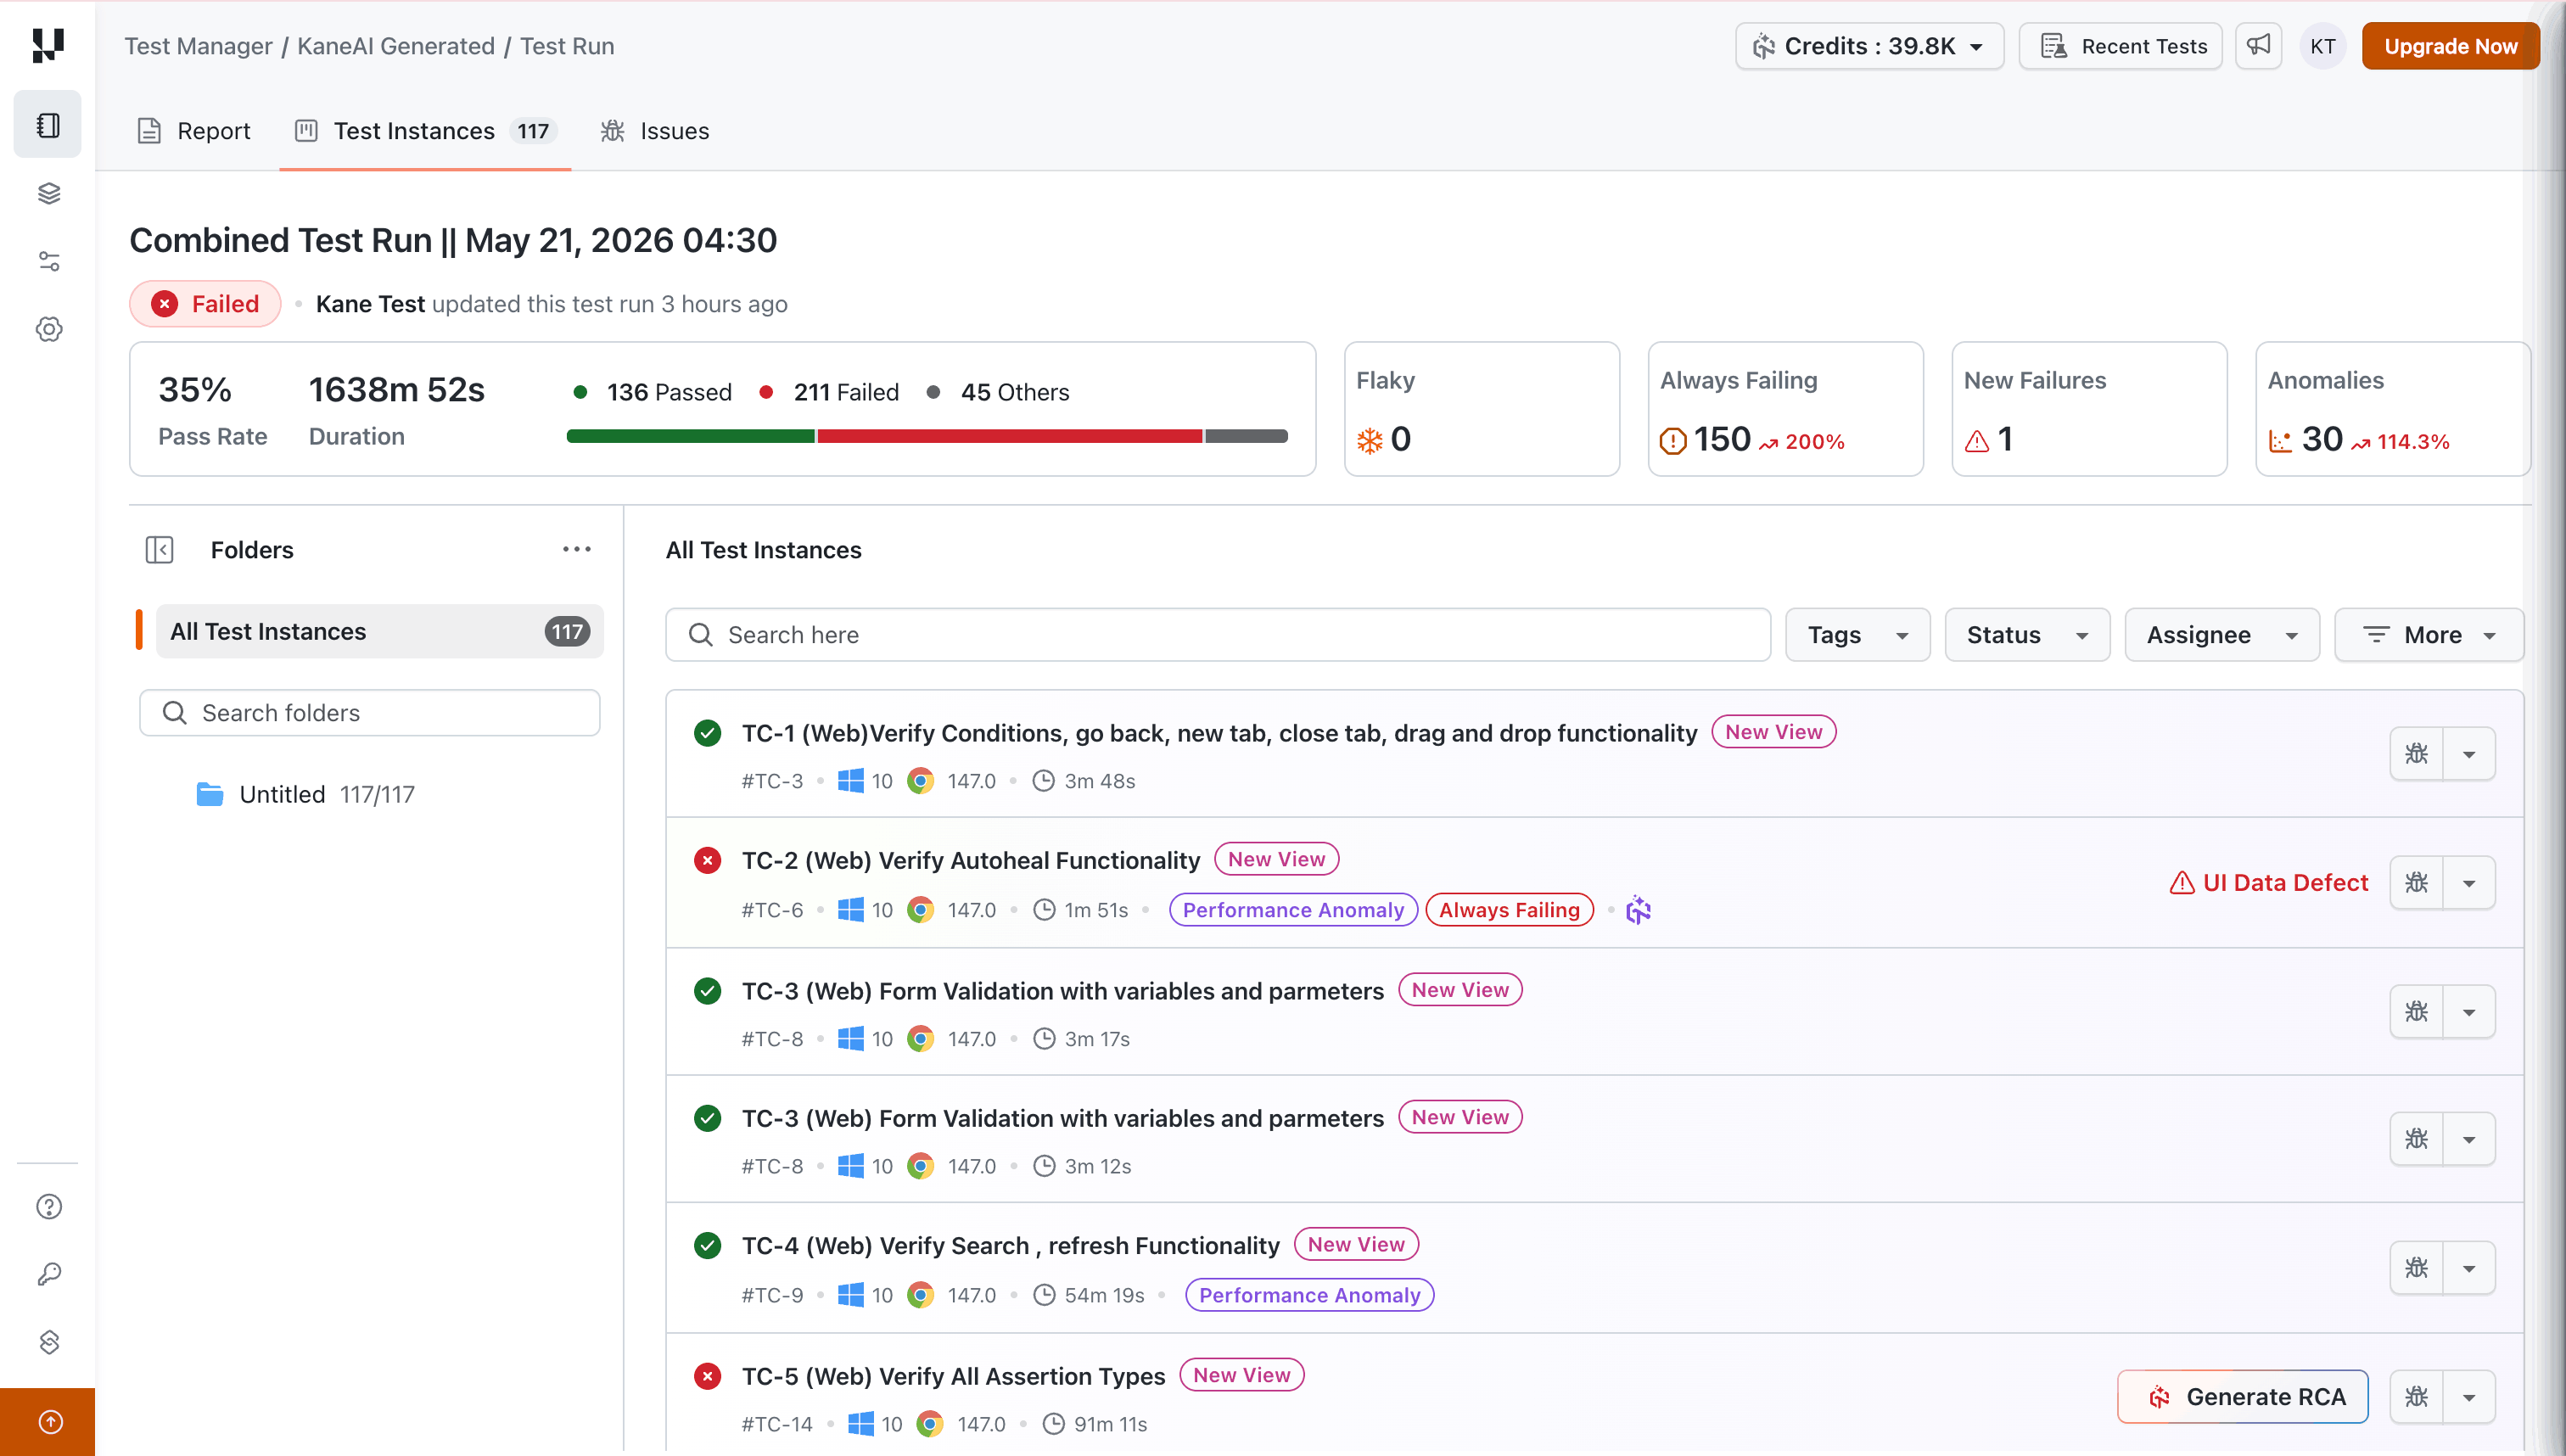
Test instances with the New View badge support the enhanced instance view described below.
Test Instance Detail View
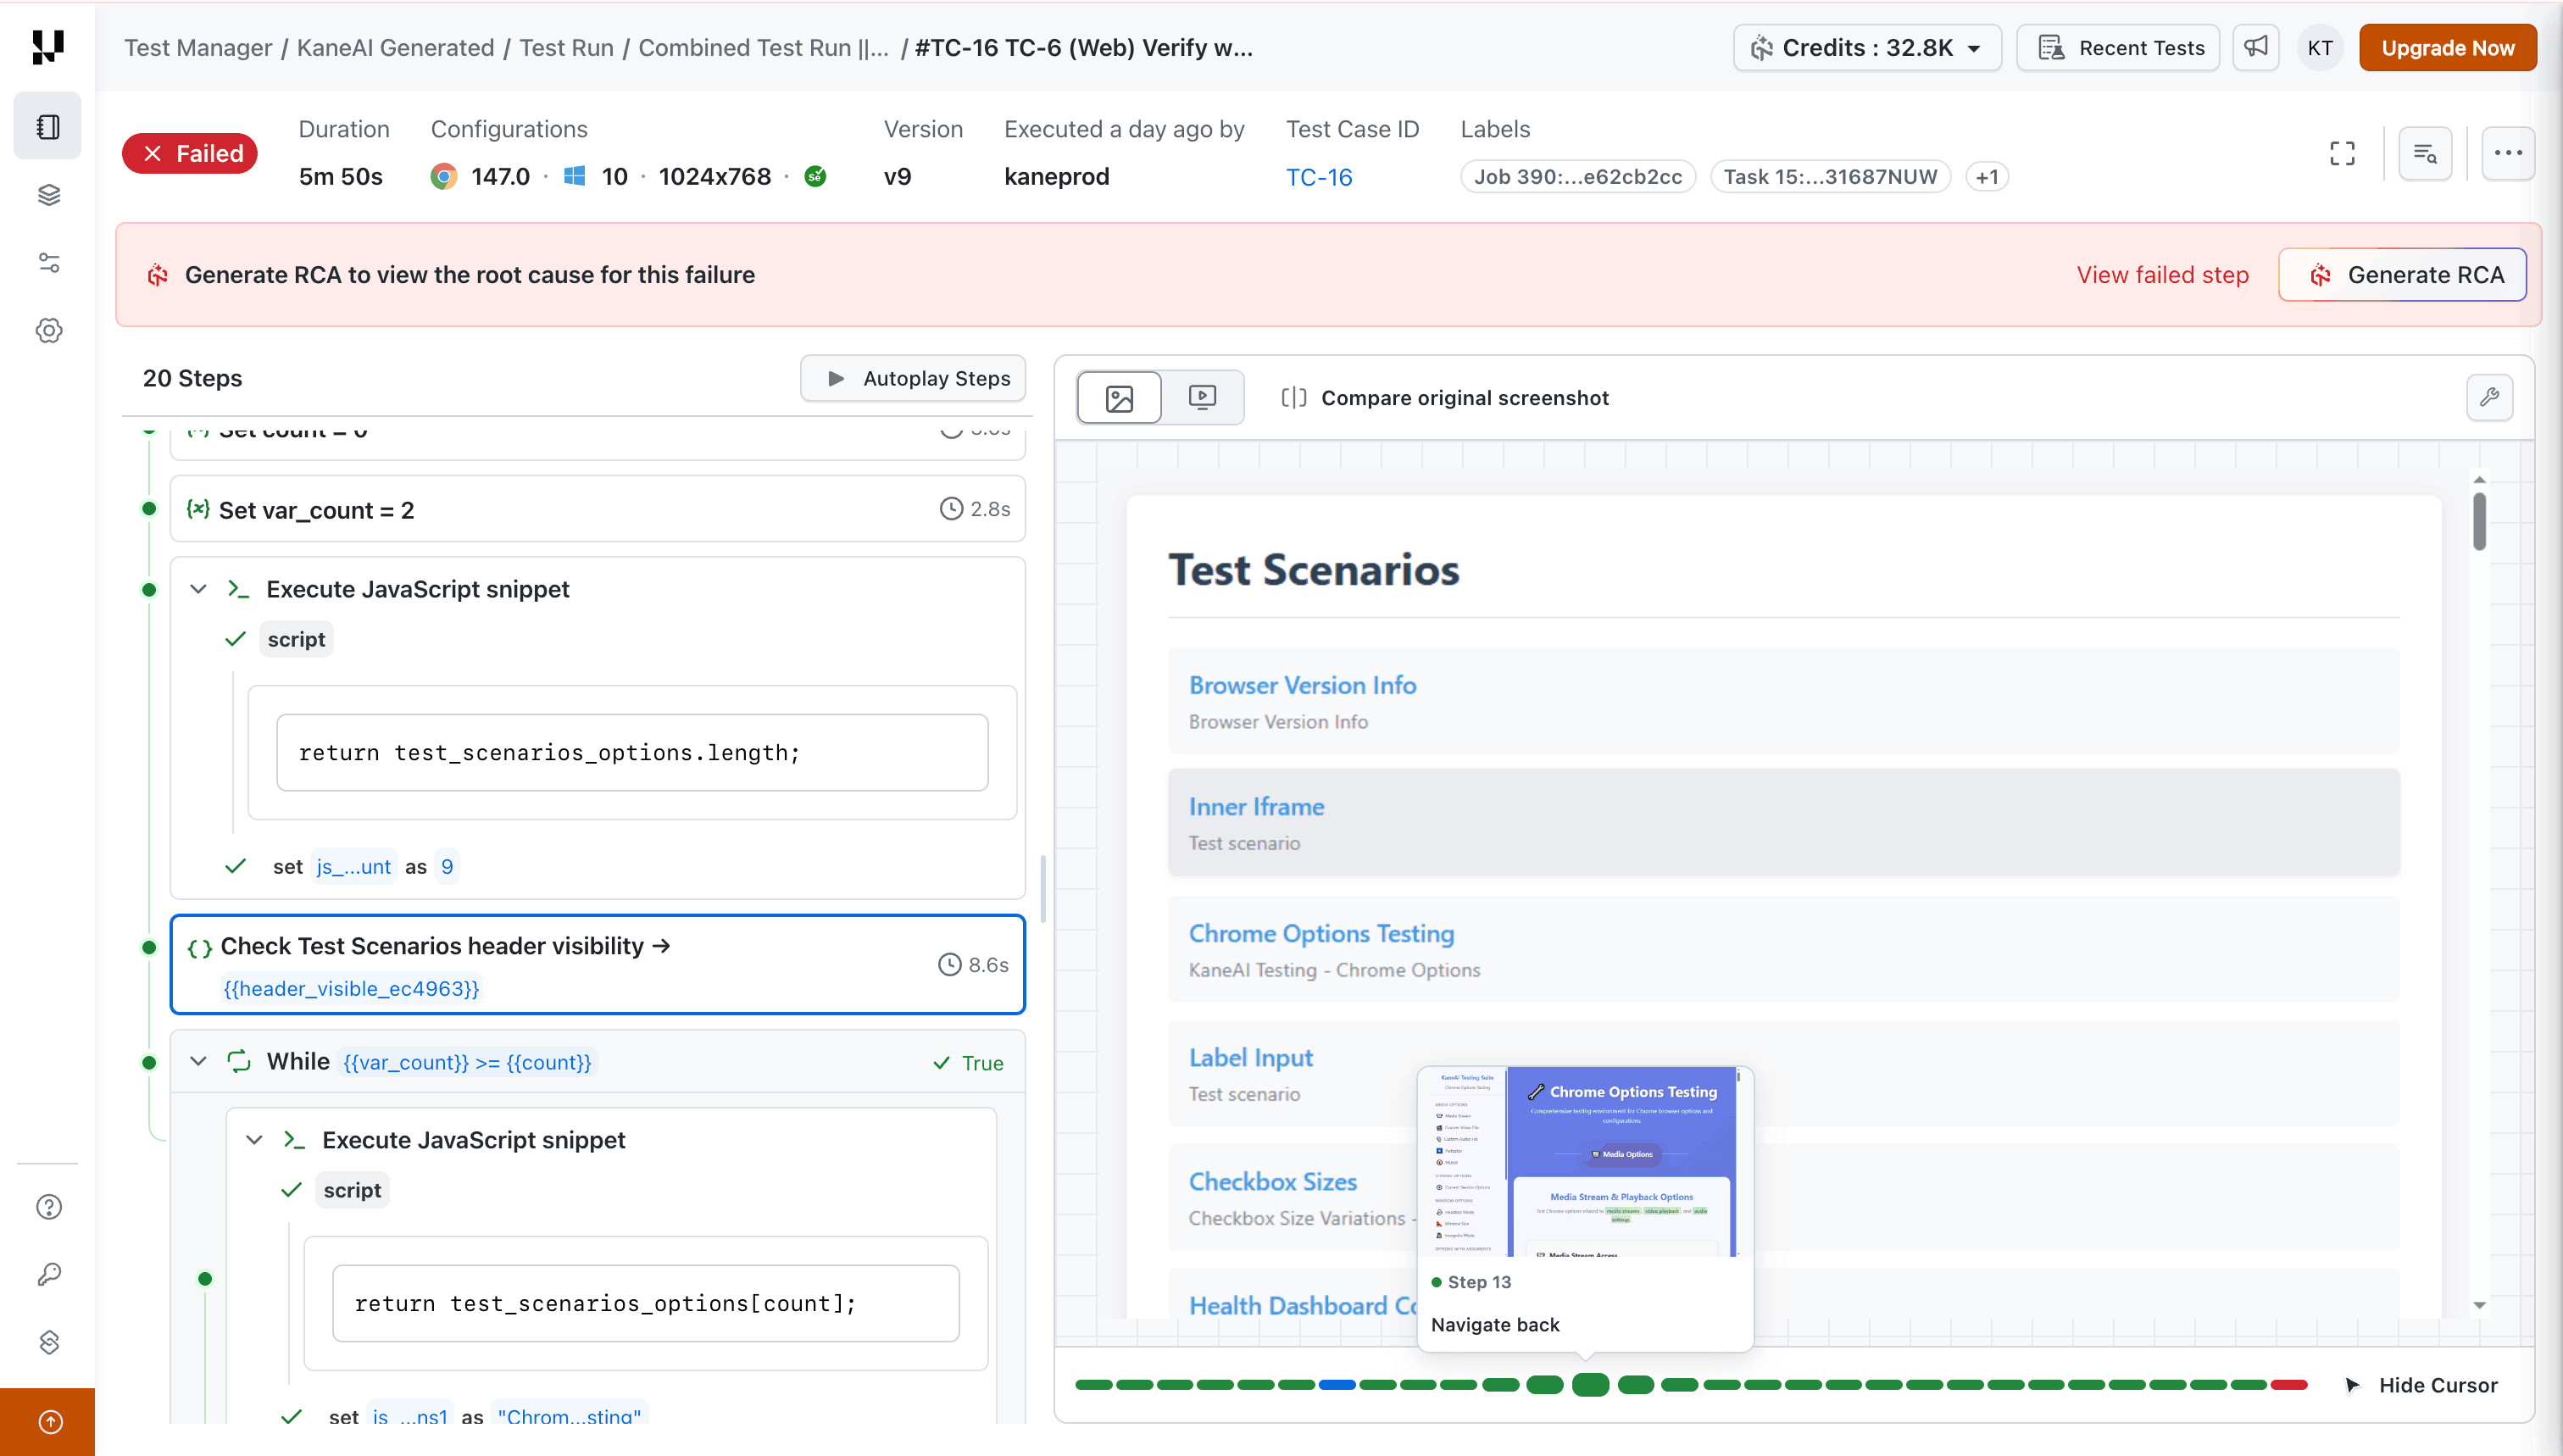
Click on any test instance to open the detailed execution view. The page is divided into three main areas: the Steps Panel on the left, the Screenshot/Video Panel in the center, and the Inspector Panel on the right.
Execution Metadata
The top bar displays key information about the test instance:
- Status - Passed or Failed indicator
- Duration - Total execution time
- Configurations - Browser version, OS, and resolution
- Version - Test case version used for this execution
- Executed by - The user or scheduler that triggered the run
- Test Case ID - Link back to the original test case
- Labels - Associated job and task identifiers
For failed tests, a banner prompts you to Generate RCA (Root Cause Analysis) or View failed step to jump directly to the point of failure.
Steps Panel
The left panel lists every step that was executed, mapped back to the original steps authored in KaneAI. Each step shows:
- The action type (click, assert, set variable, execute JavaScript, navigate, scroll, etc.)
- The execution duration for that step
- A pass/fail indicator (green dot for passed, red dot for failed, gray for skipped)
- Variable values and assertion results inline
Steps that include sub-actions - such as loops, conditionals, or JavaScript snippets - are expandable to reveal the full execution detail.
Auto-Heal Visibility
When Auto-Heal recovers a step during execution, that step displays an auto-heal indicator icon next to its execution duration in the steps panel. This gives you clear, step-level visibility into exactly which steps were healed in a run, without digging through execution logs.
Autoplay Steps
Click the Autoplay Steps button at the top of the steps panel to automatically walk through each step in sequence. As each step is highlighted, the center panel updates to show the corresponding screenshot captured during execution. This provides a visual replay of the entire test execution without needing to click through each step manually.
Screenshot and Video Panel
The center panel shows a screenshot of the application under test at the point when the selected step was executed. You can toggle between:
- Screenshot view - A static capture of the page at that step
- Video view - A recorded video of the execution
At the bottom of the panel, a step progress bar displays colored dots representing each step - green for passed, red for failed. Click any dot to jump directly to that step.
Hovering over a dot shows a preview tooltip with the step number and action name.
Compare Original Screenshot
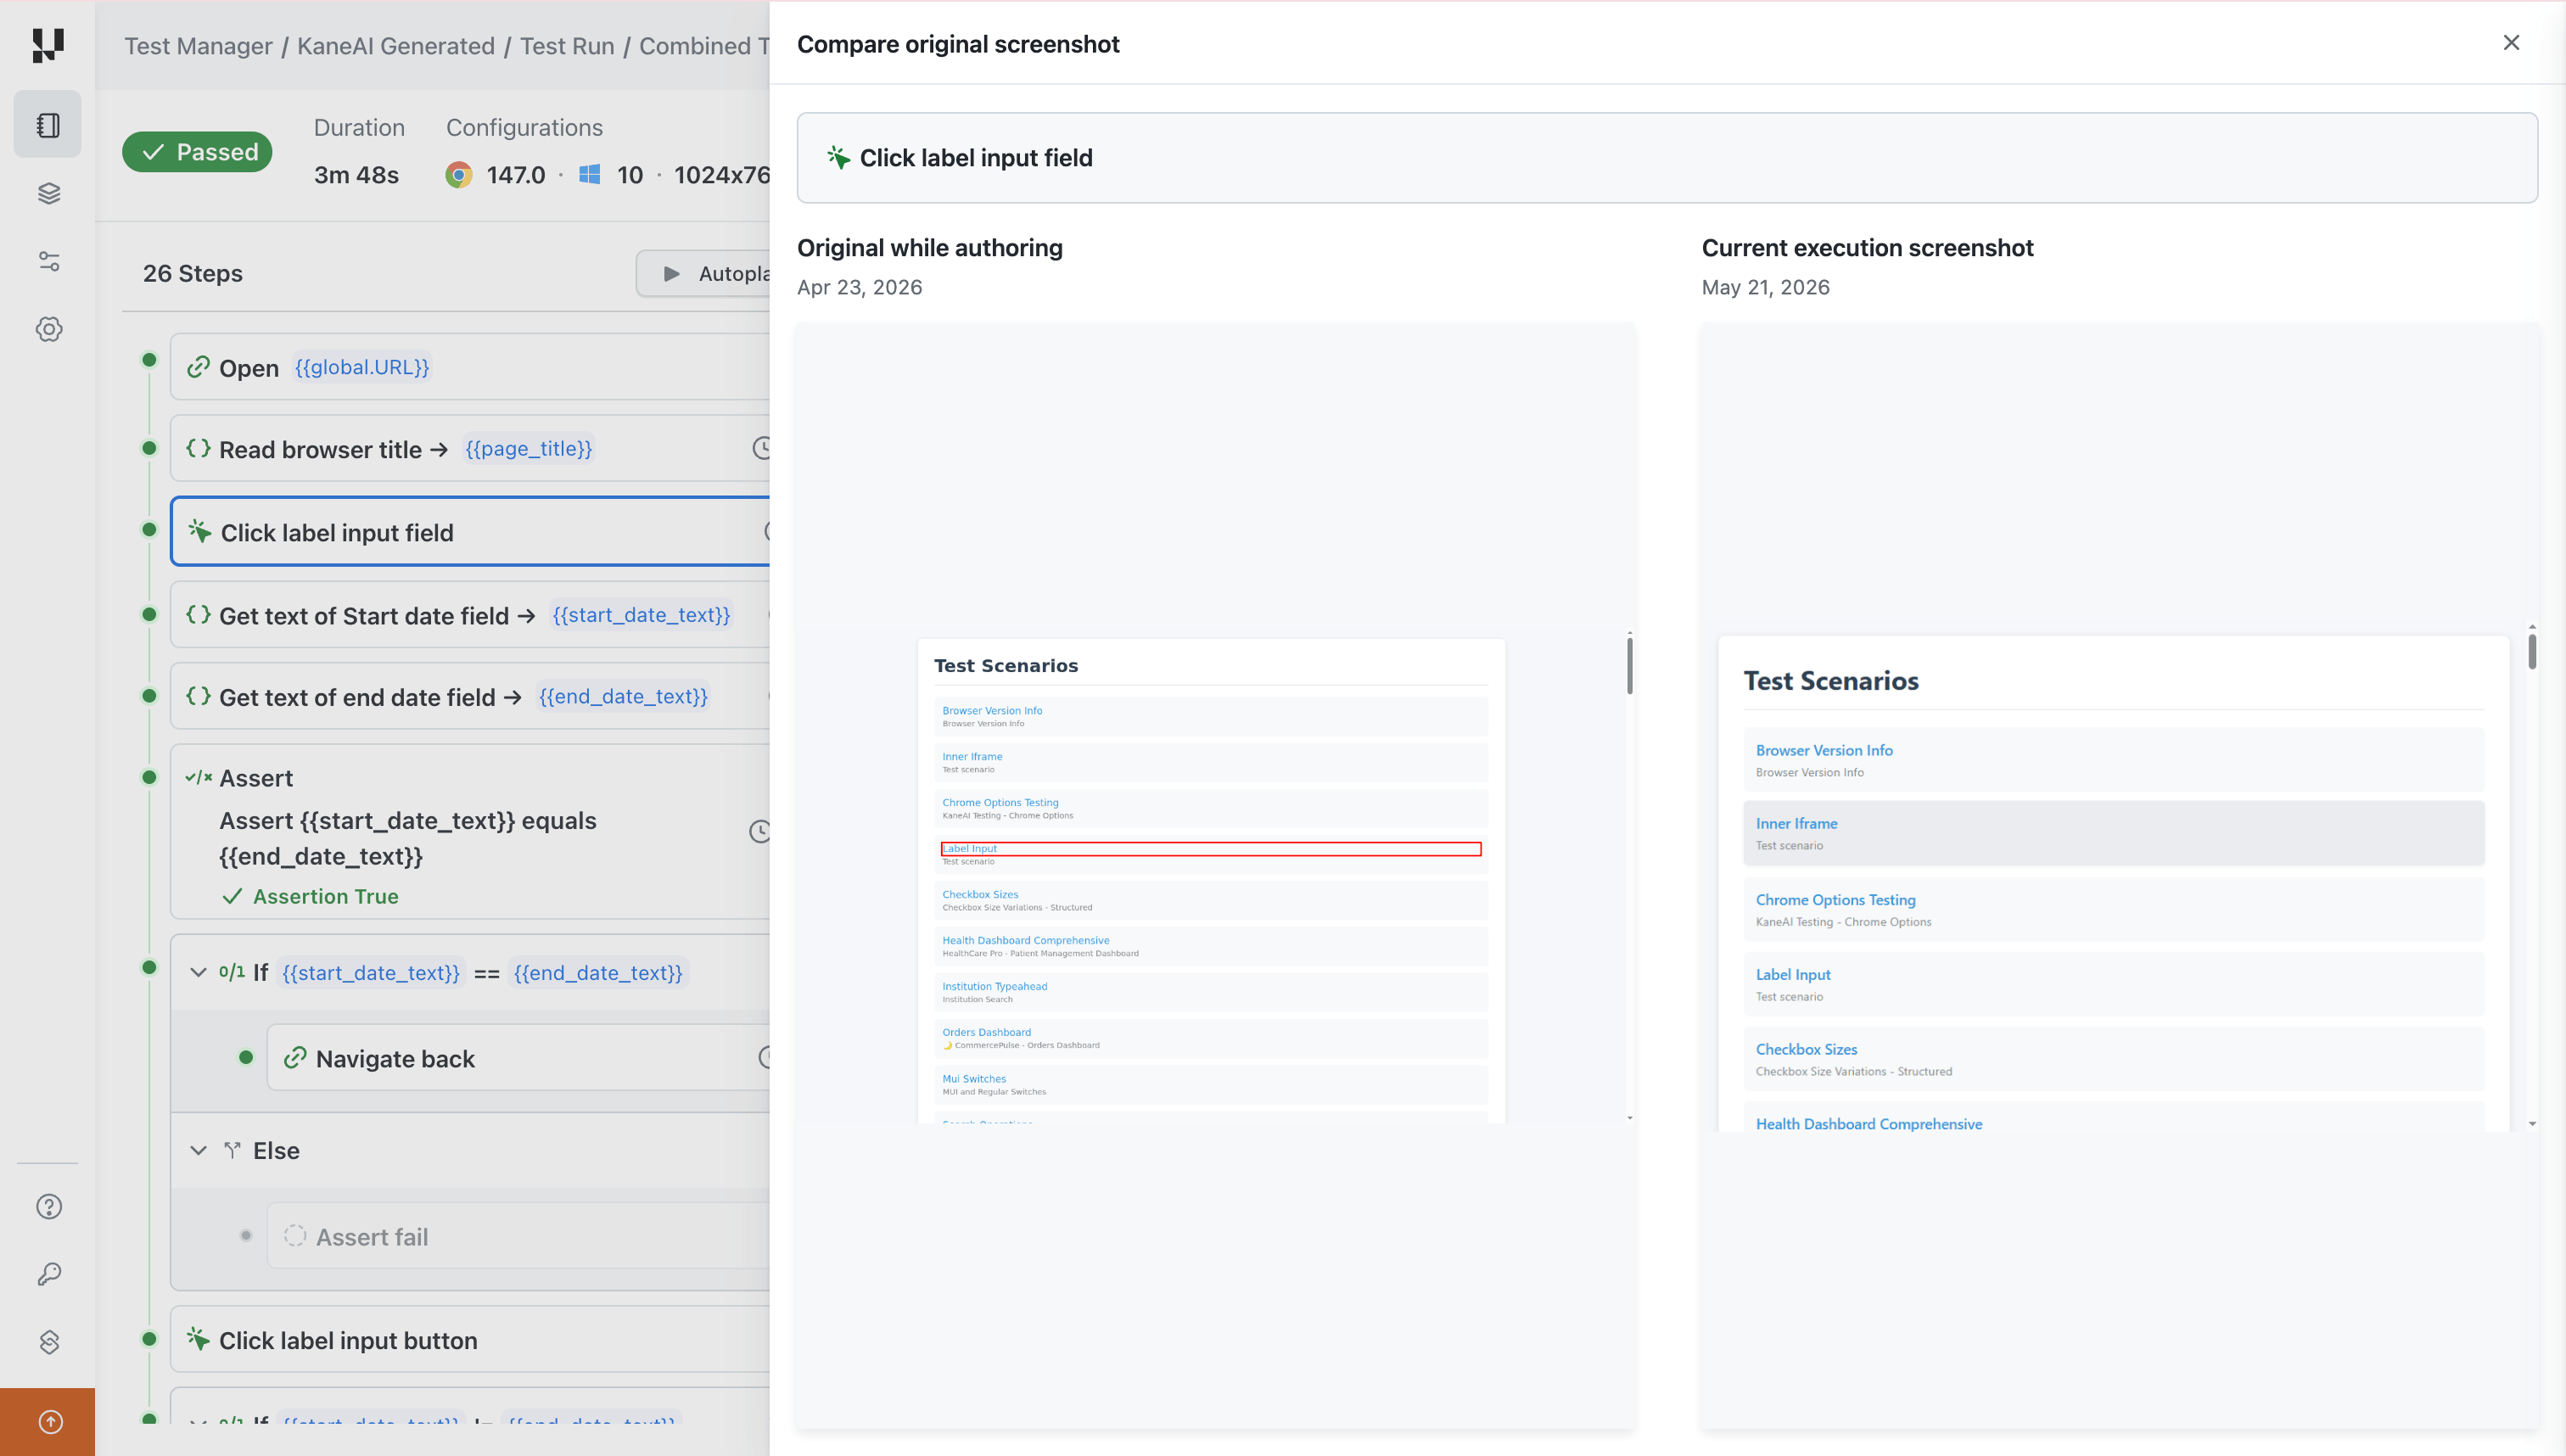
Click Compare original screenshot above the screenshot panel to open a side-by-side comparison of:
- Original while authoring - The screenshot captured when the test was first authored in KaneAI
- Current execution screenshot - The screenshot from this execution run
This helps you identify UI changes, layout shifts, or missing elements that may have caused a test failure - especially useful when a test that previously passed starts failing after a UI update.
Debugging Failed Tests
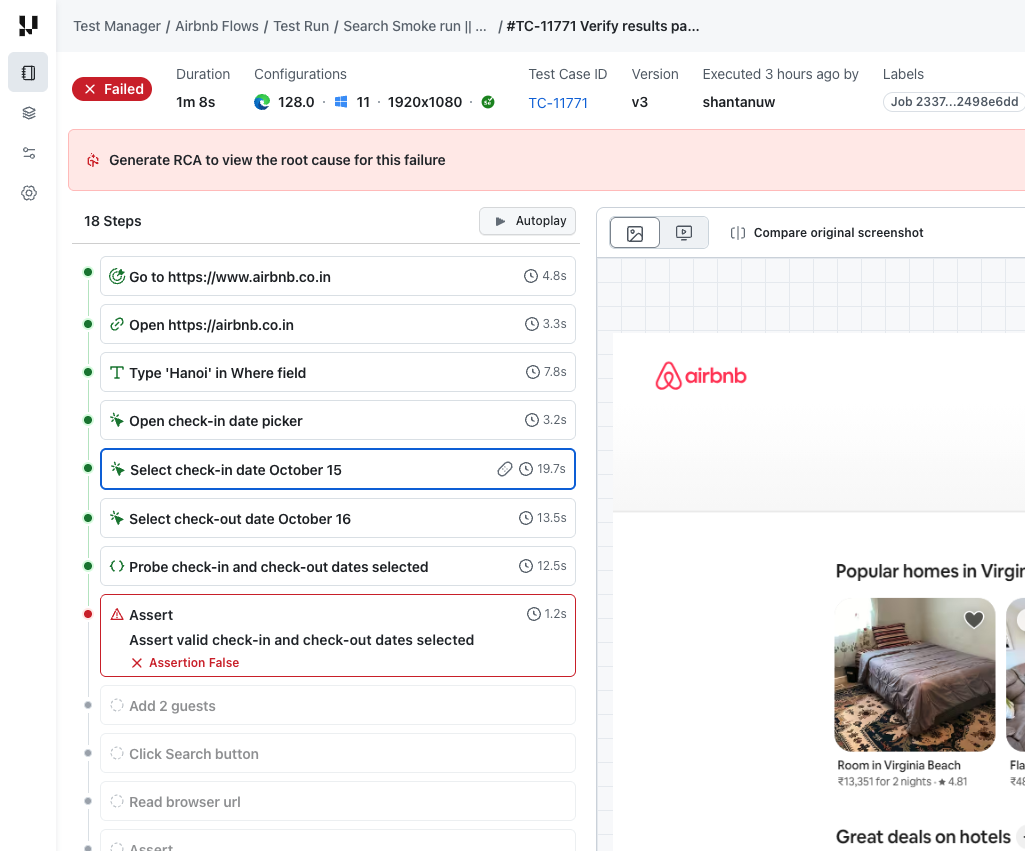
When a test instance fails, the view highlights the failure clearly so you can diagnose the issue quickly.
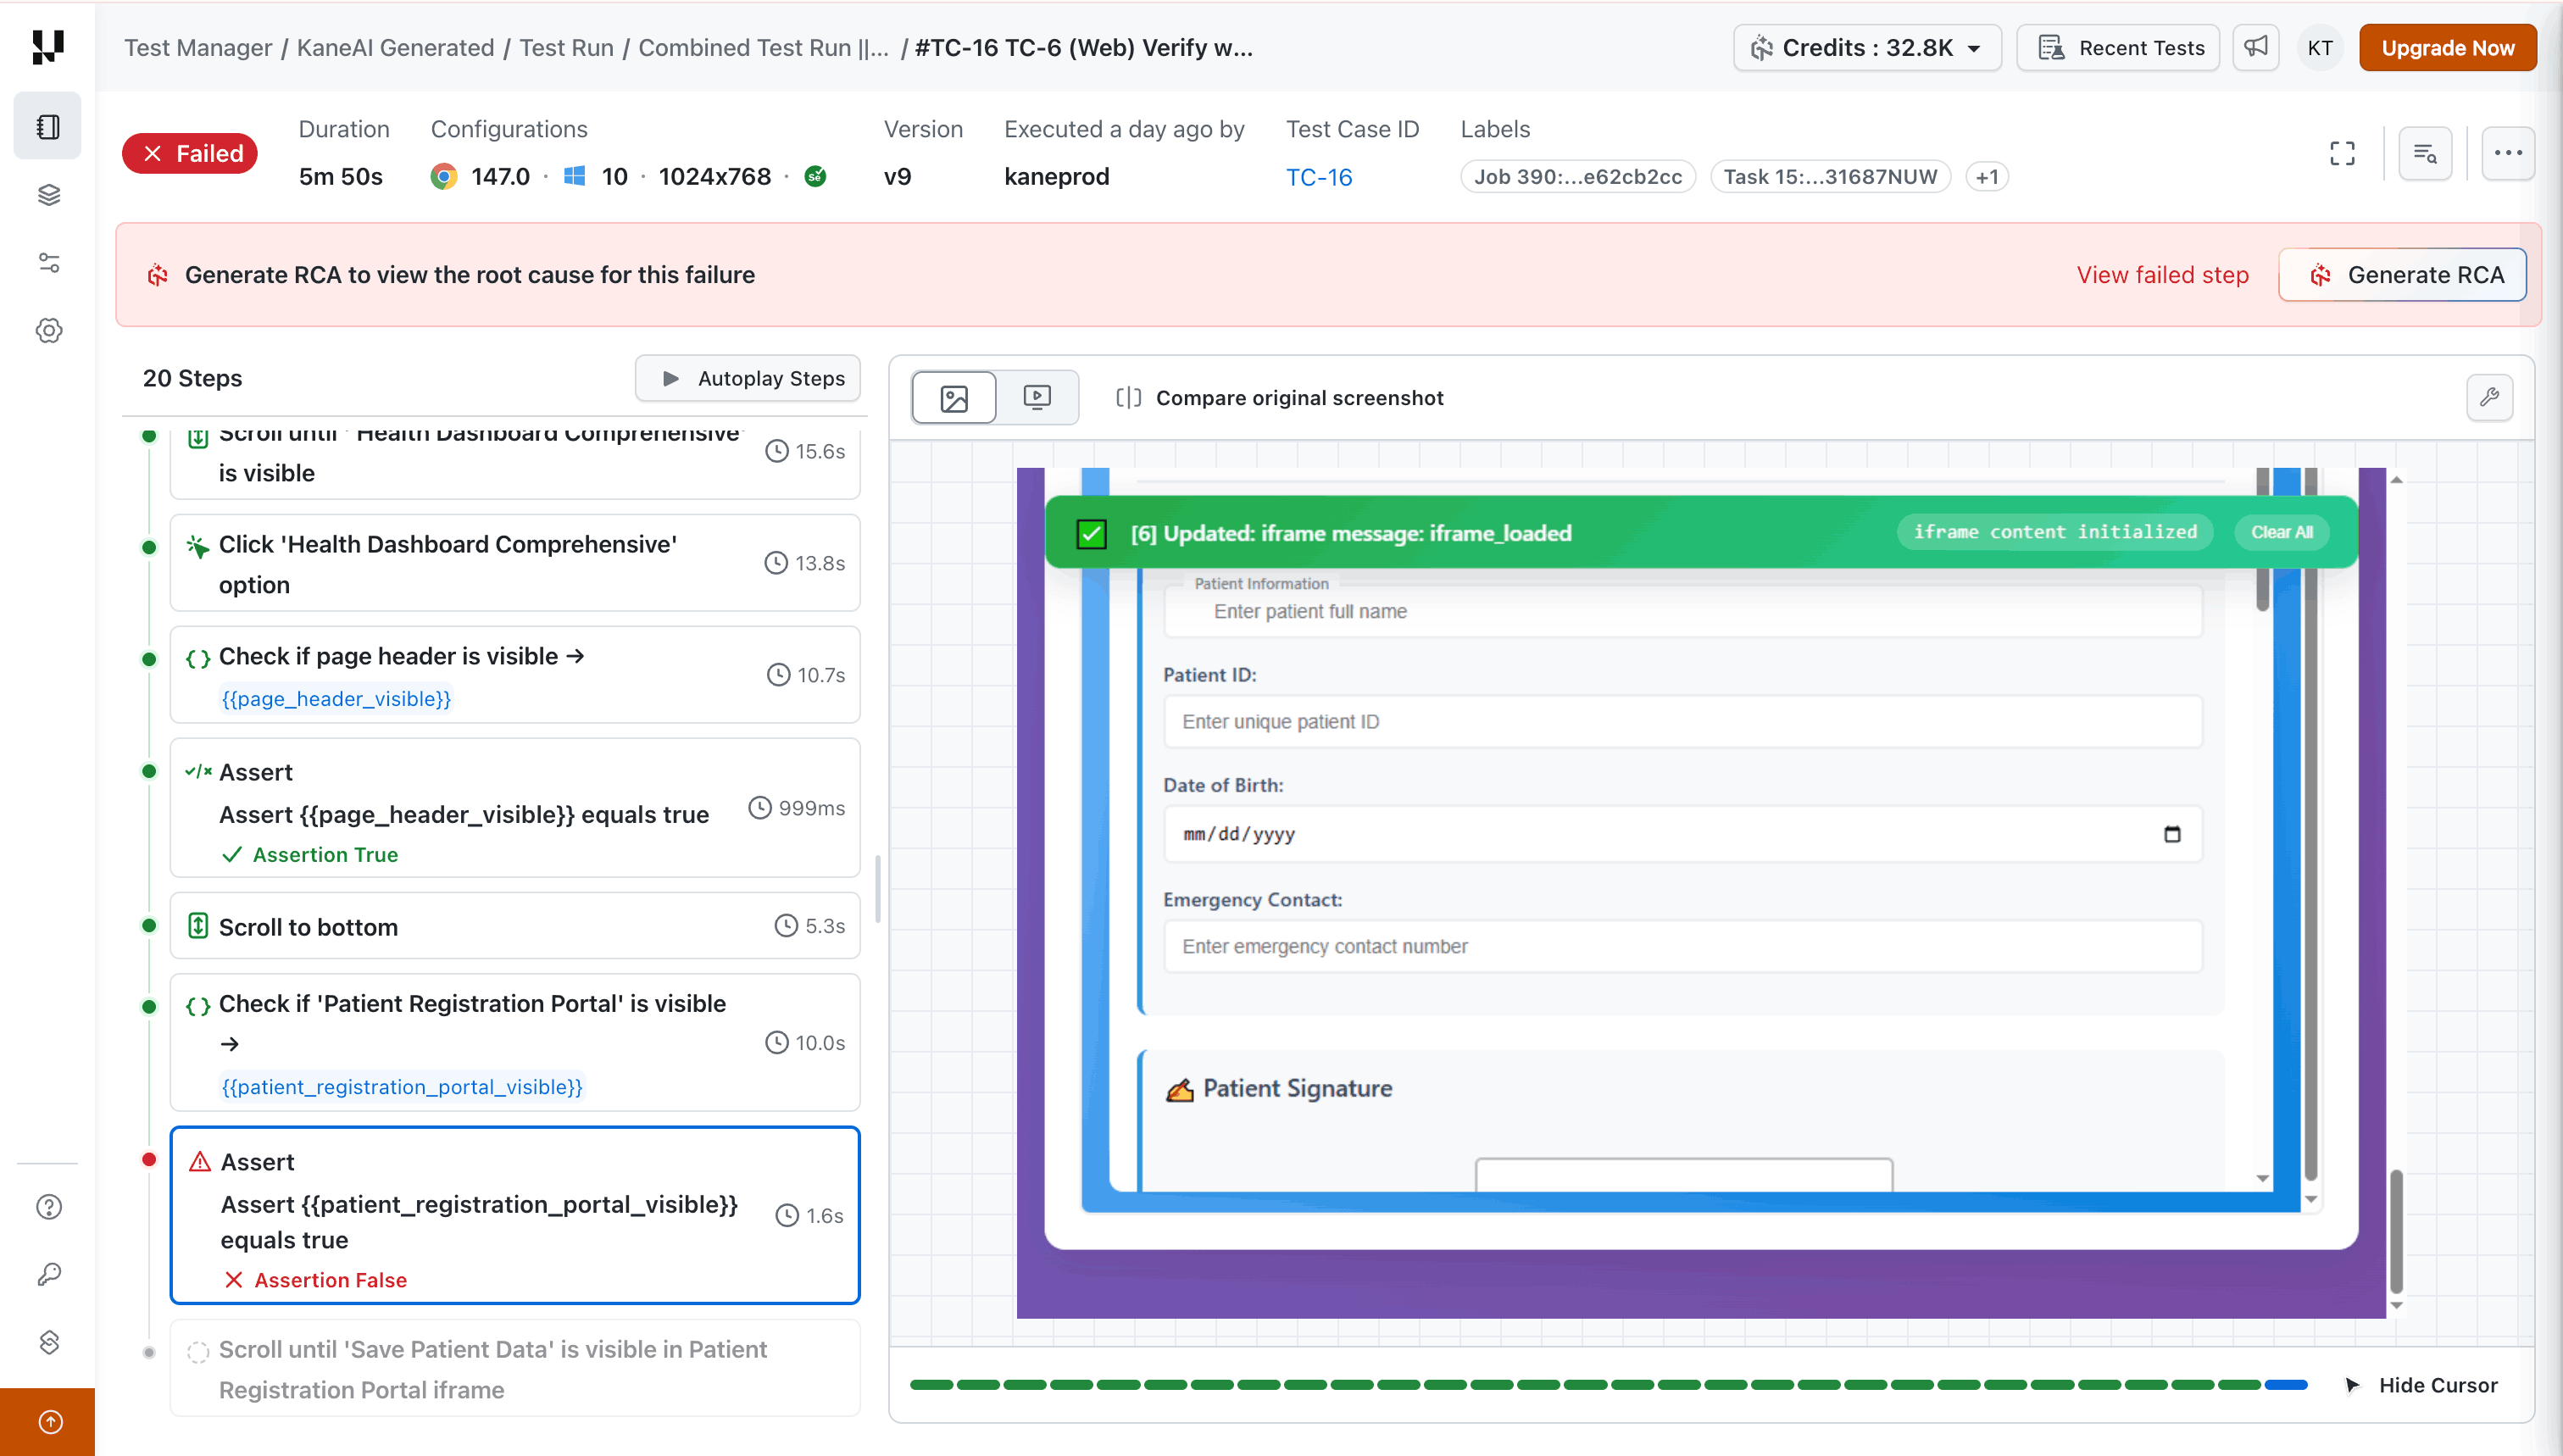
- The failed step is highlighted with a red border and shows the assertion result (e.g., "Assertion False").
- Steps after the failure are grayed out, indicating they were not executed.
- The screenshot panel shows the state of the application at the exact moment of failure.
- Click View failed step in the top banner to jump directly to the failure point.
- Click Generate RCA to trigger an AI-powered root cause analysis that examines the failure context and suggests probable causes.
Command Logs
Click the panel toggle on the right side to open the All Commands tab. This panel shows every low-level command that was executed during the test, grouped by step.
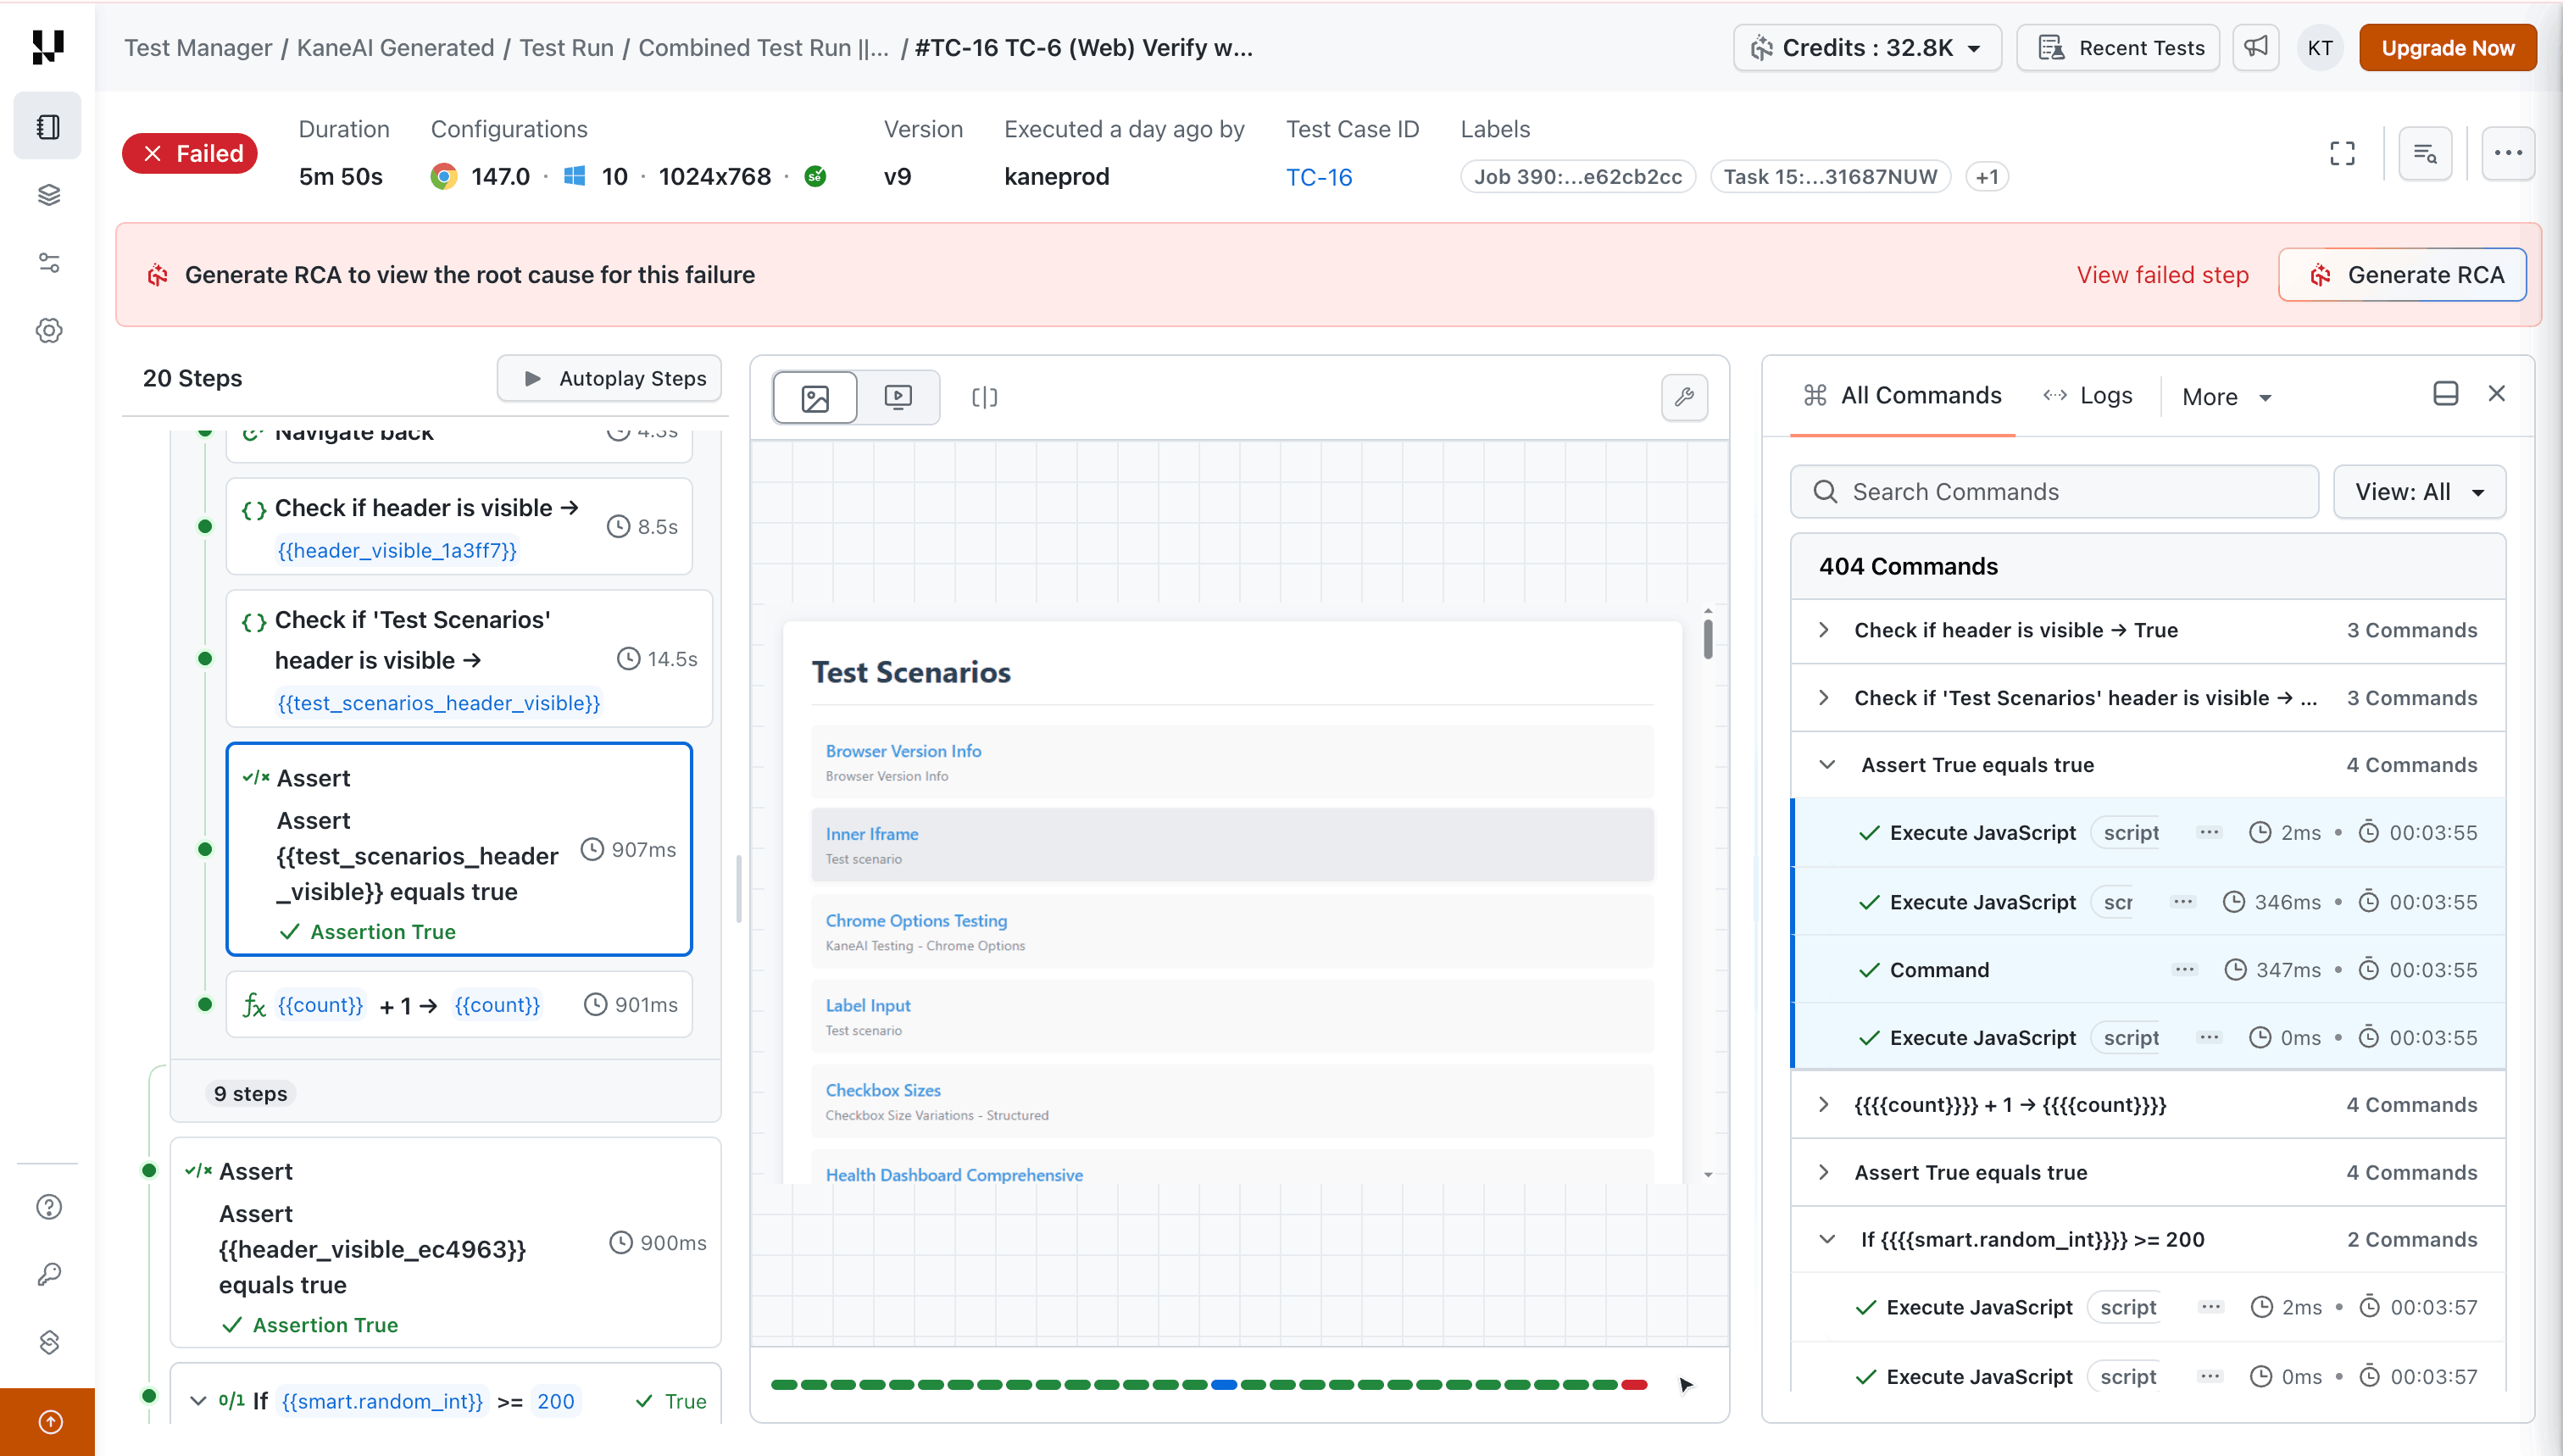
Each command group is expandable and shows:
- Command type - Execute JavaScript, Command, HTTP request, etc.
- Duration - Time taken for each individual command
- Timestamp - Exact execution time
- Script content - For JavaScript commands, the script that was executed
Use the Search Commands bar to find specific commands, or filter using the View dropdown to narrow by command type.
Execution Logs
The right panel provides multiple log tabs for in-depth debugging:
- Framework - Logs from the test framework used during execution
- Console - Browser console output captured during the test
- Device - Device-level logs (useful for mobile test instances)
- Network - Network request and response details
- HyperExecute - Raw HyperExecute execution logs including runtime information such as network idle times, DOM load events, and script execution output
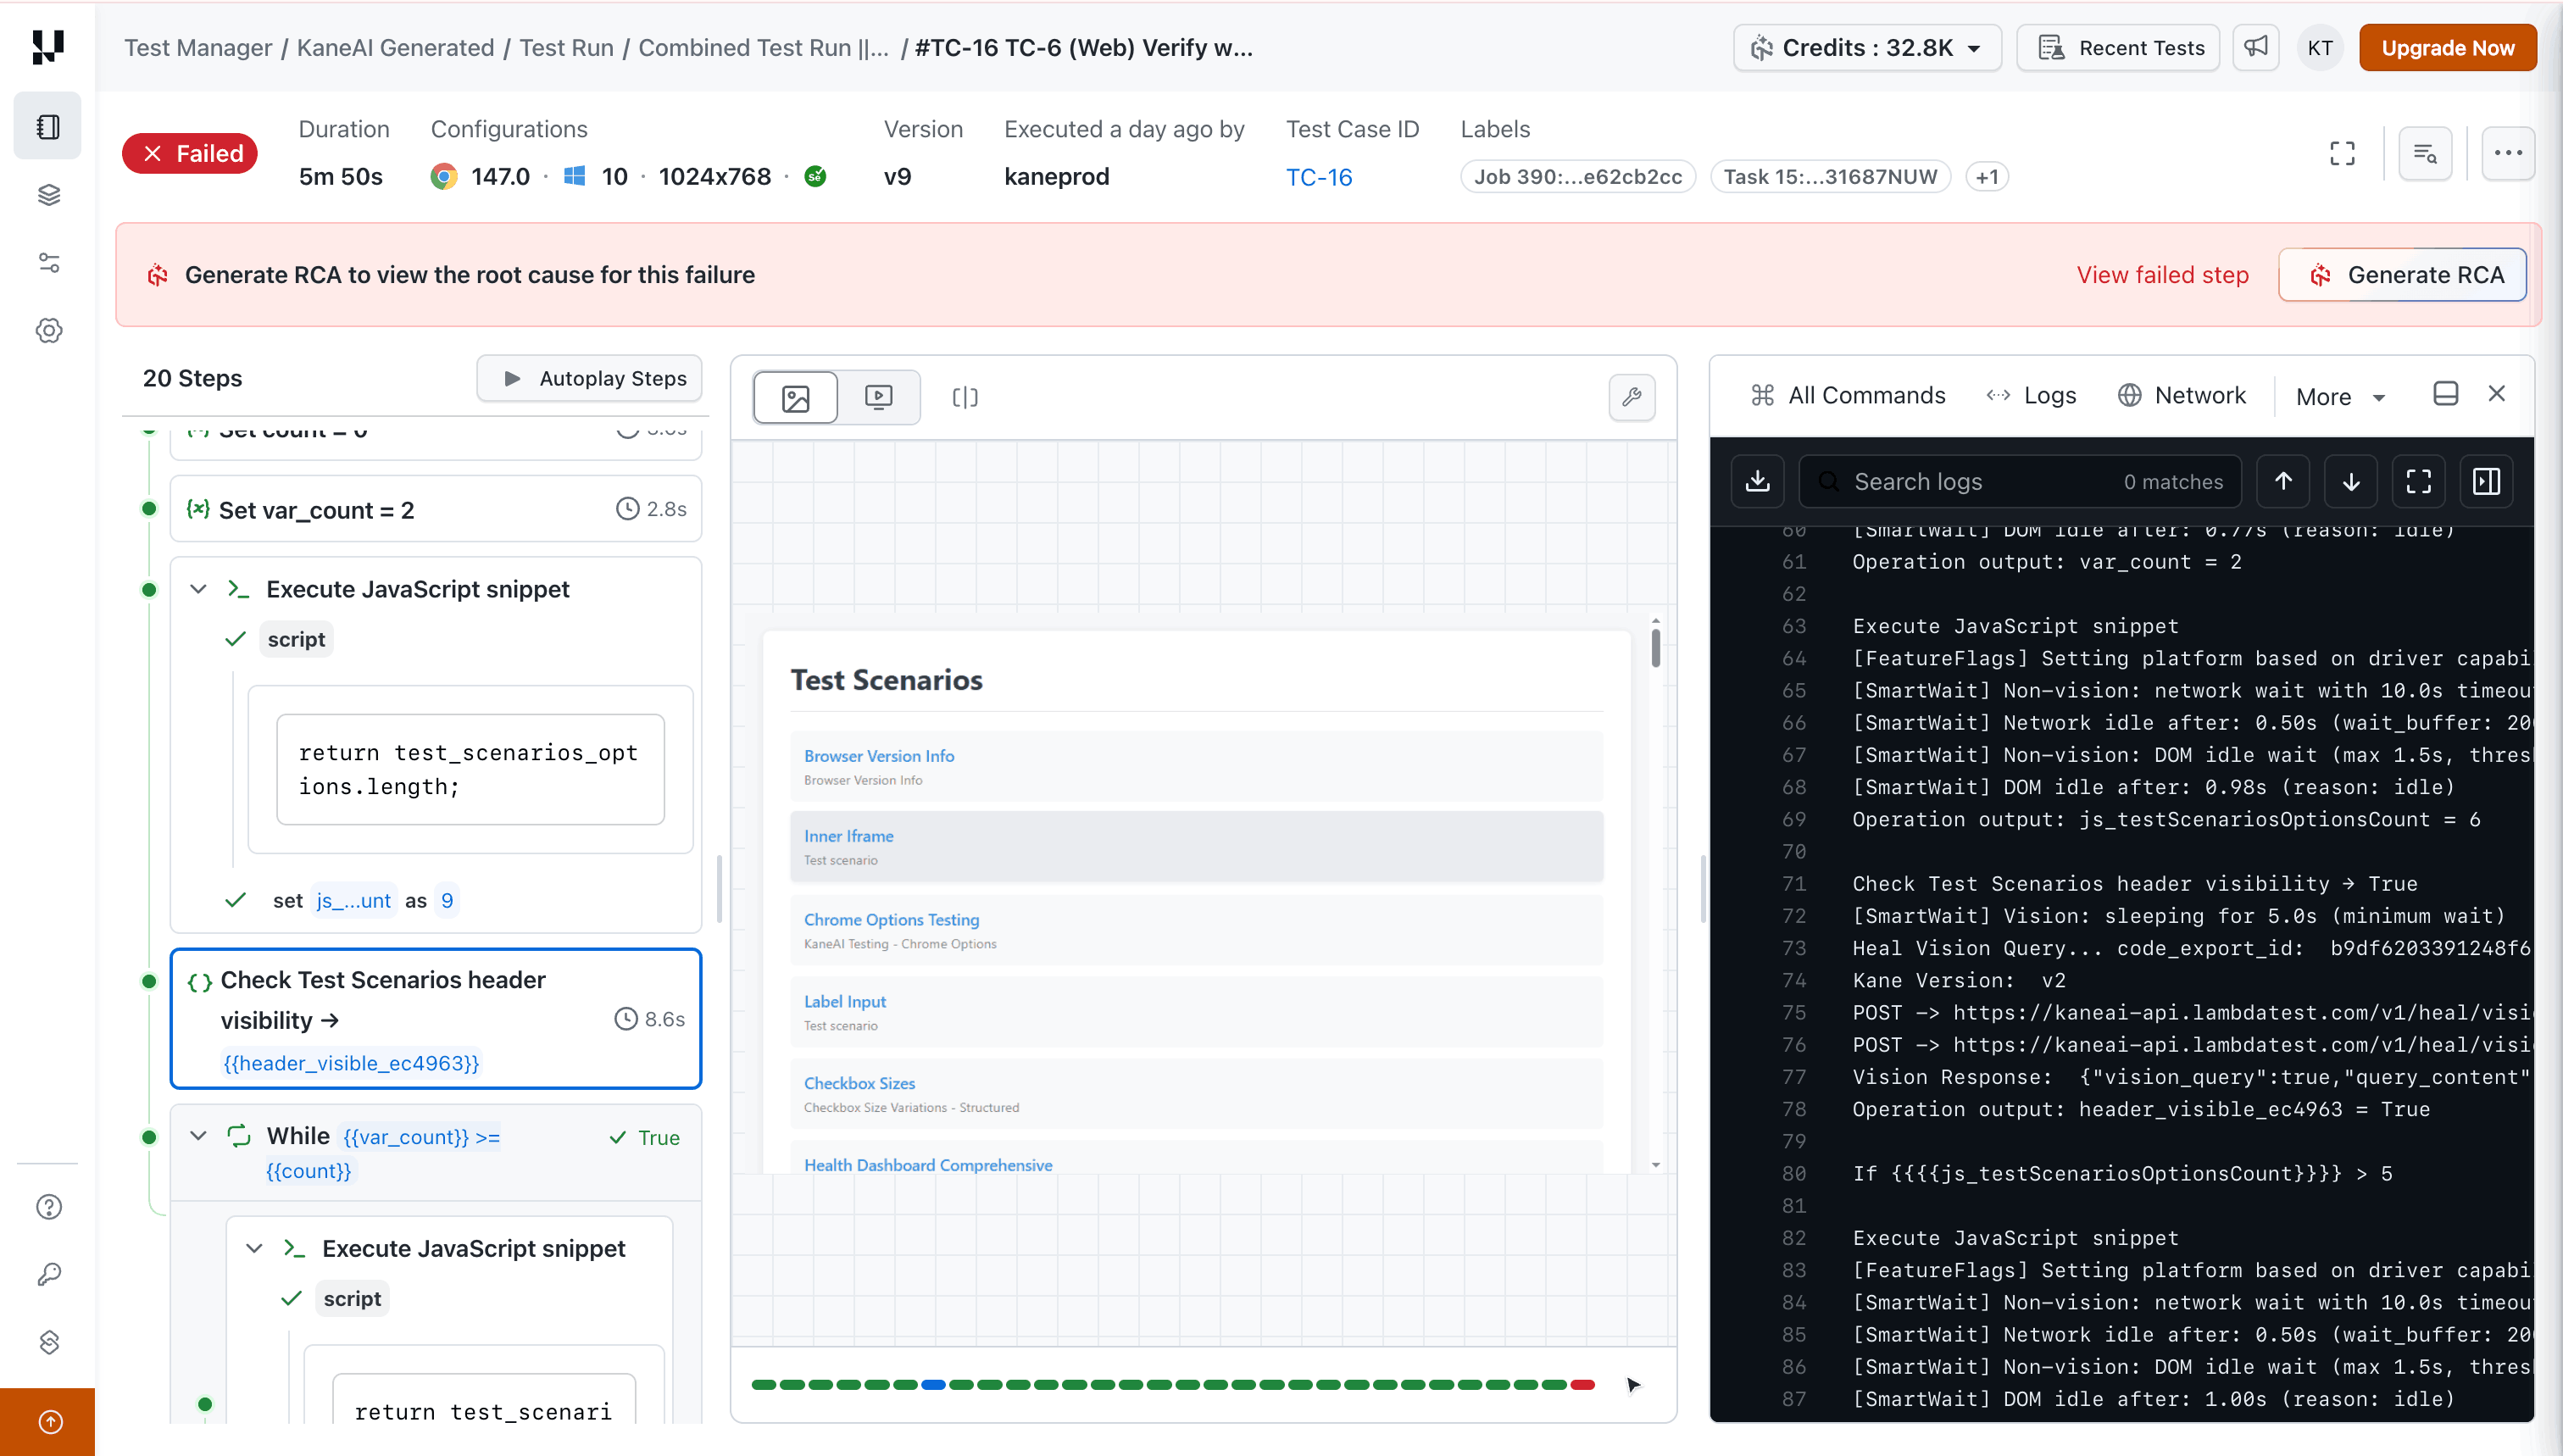
Additionally, the following tabs are available for extended analysis:
- SmartUI - Visual regression testing results
- Performance - Performance metrics captured during execution
- Accessibility - Accessibility audit results for the tested pages
You can dock the logs panel to the right or bottom of the screen depending on your preference.
Navigate Between Tests
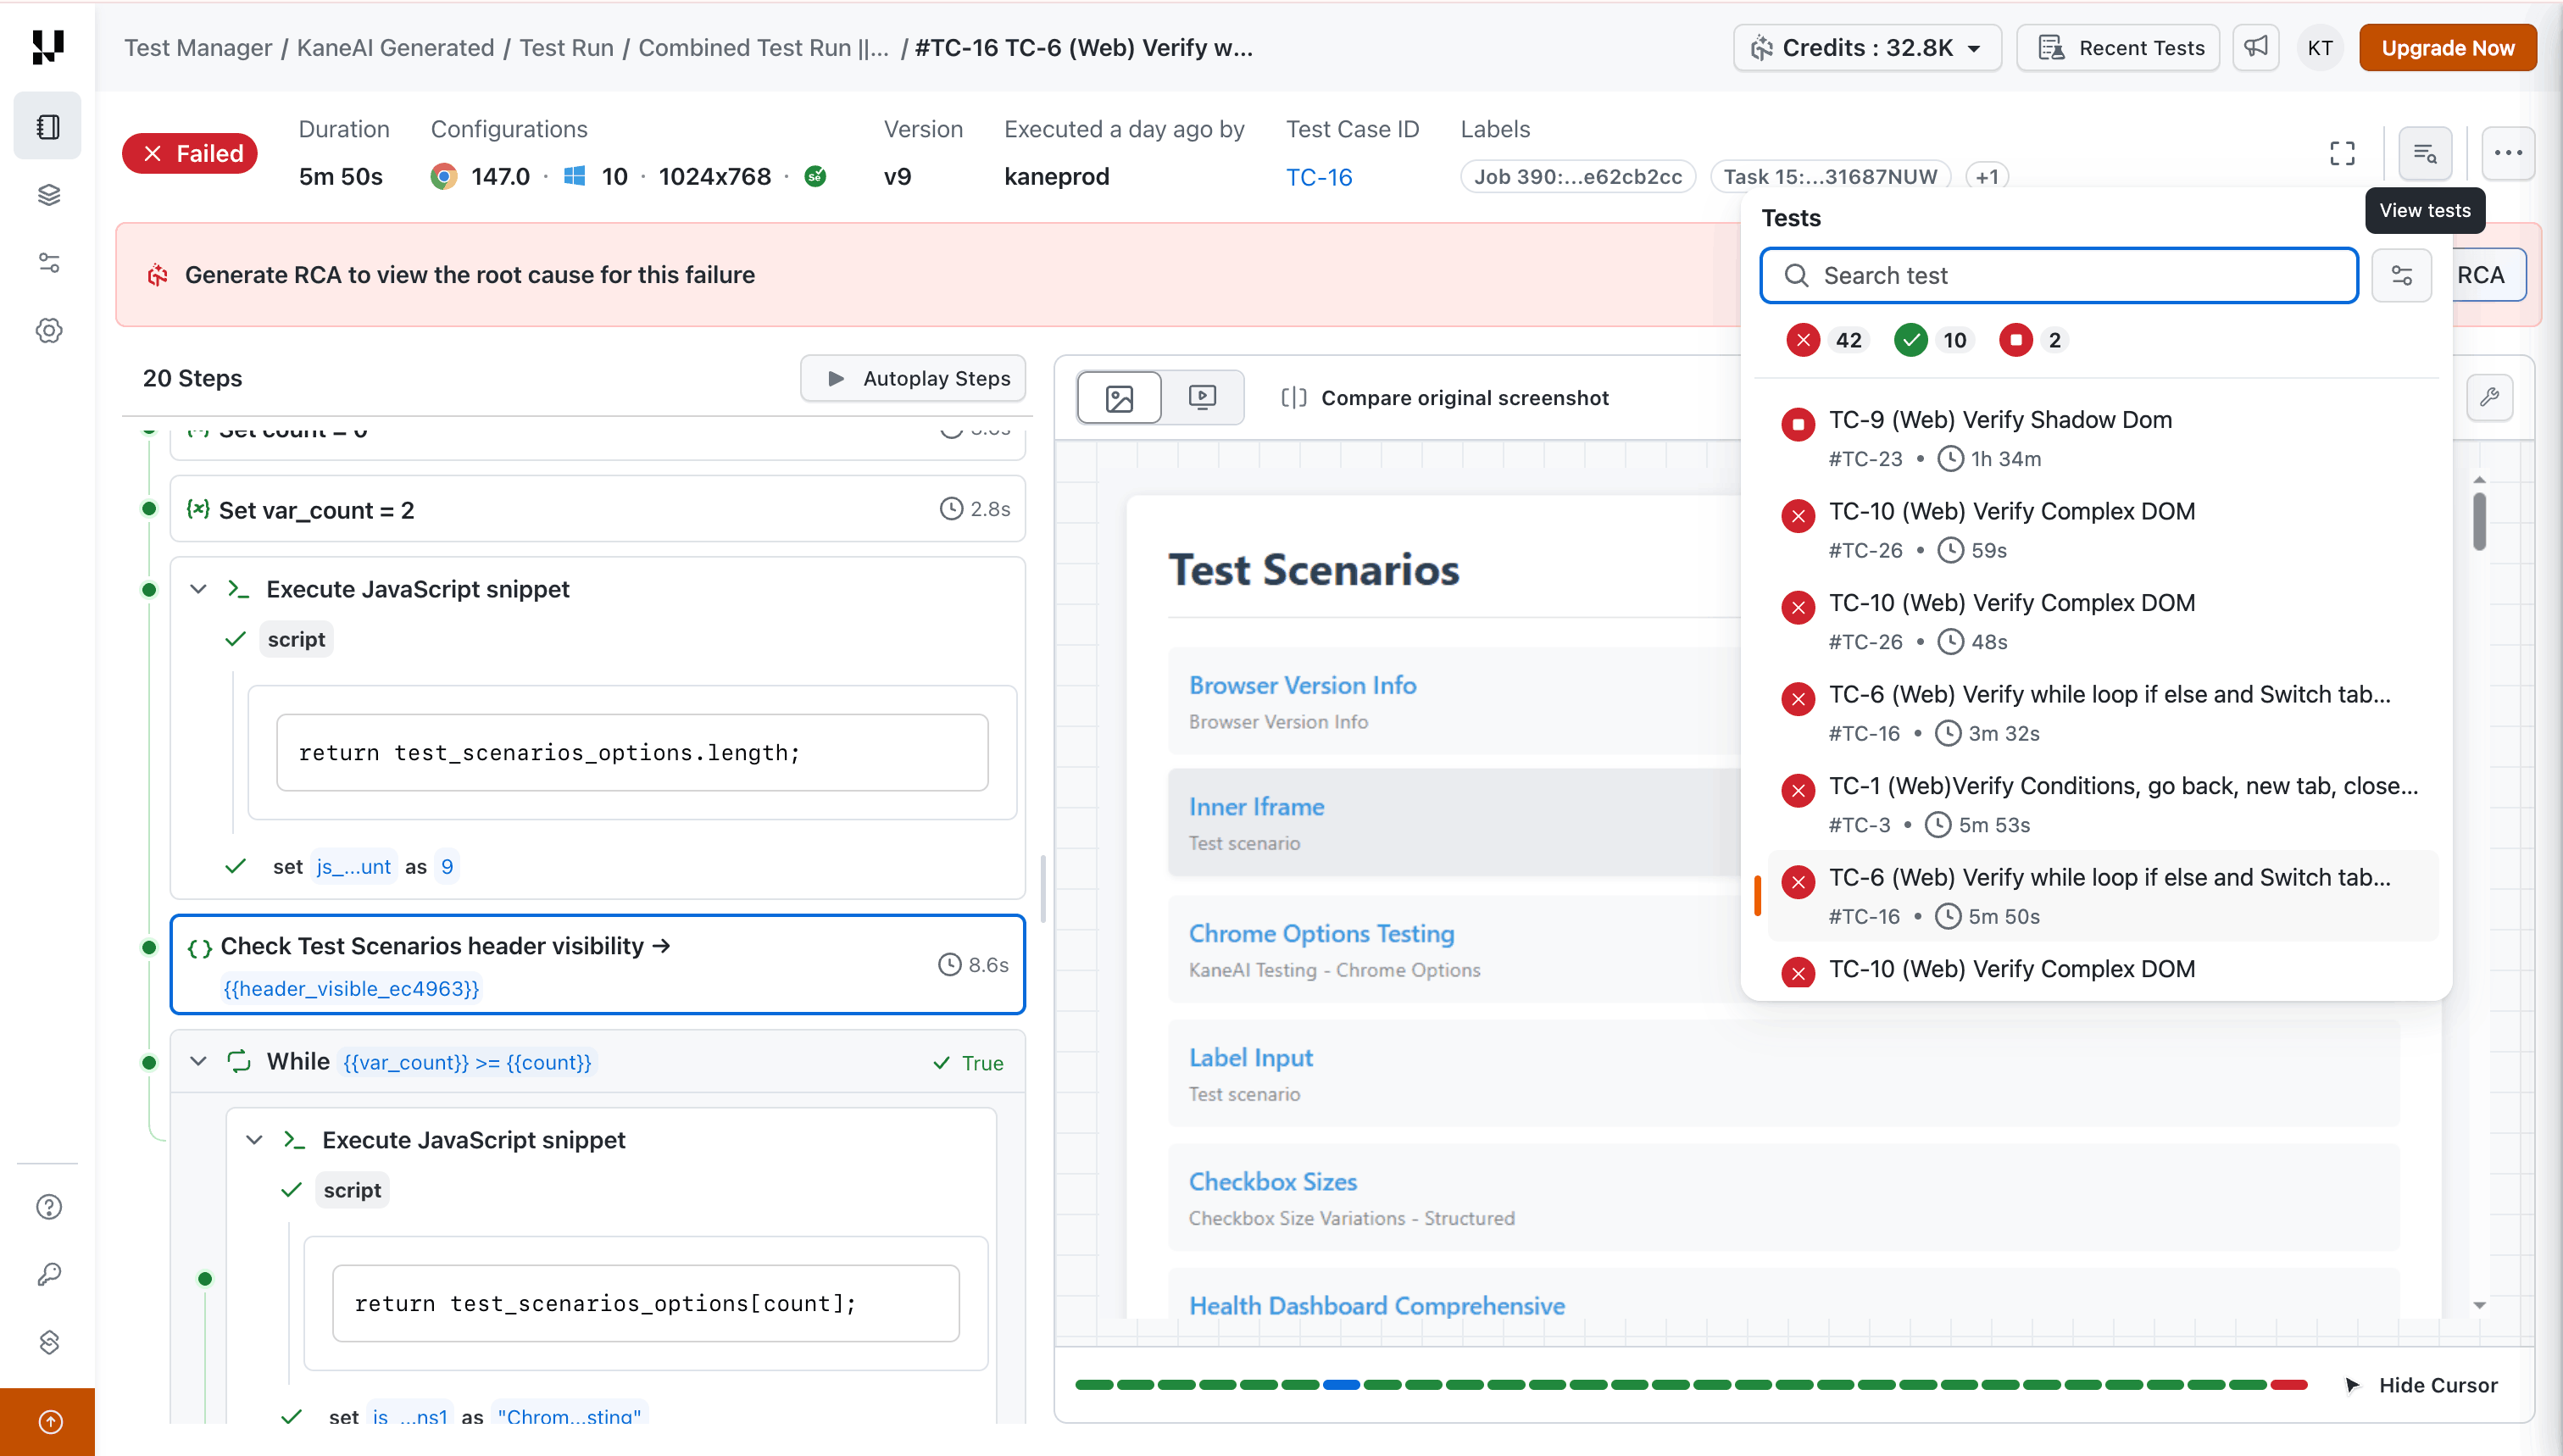
Click the View tests button in the top-right corner to open a panel listing all test instances in the current test run. This panel lets you:
- Search for specific tests by name
- Filter by status - view only failed, passed, or stopped tests
- Switch between tests without navigating back to the test run listing
Share a Test Run Instance
You can share a test run instance page publicly with stakeholders, including people who do not have a TestMu AI account. Click the Share icon in the top-right corner of the instance view to open the share dialog.
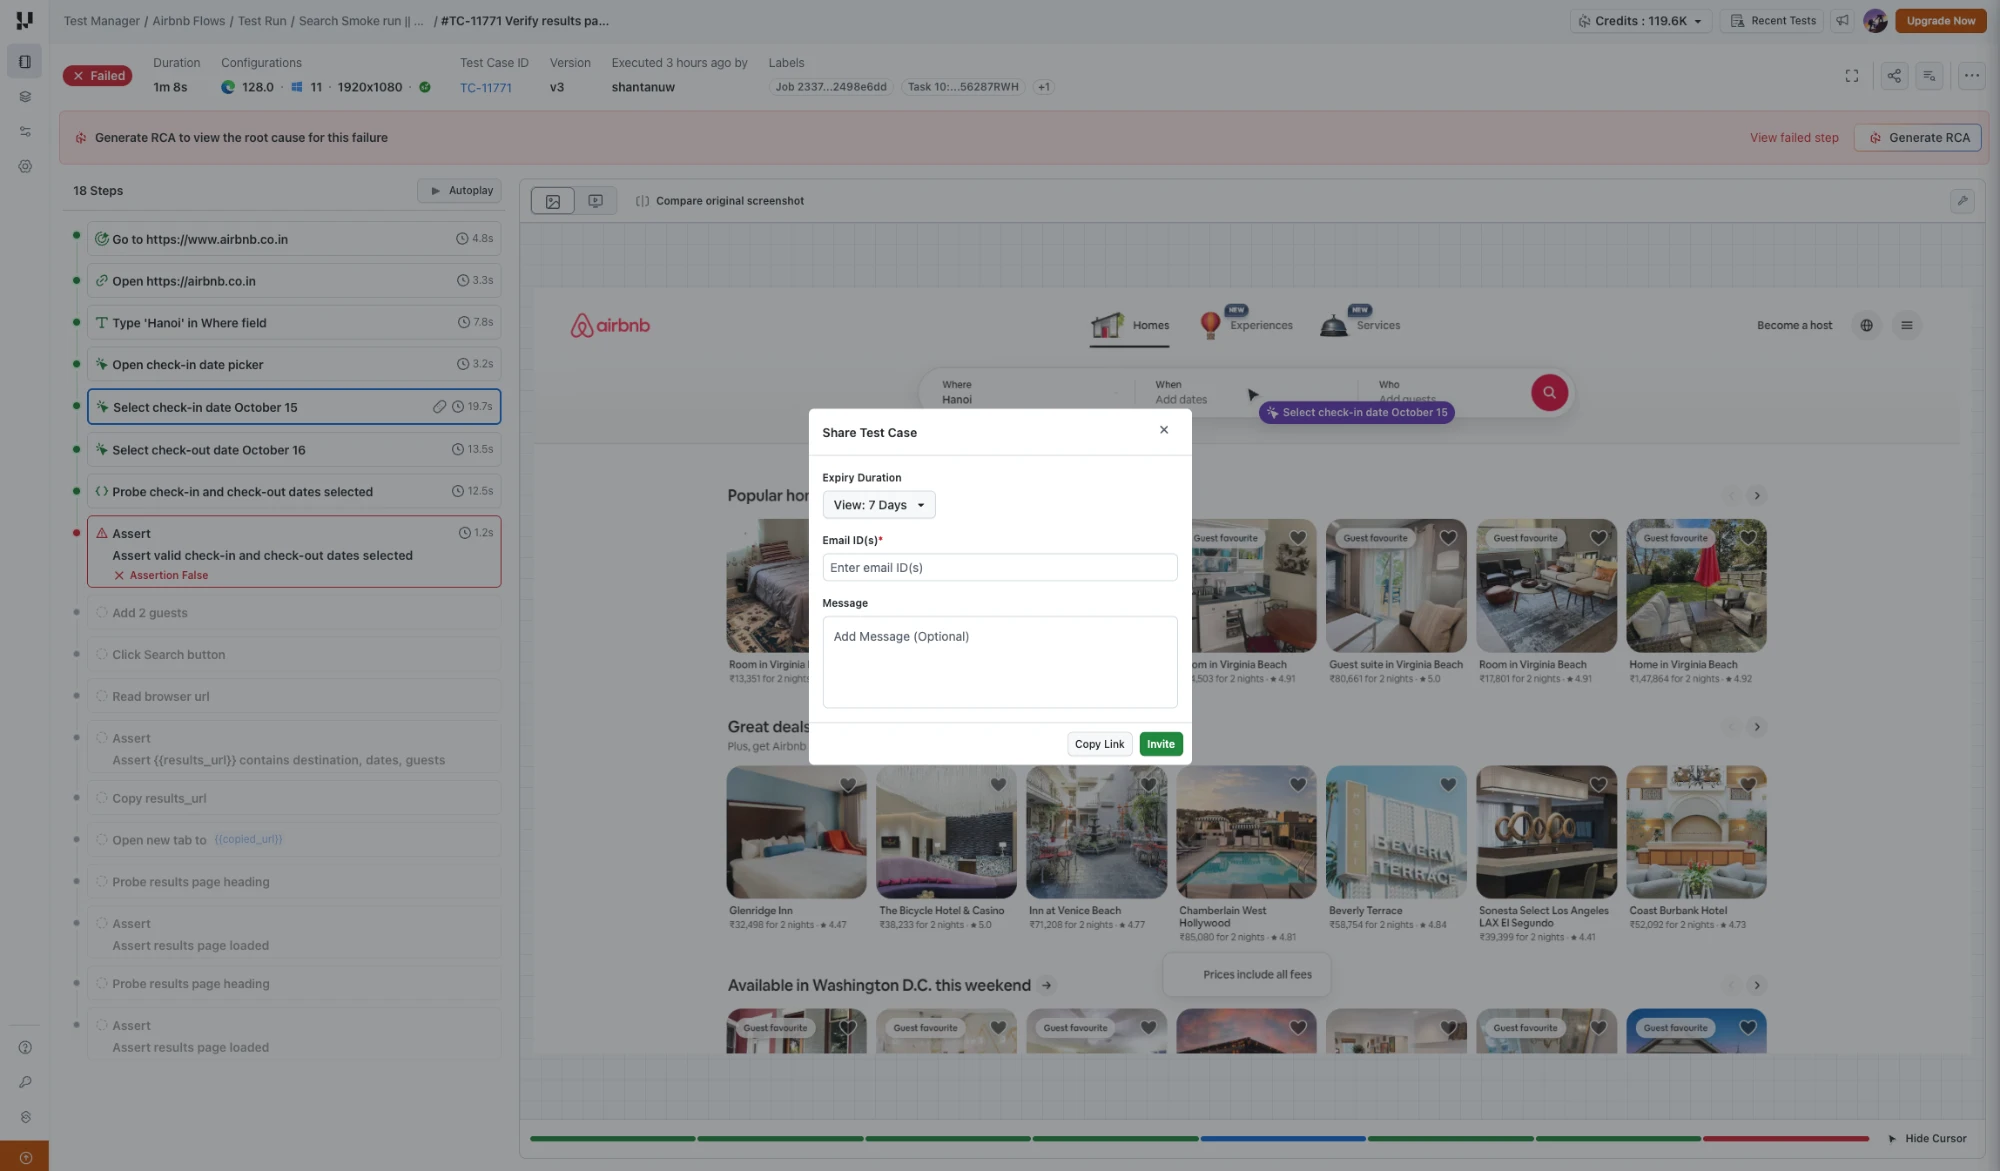
The share dialog provides the following options:
- Expiry Duration - Choose how long the shared link remains accessible (for example, View: 7 Days). After the link expires, it can no longer be opened.
- Email ID(s) - Enter one or more email addresses and click Invite to send the link directly, with an optional Message for context.
- Copy Link - Copy a shareable link to the clipboard and distribute it yourself.
Anyone with an active shared link can view the test run instance (including the steps, screenshots, and execution details) until the link expires.
Evidence Reporting
When a test run executes with the Evidence Reporting mode, the run is sealed into an evidence pack: the steps, screenshots, logs, verdict, and AI failure analysis for every test instance. Opening the run shows the Evidence Report instead of the Classic view.
Evidence Reporting is available when every test case in the run is authored with New Experience and the run executes on Chrome. See Evidence Reporting to set up and start such a run.
Open a Run's Evidence
Go to Test Manager, select your project, and open Test Runs. Click a run that was executed with Evidence Reporting.
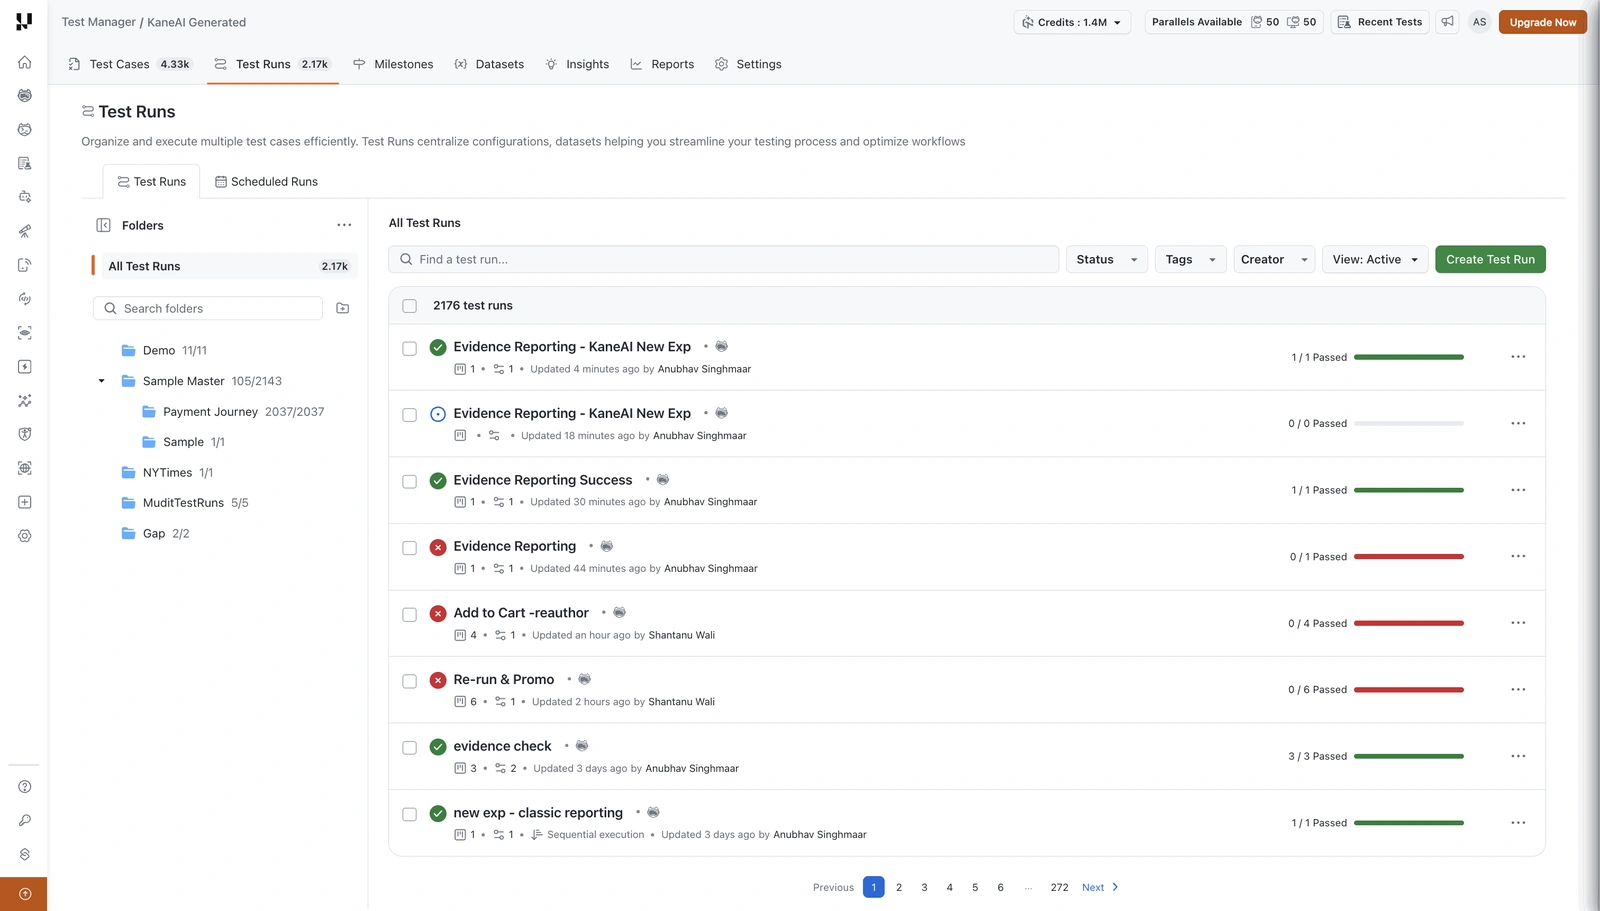
The run's evidence pack opens in your browser. The loading screen shows each stage as it completes: opening the evidence pack, preparing your evidence, and reading the failure analysis. Click Abort to stop loading.
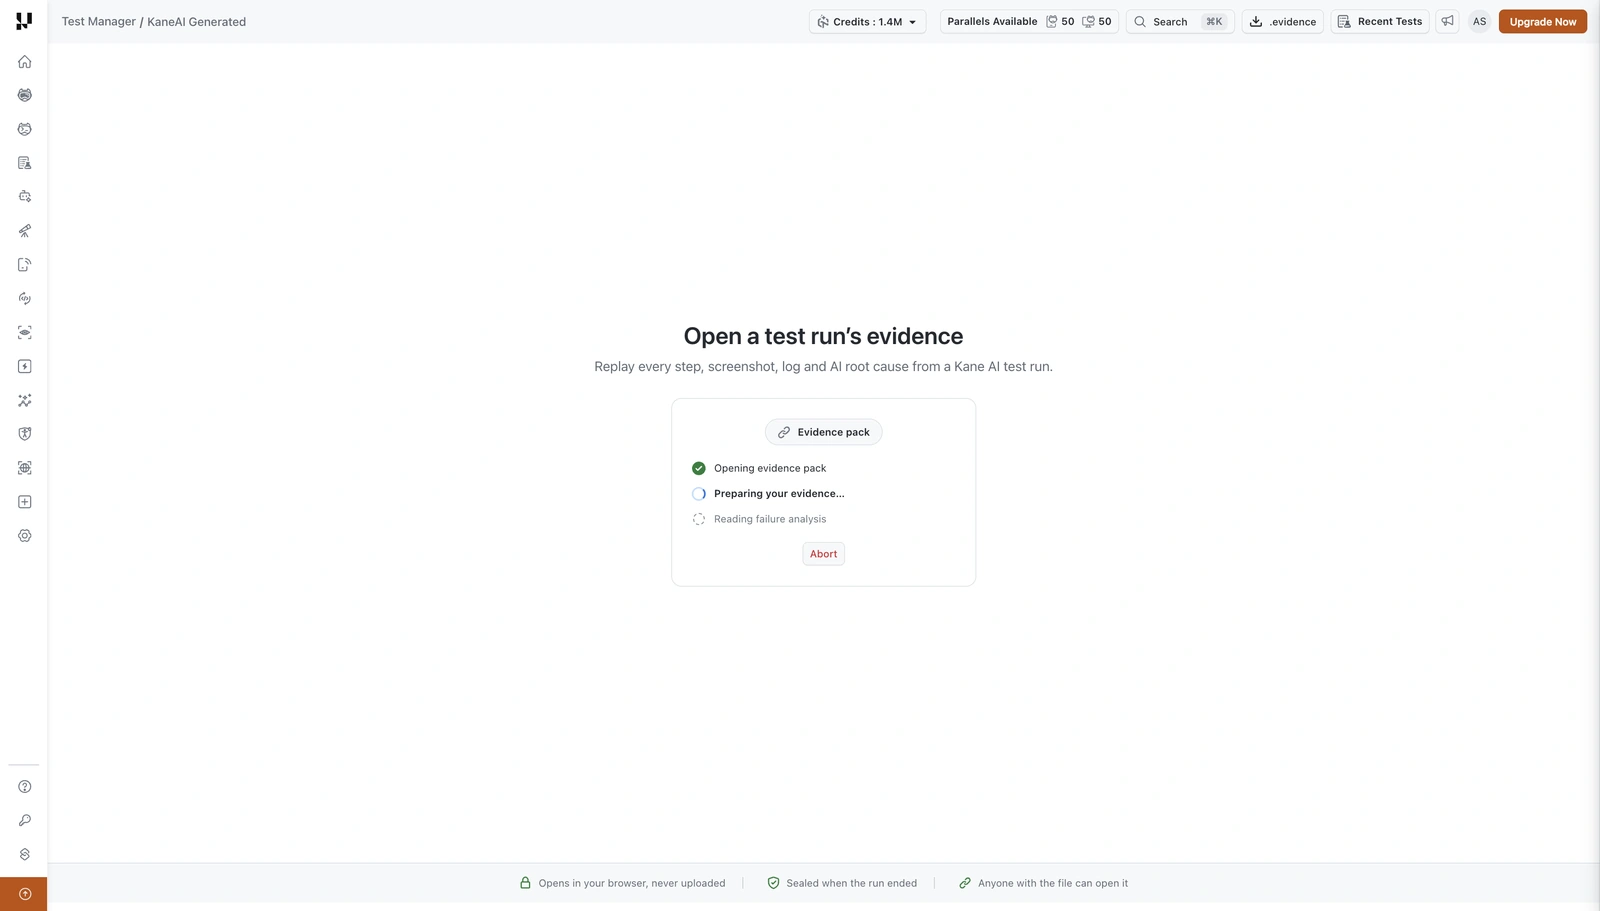
The evidence pack is sealed when the run ends, and it opens in your browser without being uploaded. To keep a copy, click .evidence in the top bar to download the pack. Anyone with the file can open it.
The Evidence Report has four tabs: Report, Test Instances, Issues, and Coverage.
Report
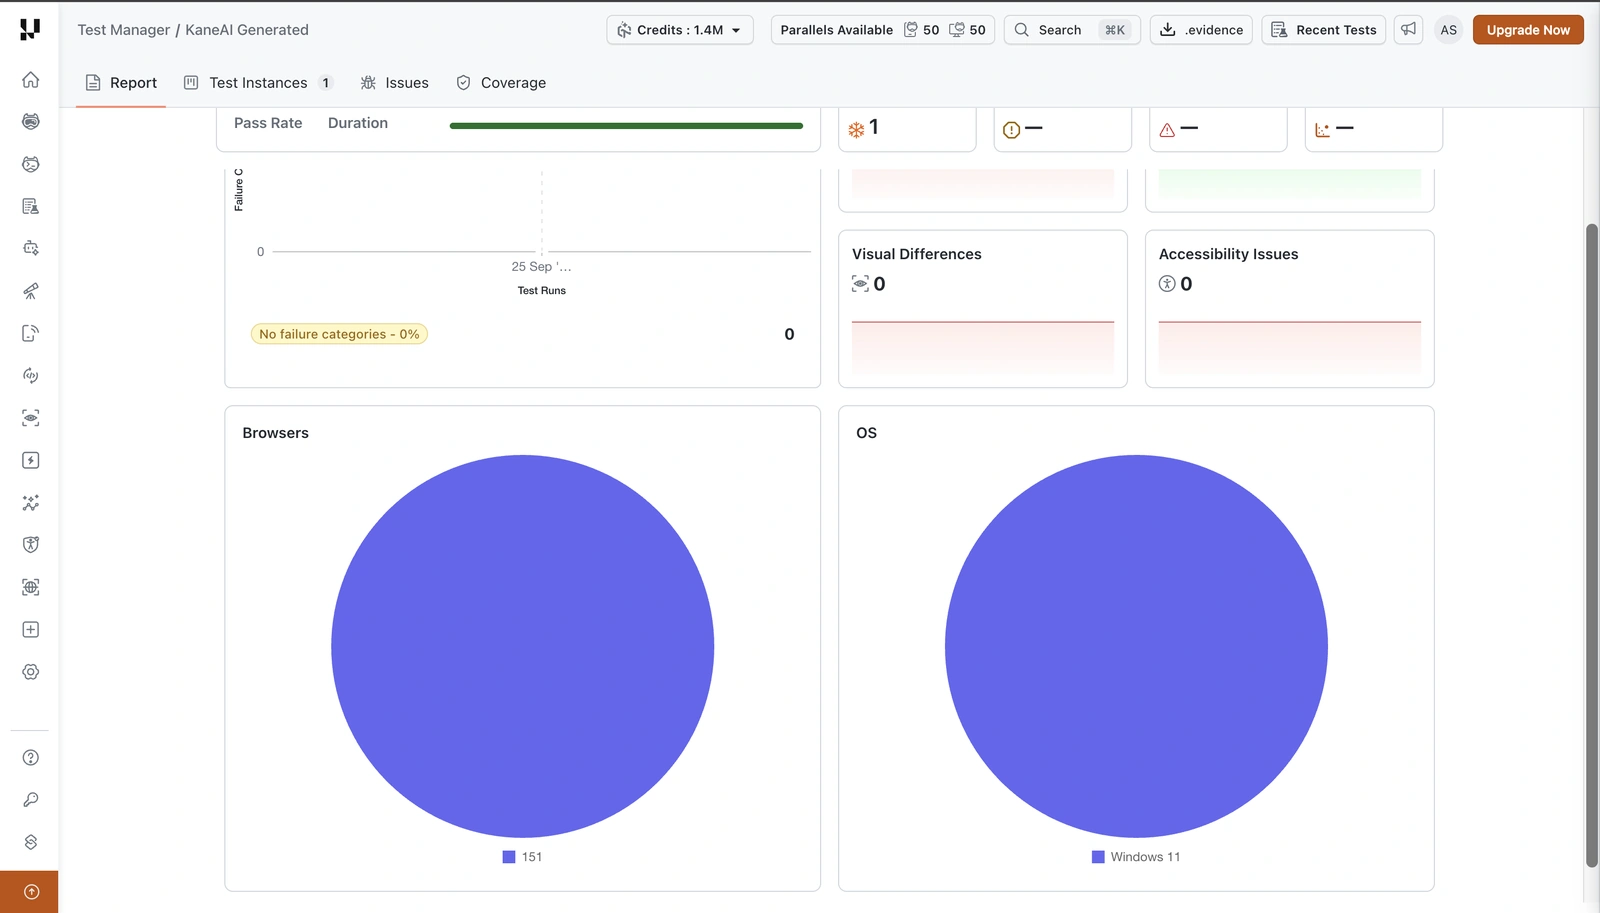
The Report tab summarizes the whole run.
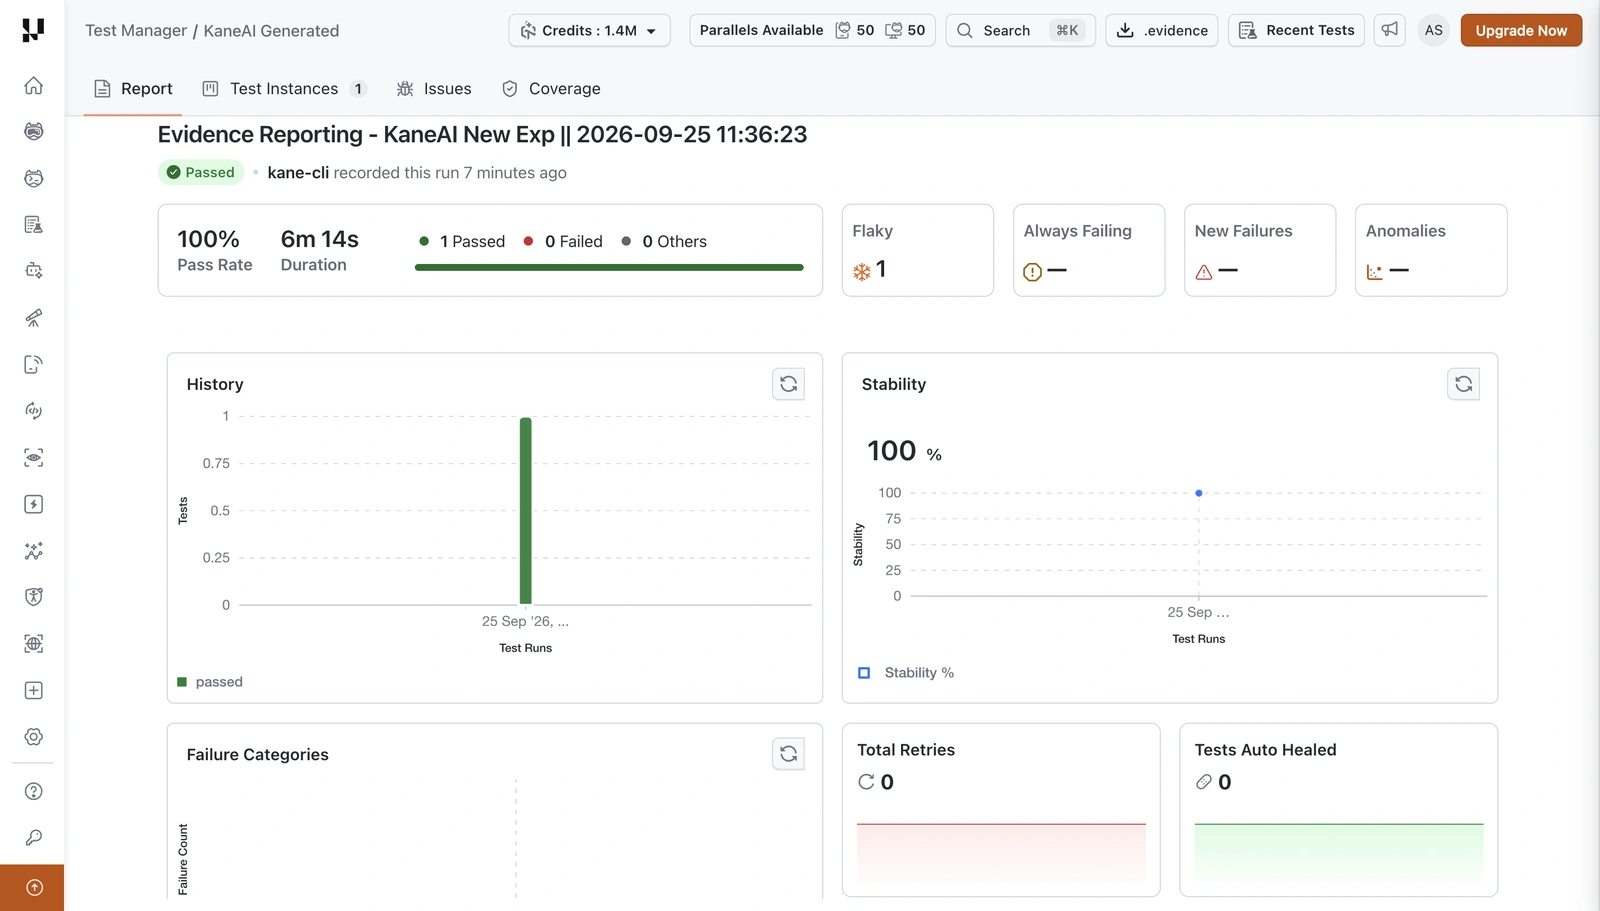
- Run header - The run name with its execution time, the run status (for example, Passed), and when the run was recorded.
- Summary - The pass rate, the total duration, and the number of tests that passed, failed, or ended with another status.
- Flaky, Always Failing, New Failures, and Anomalies - Counts of tests that need a closer look.
- History and Stability - Results and stability across runs of this test run.
- Failure Categories - Failures grouped by category.
- Total Retries and Tests Auto Healed - How many retries ran, and how many tests Auto-Heal recovered.
Scroll down for Visual Differences, Accessibility Issues, and the Browsers and OS the run covered.
Test Instances
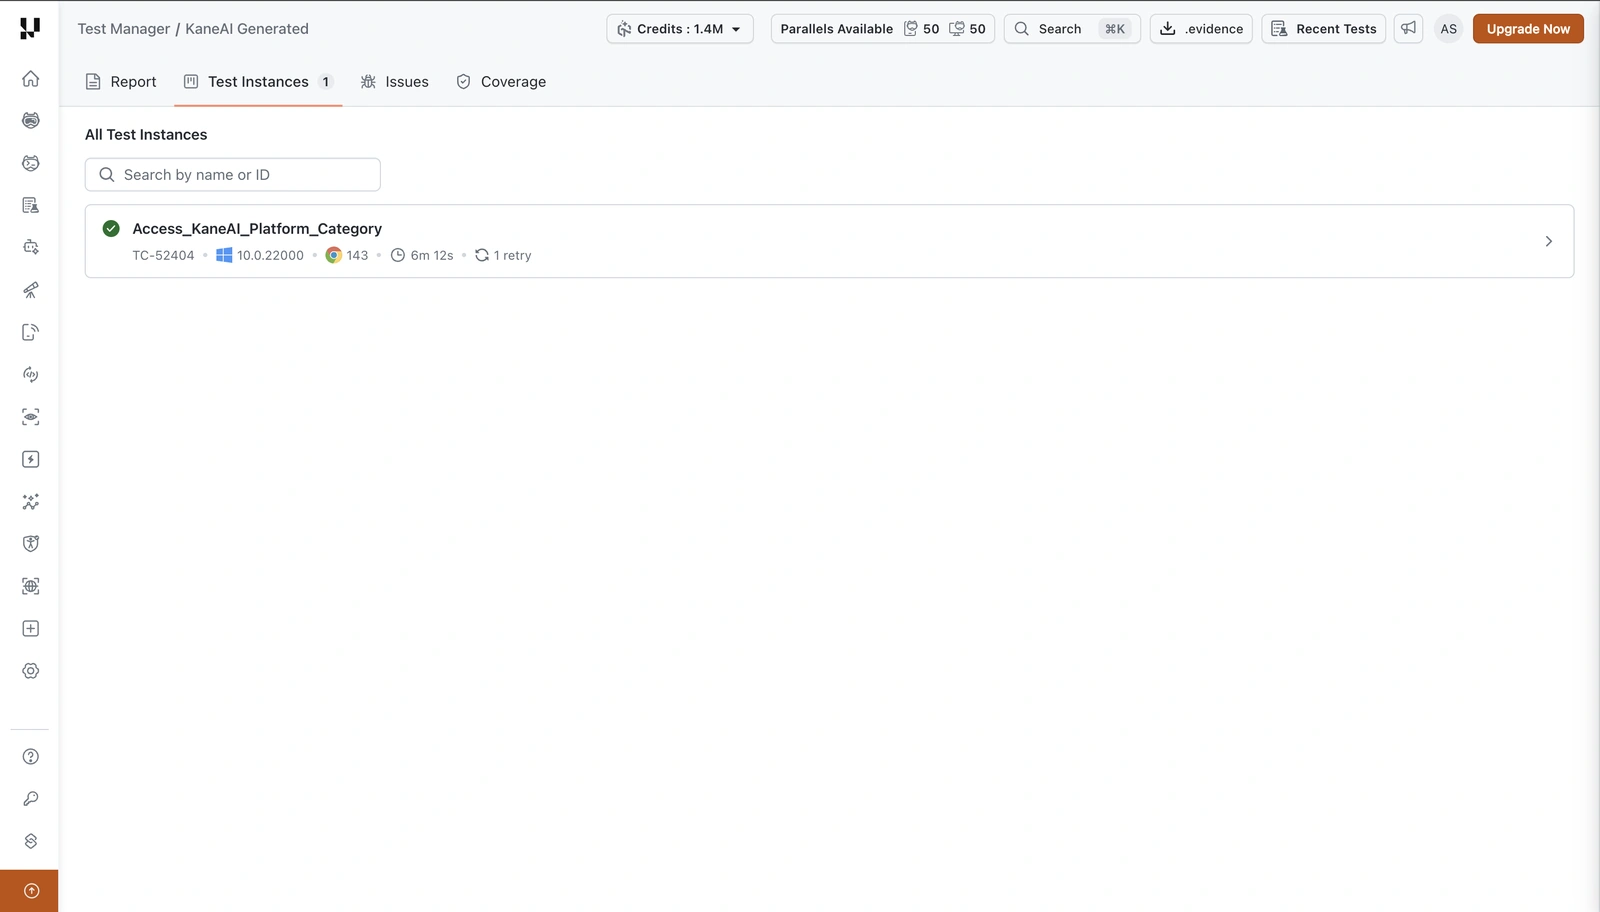
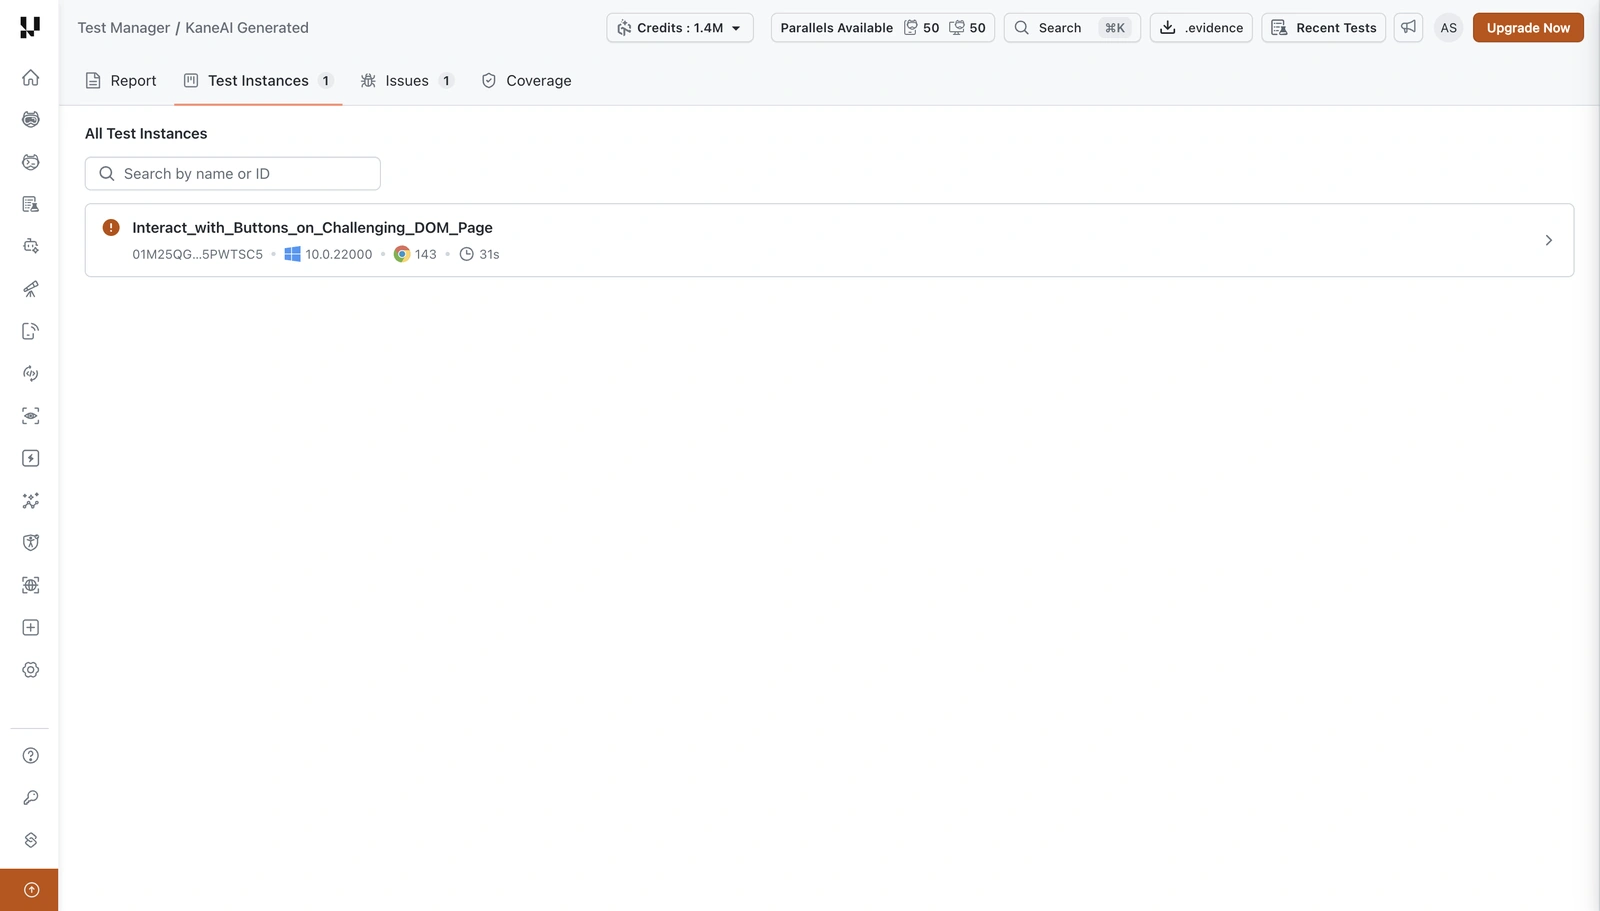
The Test Instances tab lists every instance in the run with its status, test case ID, operating system, browser version, duration, and retries. Use Search by name or ID to find an instance, then click it to open its detail view.
Test Instance Detail
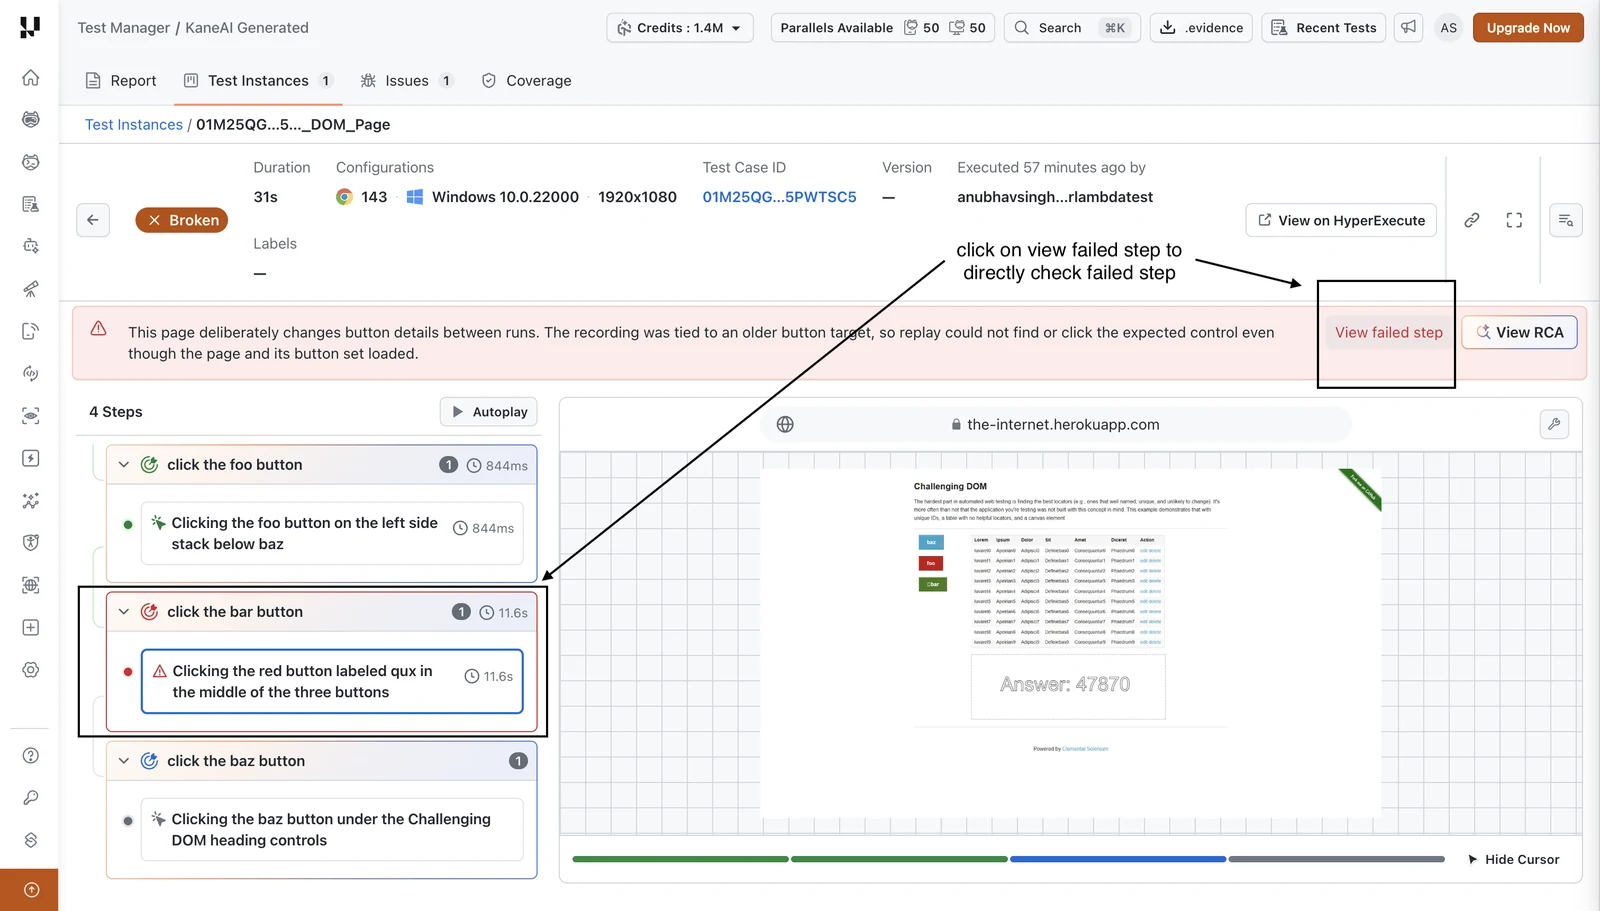
The instance view replays the execution step by step.
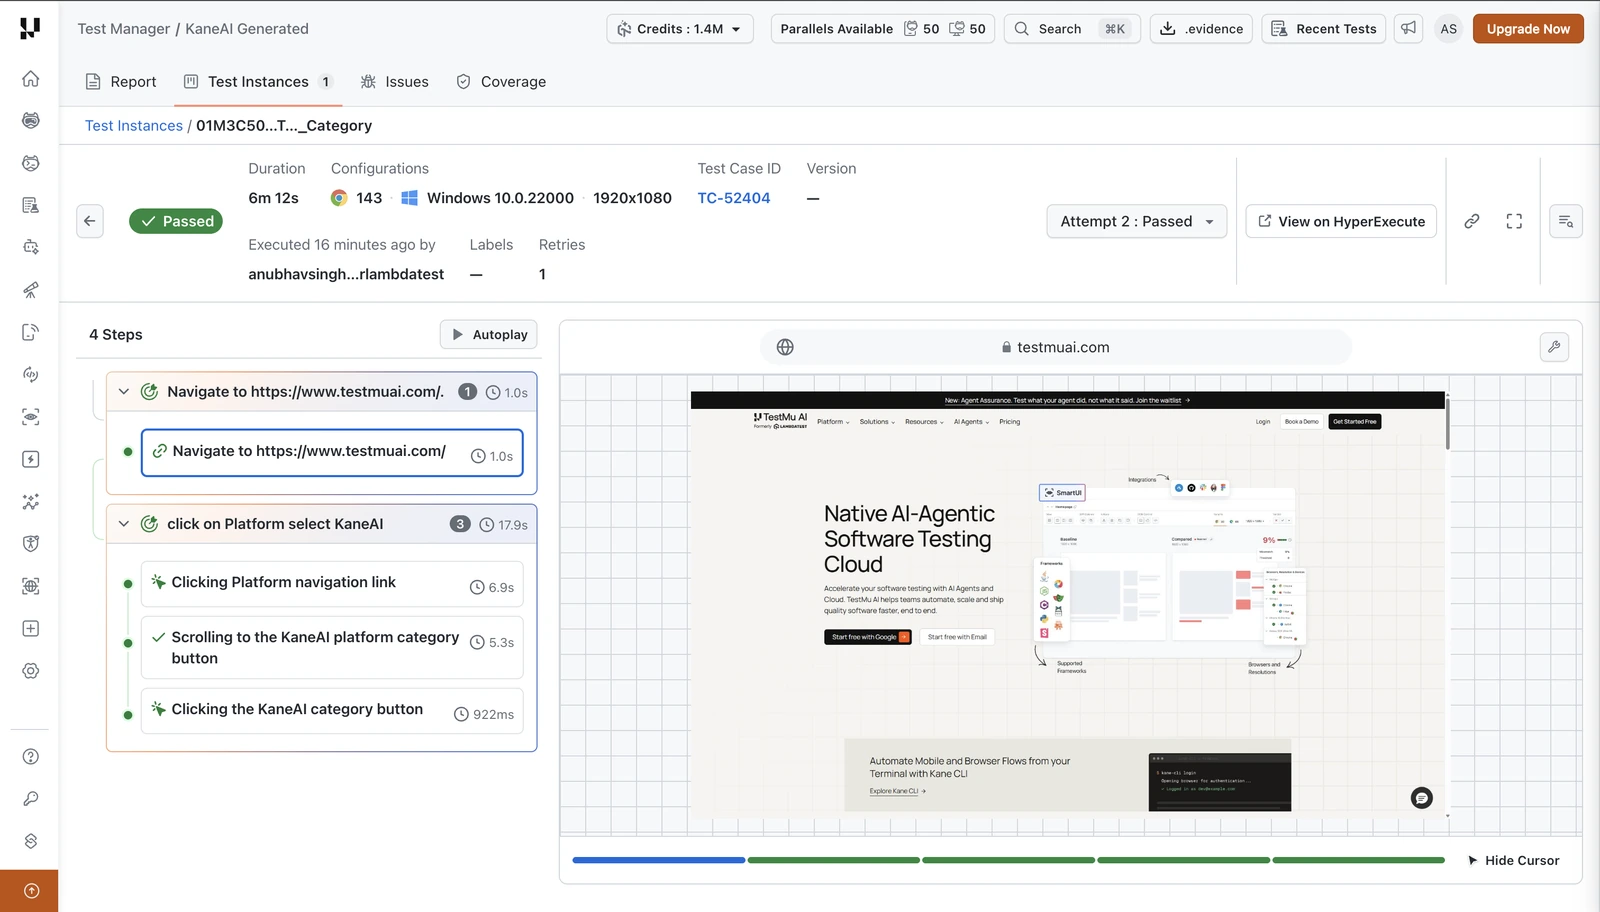
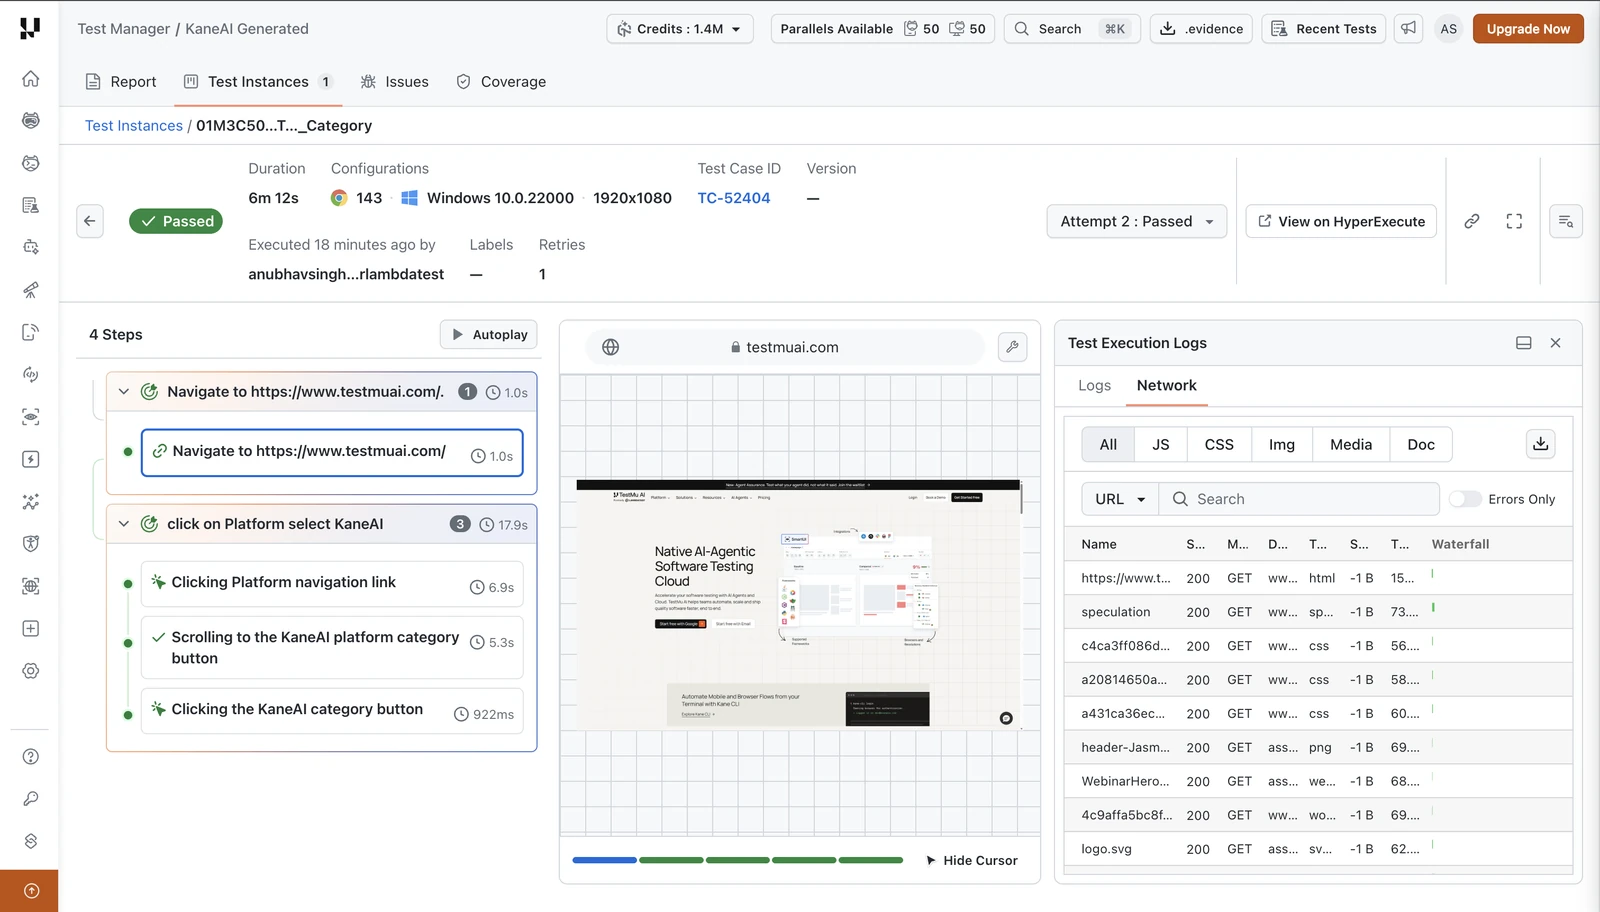
The header shows the status, Duration, Configurations (browser, OS, and resolution), Test Case ID, Version, Executed by, Labels, and Retries. On the right, you can:
- Attempt - Choose an attempt to review when the instance was retried, for example Attempt 2 : Passed.
- View on HyperExecute - Open the job on HyperExecute.
- Copy a link to the instance, switch to full screen, or open the execution logs.
The Steps panel lists the steps you authored. Expand a step to see each action KaneAI performed to complete it, with its duration. Click Autoplay to walk through the steps in order while the screenshot updates.
The center panel shows the page at the selected step, with its URL. The bar below the screenshot marks each action, so you can jump to any point in the run. Click Hide Cursor to hide the cursor in the screenshots.
Test Execution Logs
Click the logs icon in the header to open Test Execution Logs.
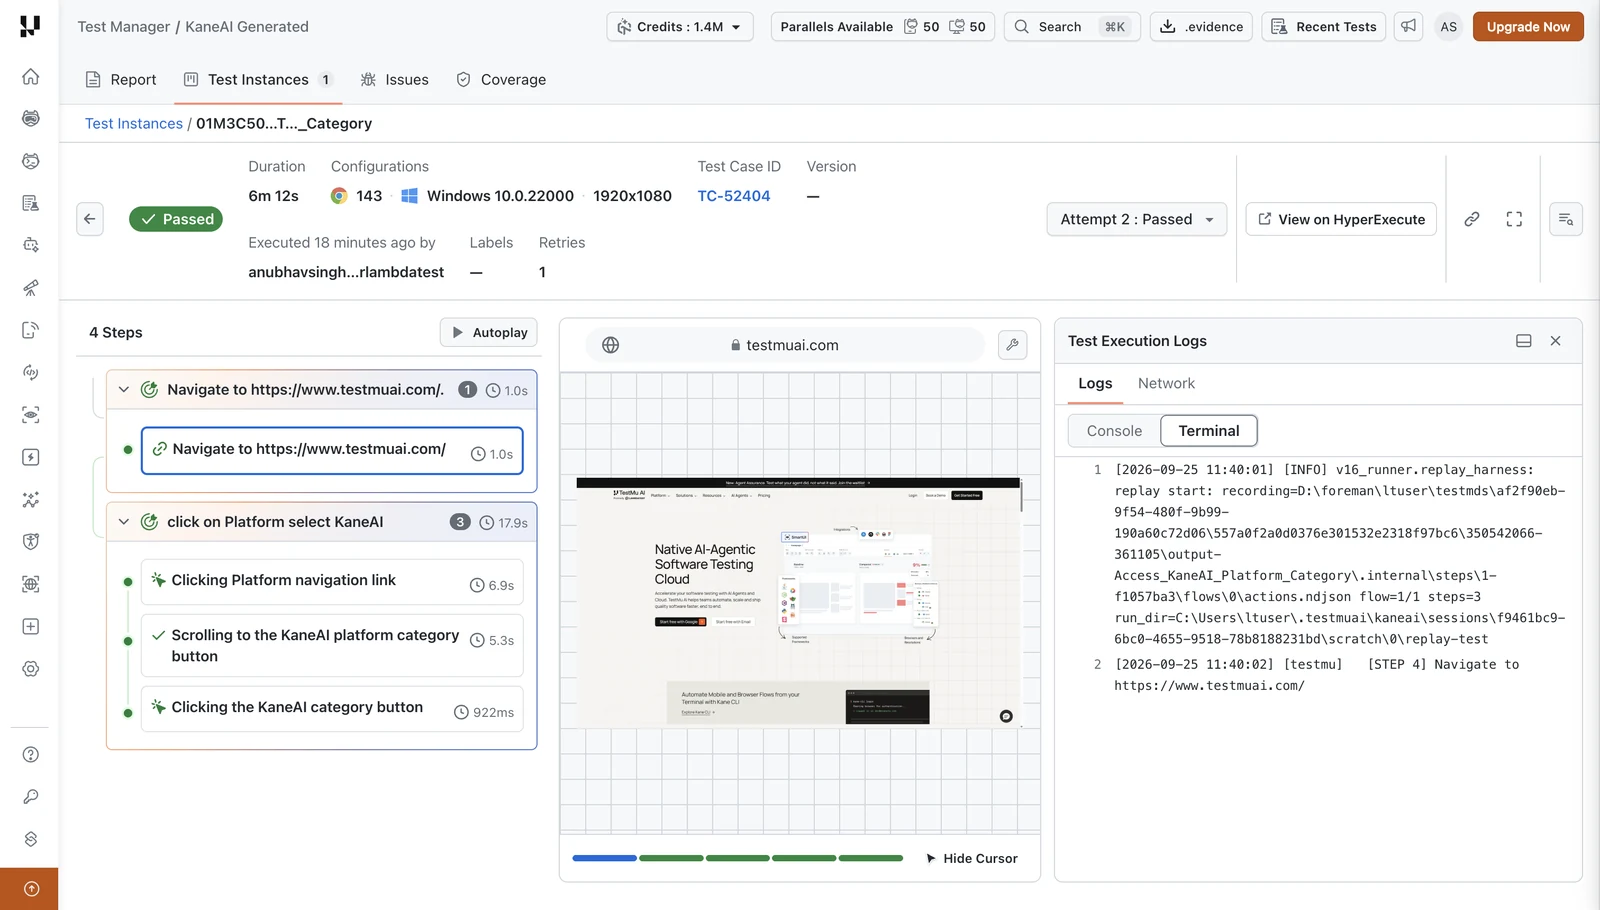
- Logs - Switch between Console output from the browser and Terminal output from the test run.
- Network - Every request the page made, with its status, method, domain, type, size, time, and a waterfall. Filter by All, JS, CSS, Img, Media, or Doc, search by URL, turn on Errors Only, or download the log.
Coverage
The Coverage tab shows the business use cases, acceptance criteria, and verification rollup that an evidence pack carries.
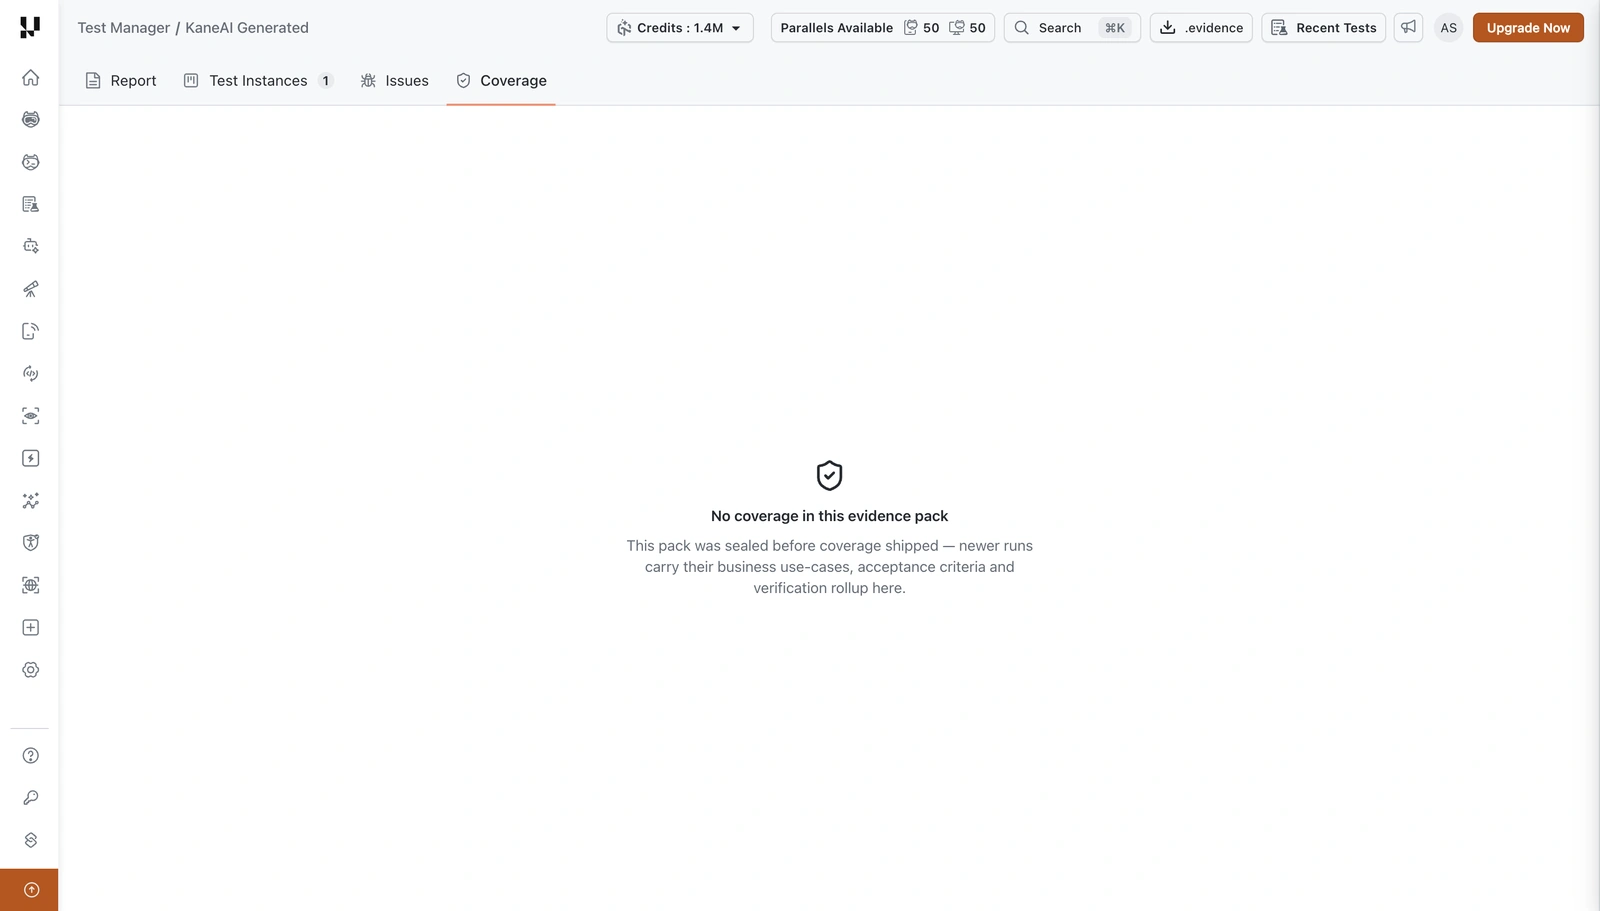
Coverage is not yet available for KaneAI test runs. For these runs, the Coverage tab shows No coverage in this evidence pack.
Debug an Unsuccessful Run
When a test in the run does not pass, the Evidence Report points you to the cause.
Need Your Attention
The Report tab of an unsuccessful run shows a Need your attention panel. It lists each failure with its priority and a one-line cause, along with counts of failed, triaged, and untriaged failures. Click View RCA to open the root cause analysis.
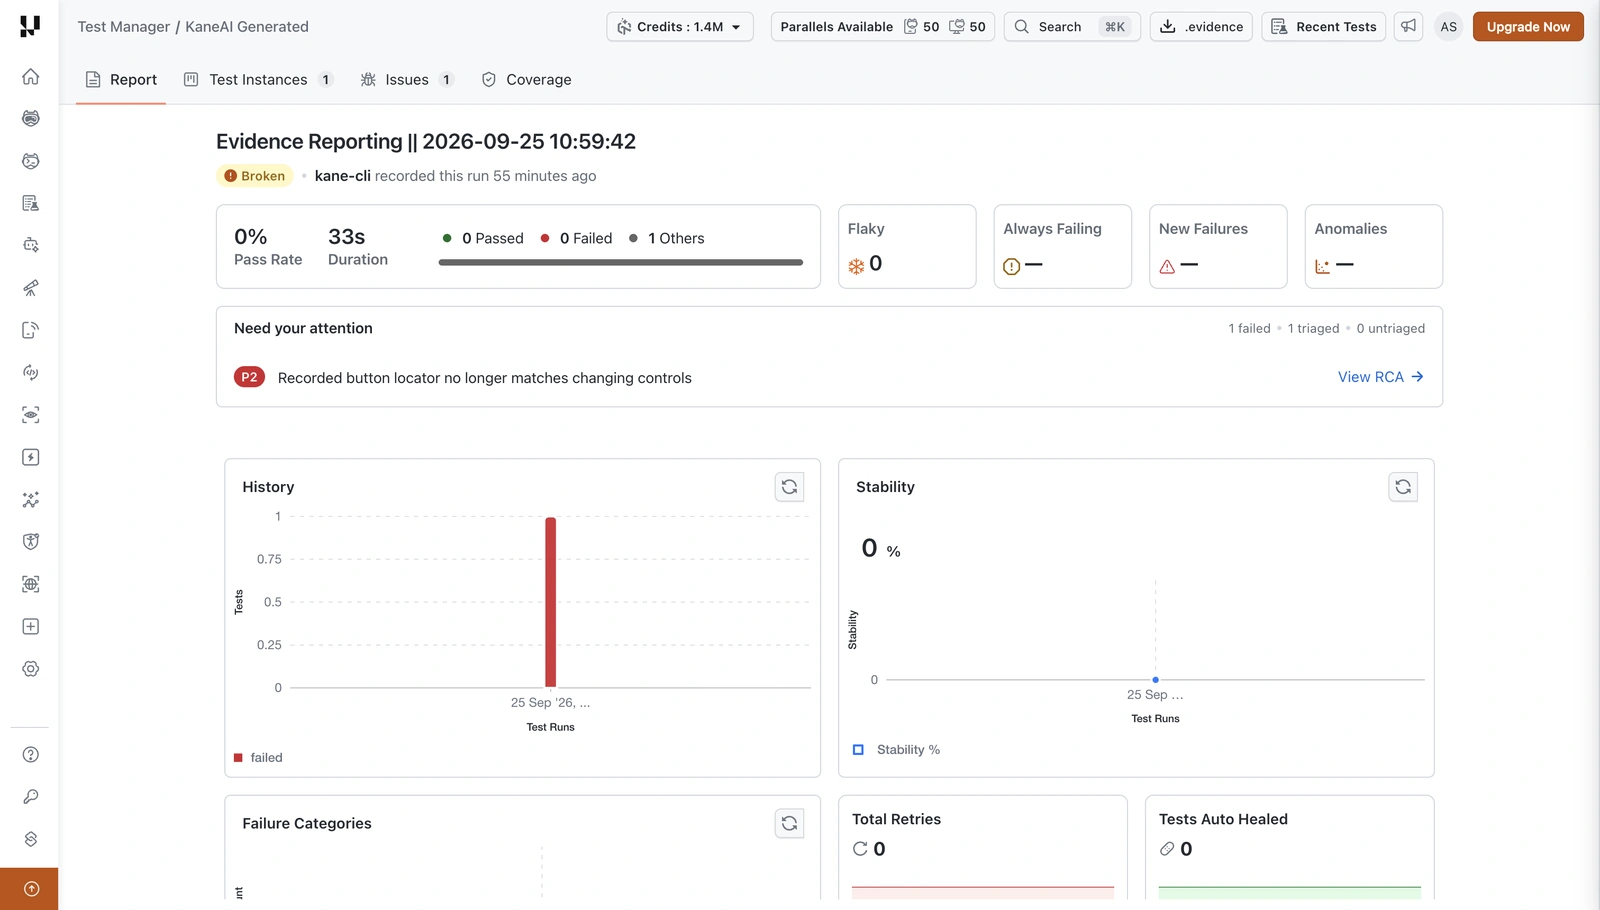
In this example, the run shows Broken. The test could not click a control it had recorded, so the failure was triaged as an automation bug rather than a failed check. It counts under Others in the summary.
Issues
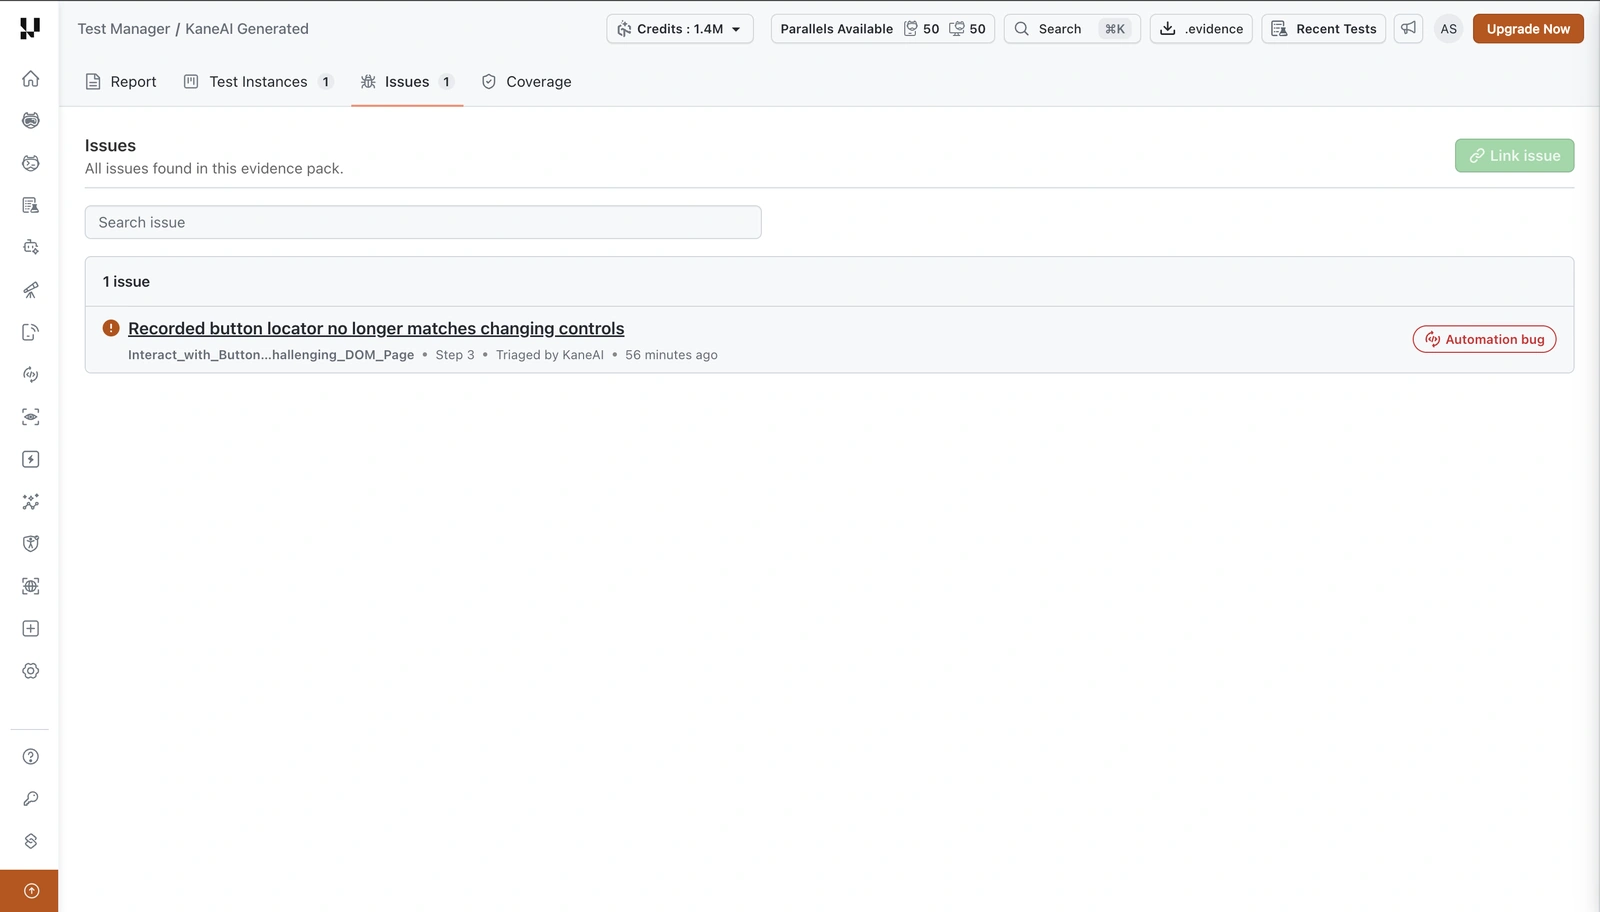
The Issues tab lists every issue found in the evidence pack. Each issue shows its summary, the test and step where it happened, who triaged it, and a category such as Automation bug. Use Search issue to find an issue, and click it to open its root cause analysis.
Root Cause Analysis
The RCA panel explains the failure.
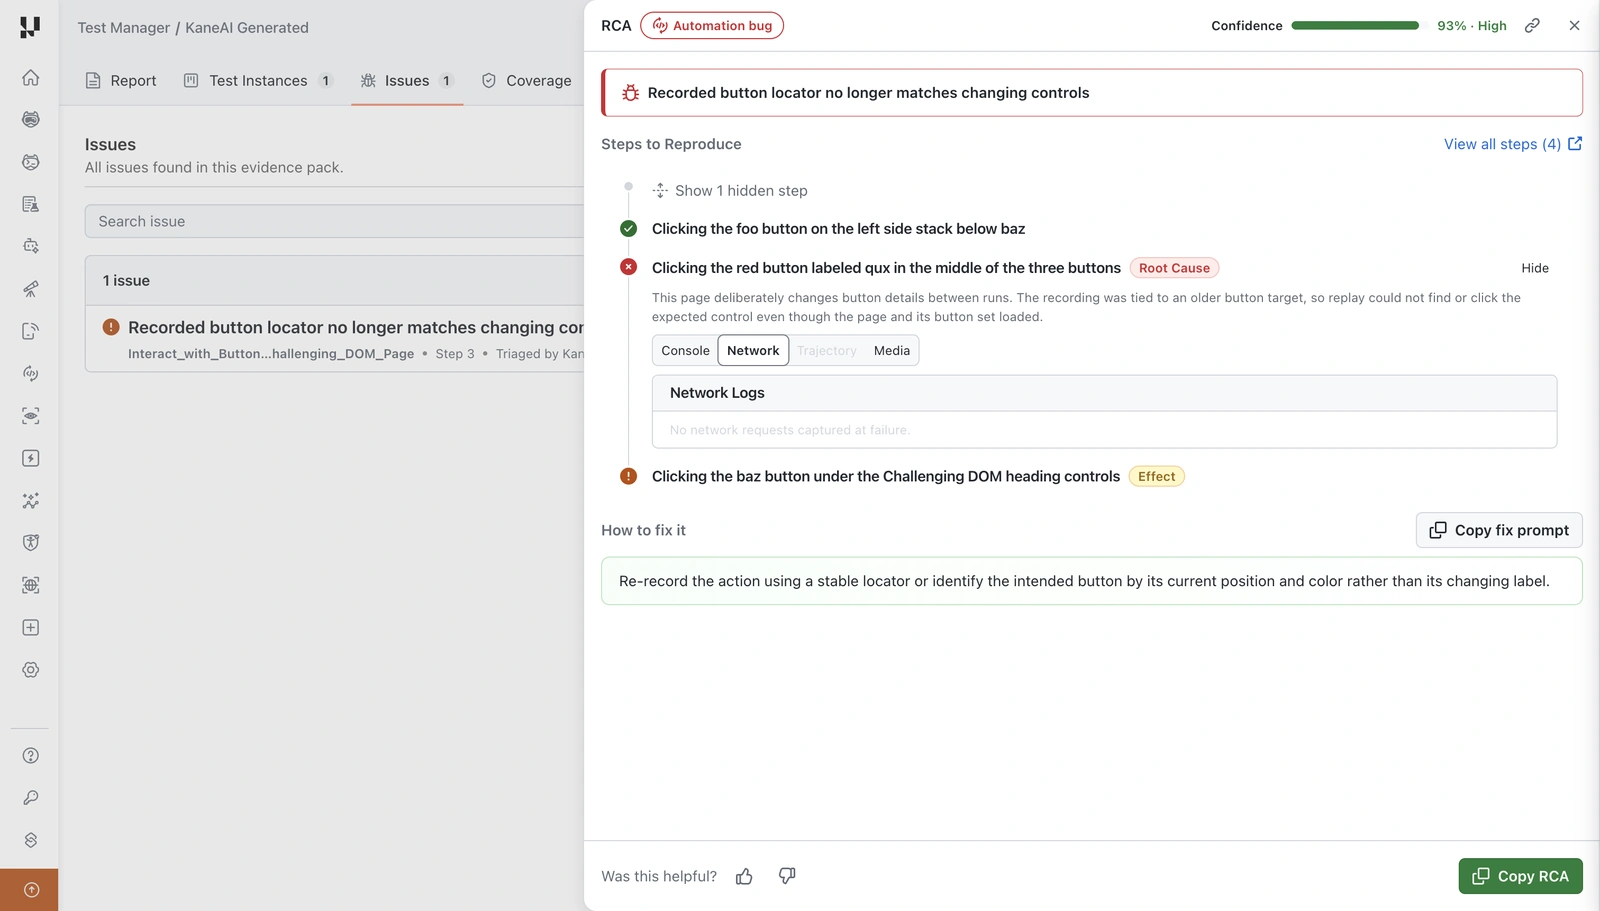
- Category and Confidence - The type of failure, for example Automation bug, and how confident the analysis is.
- Steps to Reproduce - The steps that led to the failure. The failing step is marked Root Cause with an explanation, and the steps affected by it are marked Effect. Open the Console, Network, Trajectory, or Media tabs on a step, where available, to see what was captured at that point. Click View all steps to open the full instance.
- How to fix it - A suggested fix. Click Copy fix prompt to copy it.
- Click Copy RCA to copy the whole analysis, and use Was this helpful? to rate it.
Go to the Failed Step
Open the failed instance from the Test Instances tab.
A banner at the top of the instance explains the failure. Click View failed step to jump to the step that failed, or View RCA to open the root cause analysis. The failed action is marked in red, and actions after it that did not run show a gray marker.
Limitations
- Mobile Browser not supported: The enhanced Test Run Instance view is currently not supported for Mobile Browser test executions.
- Coverage in Evidence Reporting: Coverage is not yet available for KaneAI test runs executed with Evidence Reporting.
- Applies to newly generated code only: This view is available only for test cases whose code was generated after the feature was enabled. For older test cases, the previous automation details page will continue to be shown.
Related Guides
- Execute Test Runs on HyperExecute - Create and execute test runs
- Evidence Reporting - Run a test run with Evidence Reporting
- Sequential Test Runs - Run dependent test cases in order
- Test Run Configurations - Manage browser and device configurations
- Scheduled Test Runs - Automate test run scheduling
 Chat with Us