Usage Report
TestMu AI products usage insights
TestMu AI Usage Report gives you a single view of how your organization uses each TestMu AI product: how many tests ran, how long they took, who ran them, and which devices and applications they used. You can read every widget as a table or as a chart, narrow the data with filters, and export or share the report.
To open it, go to Insights > Reports > Usage in the left navigation. The report is titled Usage in the app.
The Usage Report is currently in BETA. If you have any feedback or suggestions, please feel free to reach out to us at support@testmuai.com.
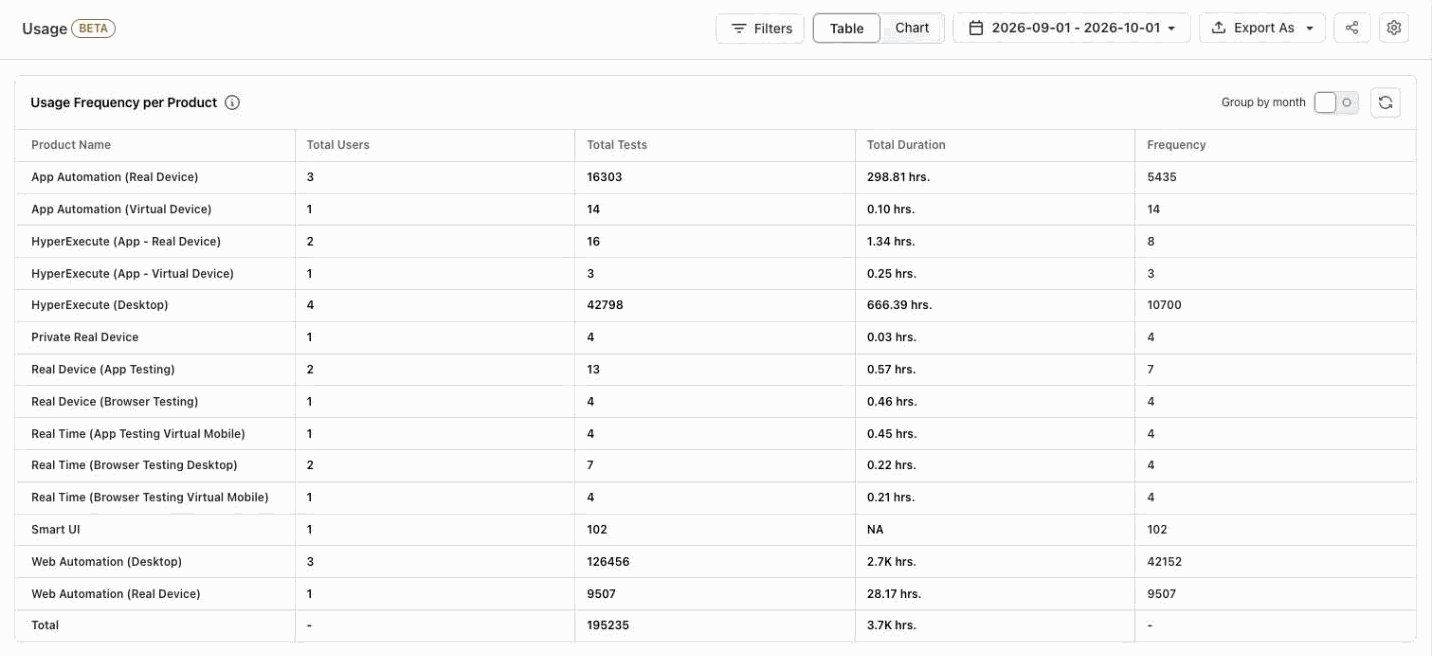
The header of the report has these controls:
| Control | What it does |
|---|---|
| Filters | Opens the Filters panel. The number on the button shows how many filter categories are applied. |
| Table / Chart | Switches every widget between a table and a chart. |
| Date range | Sets the time frame for all widgets. |
| Export As | Export As Excel downloads the table data. Export As PDF downloads the report in the view you have selected (Table or Chart); it is available only when the dashboard link is public. |
| Share (share icon) | Creates a link to the report. The shared report opens in the view you had selected and is read-only: viewers cannot change filters, the view, or the chart options. |
| Settings (gear icon) | Opens the report settings, including Share Settings. Only Admins see this icon. |
Each widget also has a refresh icon that reloads that widget's data.
To enable Export As PDF, an Admin opens Settings (gear icon) > Share Settings and selects Allow anyone with the link to access the dashboard. If the link is protected with a custom password instead, exporting is disabled.
Filter the report
Click Filters to open the Filters panel. Filters are grouped into categories in the left column:
| Category | Filters |
|---|---|
| General | Product, Project Name, Type (Automation or Manual) |
| Status | Test status, for example passed, failed, or error |
| Device & OS | OS, Device Name |
| Users | Users, Team Name, Group Name |
| SubOrgs | Sub Org Name |
| Tags | Build Tags, Test Tags, Custom Tags |
Select a category, pick a filter, and select the values you want. The panel shows a count next to each category and filter, so you can see what is selected before you apply it.
For Custom Tags, first pick a Custom Tag Key, then select its values. Click Change key to pick a different key.
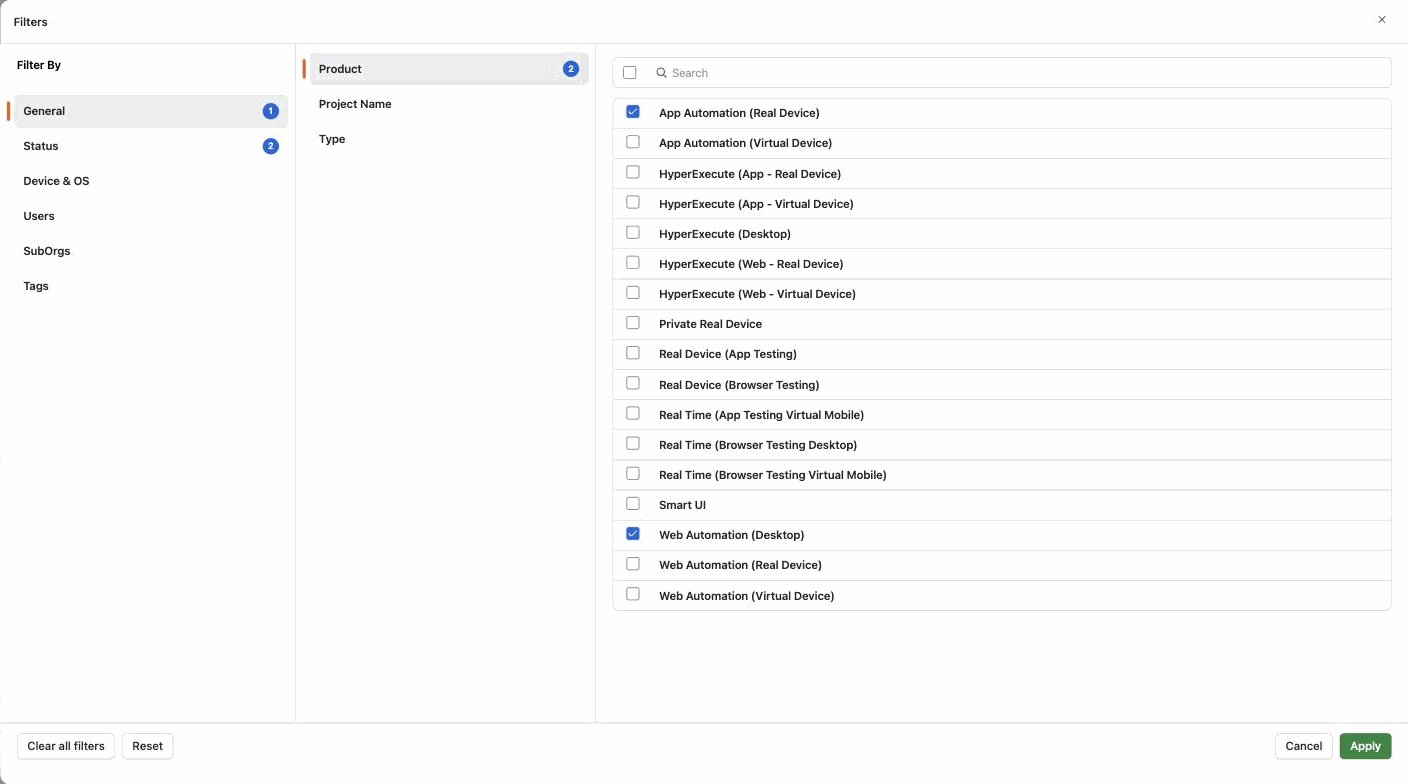
- Click Apply to update the report. Nothing changes until you apply.
- Click Reset to go back to the filters that are currently applied.
- Click Clear all filters to unselect every value, then click Apply to remove all filters from the report.
- Click Cancel to close the panel without changes.
After you apply filters, the Filters button shows how many filter categories are active. For example, product and status filters together show 2.

Table and Chart view
Use the Table / Chart switch in the header to change how all widgets are shown. The report opens in Table view.
In Chart view:
- A fixed set of main products each get their own colour, the same in every chart. All other products are grouped under Other products.
- Use the Tests / Duration switch on a widget to chart test count or time spent.
- Hover over a chart to see the breakdown by product.
- Click a product slice, a user bar, or a device bar to filter the whole report by it. The filter is applied right away and replaces any values already selected in that filter. Unique Applications bars, monthly columns, and Other products cannot be clicked.
Usage Frequency per Product
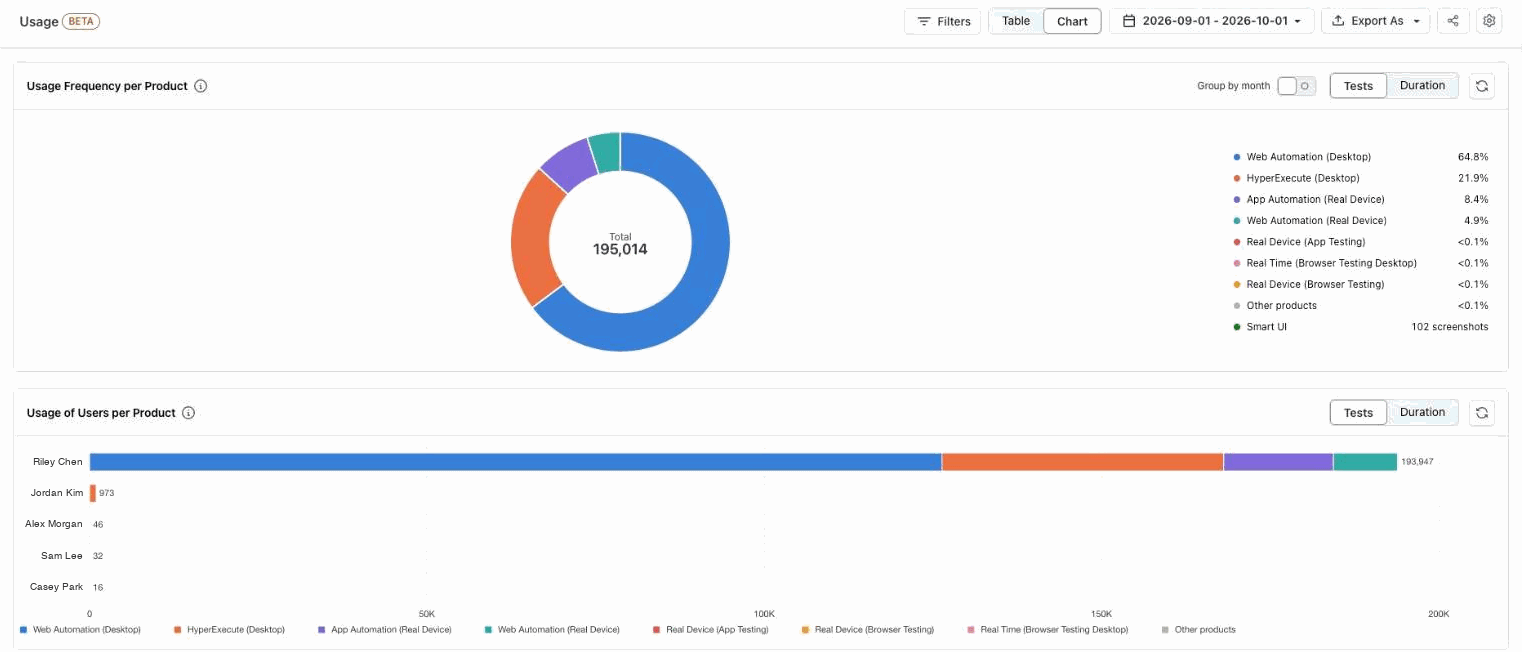
This widget shows how much each product was used in the selected time frame: total users, total tests, total duration, and frequency. Frequency is the average number of tests per user, rounded up (Total Tests ÷ Total Users).
Smart UI usage is counted in screenshots, not tests, and has no duration. In Table view, its screenshots are included in Total Tests and in the Total row. In Chart view, it is shown as its own line in the legend and is not part of the donut or its total, so the two totals can differ.
- Table view: one row per product, with a Total row at the end.
- Chart view: a donut chart of tests or duration per product, following the Tests / Duration switch, with the total in the centre.
Group by month
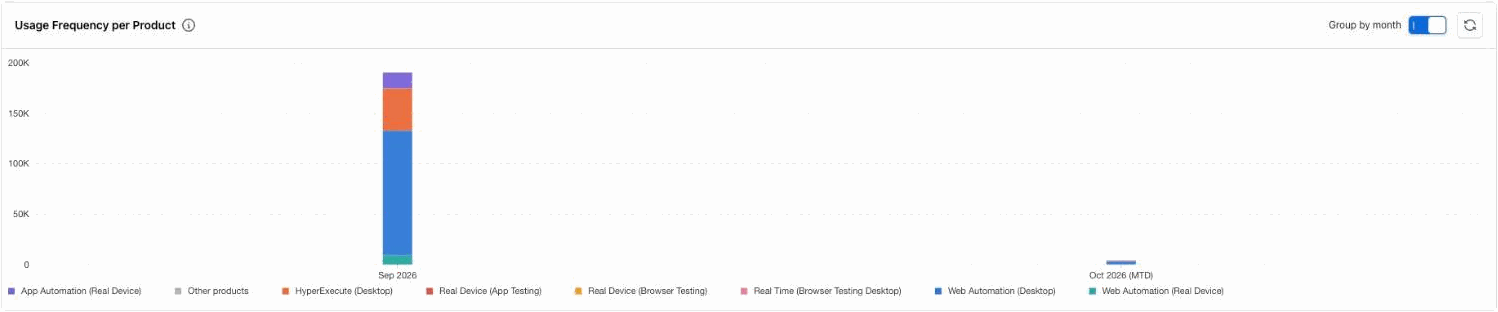
Turn on Group by month to split usage by calendar month. In Table view, this adds a test count column for each month, and for every month after the first, its change from the previous month as a number (Δ vs month) and a percentage (% vs month). In Chart view, this shows a stacked column for each month, with one colour per product. With Group by month on, the chart shows tests only and the Tests / Duration switch is hidden. Months that are not complete are marked: (MTD) for the current month, and (partial) for a month that the date range cuts off.
Usage of Users per Product
This widget shows how many tests each user ran, and for how long, on each product.
- Table view: one row per user, with a column for each product.
- Chart view: one horizontal bar per user, split by product, with the total at the end of the bar. The chart shows the top 10 users. If there are more, click Show all N to see them.
Device Usage Insights
This widget shows which devices your tests ran on, for each user and product.
- Table view: devices per user, with test count and duration for each product.
- Chart view: one horizontal bar per device, split by product. The chart shows the top 10 devices. If there are more, click Show all N to see them.
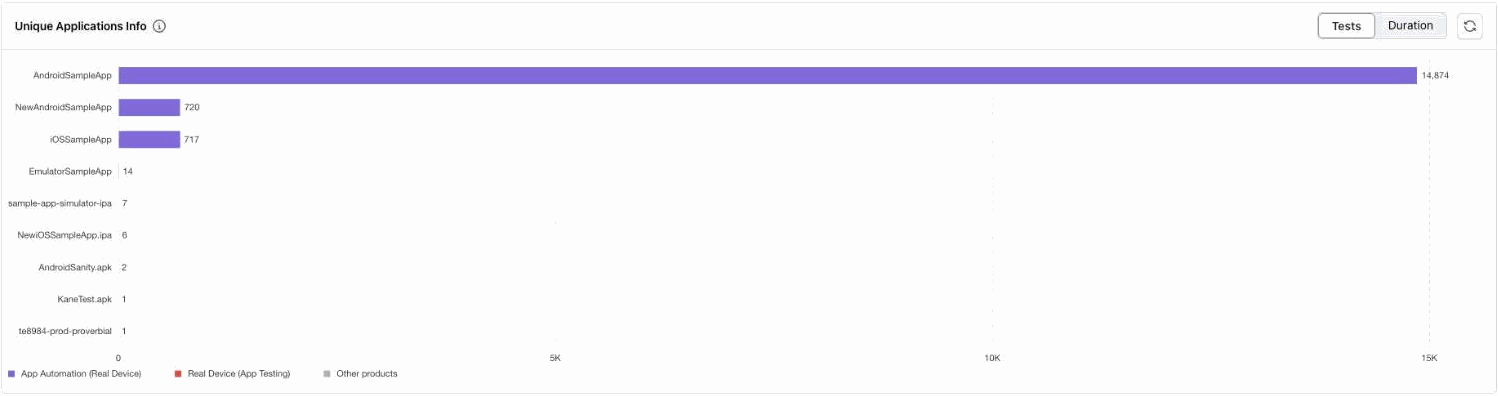
Unique Applications Info
This widget shows the applications you tested, with the users, tests, duration, and results for each product.
- Table view: one row per application, with a column for each product.
- Chart view: one horizontal bar per application, split by product. The chart shows the top 10 applications. If there are more, click Show all N to see them.
A chart shows at most 100 bars. When there are more than 100, the button reads Show top 100. Switch to Table view for the full list.
Value Proposition
- See which products your teams use the most, and where testing time goes.
- Find the most active users, devices, and applications.
- Focus on one product, team, or tag with filters, and share the same view with your team.

 Chat with Us