

Power Your Software Testing with AI Agents and Cloud
The Native AI-Agentic Cloud Platform to Supercharge Quality Engineering. Test Intelligently and Ship Faster.


- TestMu AI (Formerly LambdaTest)
- /
- Blog
- /
- 11 Best AI Observability Tools in 2026: LLM Tracing and Monitoring Compared
11 Best AI Observability Tools in 2026: LLM Tracing and Monitoring Compared
Compare 11 AI observability tools for LLM tracing and monitoring in 2026: tracing model, OpenTelemetry support, self-hosting, and which tools changed owners.
Published on:
A customer replies that your support agent confirmed their order cancellation, yet the order shipped anyway. Your application logs show a successful model call and a 200 response, and nothing about which prompt version ran, which policy document the retriever returned, or whether the agent ever called the cancellation tool. AI observability tools exist to record those details for every request.
This roundup compares 11 of them, from open-source tracers to monitoring built into larger platforms, with one entry from TestMu AI placed where its scope fits. Most of them store each request as a trace you can open, filter and score when a conversation goes wrong.
The biggest difference between the best LLM observability tools in 2026 is how they collect traces: through OpenTelemetry, a vendor SDK or a gateway. That choice decides how much work a later switch costs, so the comparison table leads with it.
Overview
AI observability tools record what an LLM application or agent did on every request (the prompt, model calls, tool calls, token usage, latency, cost and quality scores) as traces you can search, chart and alert on. Pick one by where your traces may be stored and which stack you already run.
Which AI Observability Tool Fits Which Team?
- Best for MIT-licensed self-hosting: Langfuse - deploys with Docker, on VMs or on Kubernetes, and pairs an SDK built on the official OpenTelemetry client with an OTLP endpoint for traces from other instrumentation.
- Best for quality alerts in LangChain apps: LangSmith - dashboards, rules, webhooks and online evaluations on production traces, OpenTelemetry ingestion for code outside LangChain, and self-hosting as an add-on to the Enterprise plan.
- Best for LLM traces beside existing APM data: Datadog Agent Observability - automatic tracing of LLM calls without code changes, ingestion of OpenTelemetry traces that follow the GenAI semantic conventions, and built-in evaluations that identify prompt injections.
- Best for ML and LLM teams together: MLflow Tracing - OpenTelemetry-compatible tracing with one-line automatic setup for popular LLM and agent frameworks, open source, with trace data hosted on your own infrastructure.
- Best for monitoring real customer calls: TestMu AI Agent Testing - scores uploaded batches of recorded production calls with the same 30+ call metrics used in live test calls, and runs test suites on a schedule between releases.
What Are AI Observability Tools?
AI observability tools are platforms and libraries that record each request an LLM application or agent handles as a trace: a tree of spans for model calls, retrieval steps and tool calls, with tokens, latency, cost and quality scores attached. Teams use them to debug failures, track spend and catch quality regressions in production.
The guide to AI observability covers the discipline itself; this article compares the tools that implement it. Most of them record the same kinds of data:
- Traces and spans - one trace per request, with a span for each model call, retrieval step and tool call, so a bad answer can be tied to the step that produced it.
- Usage and cost - token counts, latency and cost per span, rolled up by user, feature or model.
- Quality signals - scores from LLM judges, code checks or user feedback, attached to the trace they grade.
- Dashboards and alerts - thresholds on any of the signals above, which is the monitoring half of the job.
Structure matters because raw agent traces are hard to read, even for language models. In the TRAIL benchmark paper (May 2025), built on 148 human-annotated agent traces, the best model tested, Gemini-2.5-pro, scored 11%, and the authors conclude that modern long-context LLMs perform poorly at trace debugging.
Most tools below exist to make trace debugging practical, by filtering traces on span type, score, user or model instead of reading them end to end.
The 11 Best AI Observability Tools in 2026
Each tool had to record or score an LLM application's or agent's production traffic (as traces for ten of them, and as recorded production calls for TestMu AI), and every capability below was checked against the vendor's own live documentation on September 30, 2026. The order runs from open-source and source-available tools you can host yourself, through managed LLM platforms, to monitoring built into broader platforms, and it is not a quality ranking. TestMu AI closes the list because its entry covers a narrower job: monitoring conversational agents.
Helicone, a gateway, appears in the category section instead, because Helicone's own announcement says its services now run in maintenance mode (see Recent Ownership Changes).
| Tool | Tracing model | Open source and self-hosting | Best fit |
|---|---|---|---|
| Langfuse | SDK built on the OpenTelemetry client, plus an OTLP endpoint | MIT core (ee folders excluded); Docker, VMs, Kubernetes, Terraform | Trace data on infrastructure you control |
| Arize Phoenix | OpenTelemetry with OpenInference instrumentation | Elastic License 2.0; Docker or Kubernetes; Arize AX is the managed product | Debugging and experiments during development |
| Opik | Client SDKs, REST API and OpenTelemetry ingestion | Apache-2.0; the full platform self-hosts | Open-source tracing with online evaluation rules |
| OpenLLMetry | OpenTelemetry instrumentation only | Apache 2.0; no backend of its own | Vendor-neutral spans for any OpenTelemetry backend |
| MLflow Tracing | OpenTelemetry-compatible SDK with automatic tracing | Open source; traces stay on your infrastructure | Teams that already run MLflow for models |
| LangSmith | LangSmith SDK plus OpenTelemetry ingestion | Commercial; self-hosting is an Enterprise plan add-on | LangChain-based stacks that want alerts on quality |
| Braintrust | Braintrust SDK plus OpenTelemetry ingestion | Commercial; hybrid deployment of the Brainstore data plane | Evaluation and production logging in one system |
| W&B Weave | Weave SDK (OTel-compatible) plus an OTLP endpoint | Apache-2.0 SDK; commercial platform, part of CoreWeave since 2025 | Teams that train models in Weights & Biases |
| Datadog Agent Observability | Datadog SDK auto-instrumentation and OpenTelemetry GenAI conventions | Commercial SaaS | Teams whose monitoring already runs on Datadog |
| Fiddler AI | Built on OpenTelemetry standards | Commercial; SaaS, VPC, on-premises or air-gapped | Enterprises that need on-premises or air-gapped deployment |
| TestMu AI (Formerly LambdaTest) | Test calls, chats and recorded production calls; no code instrumentation | Commercial platform | Quality monitoring of voice and phone agents |
1. Langfuse
An open-source LLM engineering platform that, in the words of its README, helps teams "develop, monitor, evaluate, and debug AI applications". Langfuse has been part of ClickHouse since January 2026 (see Recent Ownership Changes).
- OpenTelemetry at the core - the SDK is "a thin layer on top of the official OpenTelemetry client", and the server accepts OTLP traces on its /api/public/otel endpoint, so spans from other instrumentation land in the same project.
- Self-hosting - the repository documents deployment with Docker, on VMs, on Kubernetes with Helm, and through Terraform templates for AWS, Azure and GCP.
- Beyond tracing - prompt management, evaluations, datasets and a playground live in the same project as the traces.
Consider it when trace data has to stay on infrastructure you control. The MIT license covers the repository except its ee folders, so confirm which enterprise features you need before counting on self-hosting for them.
2. Arize Phoenix
Arize's AI observability and evaluation tool, which its documentation describes as "built on top of OpenTelemetry" and "powered by OpenInference instrumentation". Arize also sells Arize AX, "a managed enterprise platform built on the same open standards".
- Step-by-step traces - a trace shows what happened during a single run of your AI application, and evaluations score output quality on the same records.
- Datasets and experiments - rerun changed prompts or models against the same inputs, and iterate on prompts in a playground using real examples from your application.
- Deployment - Phoenix runs on Docker, Kubernetes or your cloud of choice.
Consider it when you want OpenTelemetry-based tracing for debugging and experiments, with Arize AX as the managed option. Phoenix ships under the Elastic License 2.0 rather than MIT or Apache 2.0, and that license bars providing the software to third parties as a hosted or managed service. Arize has agreed to be acquired by Dynatrace (see Recent Ownership Changes), so check the Phoenix and Arize AX roadmap once the deal closes.
3. Opik
Comet's "open-source LLM observability and evaluation platform for AI agent tracing, LLM evaluation, prompt management, and production monitoring". Its README states that it is Apache-2.0 licensed and free to self-host as a full platform.
- OpenTelemetry ingestion - alongside its client libraries and REST API, Opik has first-party OpenTelemetry support, so any language with an OpenTelemetry SDK can send it traces.
- Production monitoring - dashboards track feedback scores, trace counts and token usage over time.
- Online evaluation rules - LLM-as-a-judge metrics run against production traces to surface failing interactions.
- Deployment - Docker for local setups and Kubernetes for scale.
Consider it when you want tracing and online evaluation in one open-source deployment, with no separate license for the self-hosted platform.
4. OpenLLMetry
A set of extensions "built on top of OpenTelemetry" for LLM applications, maintained under the Apache 2.0 license by Traceloop, now part of ServiceNow, with a separate OpenLLMetry-JS for JavaScript and TypeScript.
- Instrumentation only - unlike the LLM tracing tools above, OpenLLMetry has no backend of its own: it produces standard OpenTelemetry spans for LLM calls, and storage, search and dashboards come from whichever backend receives them.
- Backend choice - its README lists 24 tested destinations, among them Datadog, Dynatrace, Grafana, Honeycomb, New Relic, Splunk and a plain OpenTelemetry Collector.
Consider it when you want an LLM tracing library that keeps instrumentation vendor-neutral, or you want LLM spans in the APM backend you already run.
5. MLflow Tracing
The tracing layer of MLflow, which its documentation calls "a fully OpenTelemetry-compatible LLM observability solution for your agents and LLM applications". The same page says it natively supports the GenAI semantic conventions for export and ingestion.
- Automatic tracing - integrations with OpenAI, LangChain, DSPy and Vercel AI give a one-line automatic tracing setup.
- Production monitoring - the docs describe it as production ready, with monitoring for LLM applications and agents in production environments.
- Data location - MLflow is open source and free, and trace data is hosted on your own infrastructure.
Consider it when the same team ships classic ML models and LLM features and already tracks experiments in MLflow.
6. LangSmith
LangChain's platform to "instrument your LLM application, investigate traces, and monitor performance in production". Around the trace viewer it adds dashboards, alerts, rules, webhooks and online evaluations.
- OpenTelemetry ingestion - the docs state that LangSmith "supports OpenTelemetry-based tracing, allowing you to send traces from any OpenTelemetry-compatible application", next to its own SDK.
- Dashboards and alerts - build dashboards and set alerts on quality, then automate follow-up with rules, webhooks and online evaluations.
- Deployment - the documentation describes self-hosted LangSmith as an add-on to the Enterprise plan, aimed at its largest and most security-conscious customers.
Consider it when your agents are built with LangChain, or when you want online evaluation wired into the same place as your traces.
7. Braintrust
Braintrust calls itself "the active observability platform for agents". It logs production traffic so you can inspect every agent trace and tool call, and it scores outputs with LLMs, code or humans.
- OpenTelemetry ingestion - traces sent to its OpenTelemetry endpoint (with a separate endpoint for EU data plane organizations) are accepted, and the LLM calls in them become Braintrust LLM spans that can be saved as prompts and evaluated in its playground.
- Storage - logs live in Brainstore, which Braintrust describes as "the database built for AI data at scale".
- Hybrid deployment - the Brainstore data plane can be deployed on your own infrastructure.
Consider it when evaluation is your main workflow and you want production traces scored in the same system that runs your offline evals.
8. W&B Weave
The Weights & Biases tool to "track, test, and improve language model apps", now documented on CoreWeave's documentation site. That documentation names CoreWeave Agent Lens, an agent observability platform, as the successor to Weights & Biases Weave, and says both services already receive your agent tracing data, so there is nothing to migrate.
- Instrumentation - instrument LLM calls and arbitrary functions by hand, or trace agents built with popular SDKs and harnesses through Weave's OTel-compatible SDK.
- OTLP endpoint - agents already instrumented with OpenTelemetry can send their traces straight to Weave.
- Scorers - LLM judges and custom scorers evaluate responses from the recorded traces.
Consider it when model training already runs in Weights & Biases and you want LLM traces next to those experiments. New users now start the Weave library from a CoreWeave Forge account, so compare Weave with Agent Lens before you instrument a new project.
9. Datadog Agent Observability
Datadog's product to "monitor, troubleshoot, and evaluate your LLM-powered applications". The documentation page is now titled Agent Observability, while some sentences in the same docs still say LLM Observability, so search for both names.
- Automatic tracing - the Python SDK traces and annotates LLM calls made through OpenAI, LangChain, AWS Bedrock and Anthropic, capturing latency, errors and token usage without code changes.
- OpenTelemetry - its OpenTelemetry instrumentation docs say it ingests traces that follow the OpenTelemetry semantic conventions for generative AI (version 1.37 and later), sent without the Agent Observability SDK or a Datadog Agent.
- Safety and cost - built-in evaluations identify prompt injections, sensitive data can be scanned and redacted automatically, and Insights analyzes incoming traces for recurring cost and reliability problems.
Consider it when your on-call engineers already work in Datadog and you want LLM traces in the same platform as the rest of your monitoring.
10. Fiddler AI
Fiddler frames its platform around "visibility, context, and control for agentic and predictive AI", so classic ML models and LLM applications share one monitoring product.
- Metric catalog - Fiddler lists more than 100 out-of-the-box and custom metrics, including hallucination, toxicity, PII and PHI, drift, performance and business KPIs.
- Real-time guardrails - detection of hallucinations, toxicity, bias, PII and PHI leakage, jailbreaks and policy violations, backed by evaluator models it calls Centor Models, which run in your environment with no external API calls.
- Deployment - SaaS, virtual private cloud, on-premises and air-gapped options, on a platform "built on OpenTelemetry standards for interoperability".
Consider it when a security review requires on-premises or air-gapped deployment, or when drift on predictive models matters as much as LLM quality.
11. TestMu AI (Formerly LambdaTest)
The ten tools above trace code. TestMu AI's Agent Testing watches conversational agents from the outside instead: it runs calls and chats against a chat, voice or phone agent and scores what the agent says, before and after release.
- Production recording analysis - upload batches of recorded production calls (MP3 or WAV) and they are scored with the same metrics as live test calls, as TestMu AI's phone agent testing documentation describes.
- Call metrics - according to the same documentation, every call is scored across 8 metric categories with 30+ individual metrics, including intent recognition accuracy, containment rate and audio quality.
- Scheduled runs - a scheduling engine runs suites on preset frequencies or custom cron expressions, so quality drift shows up between releases.
Consider it when customers reach the agent by voice or phone and you need quality scores on real calls. It evaluates conversations rather than code-level spans, so pair it with a tracer from this list.
AI Observability Platforms by Category
OpenTelemetry is the shared format across most categories, but its GenAI semantic conventions, now kept in a dedicated repository, are still marked Development.
| Category | How it collects data | What it sees well | What to check | Tools in this list |
|---|---|---|---|---|
| Open-source and source-available tracing platforms | OpenTelemetry-based SDKs and OTLP endpoints | Full request trees on infrastructure you control | You run storage, upgrades and scaling yourself | Langfuse, Arize Phoenix, Opik |
| Instrumentation libraries | OpenTelemetry spans exported to any backend | Model and framework calls in a vendor-neutral format | You still need a backend and a UI | OpenLLMetry |
| Managed LLM platforms | Vendor SDK plus OpenTelemetry ingestion | Evaluation, datasets and online scoring tied to traces | Where the data is stored, and the self-hosting terms | LangSmith, Braintrust, W&B Weave |
| Gateways and proxies | Model calls routed through a proxy | Every model call, with little code change | Tool executions that never pass through the gateway | None ranked; Helicone is in maintenance mode |
| APM add-ons | APM SDK auto-instrumentation and OpenTelemetry GenAI conventions | LLM traces beside service and infrastructure telemetry | How deep the evaluation workflow goes for your use case | Datadog Agent Observability |
| ML lifecycle and monitoring platforms | Platform SDKs and OpenTelemetry-compatible tracing | Drift and performance across predictive models and LLMs | How much agent-level detail you get beyond model metrics | MLflow Tracing, Fiddler AI |
| Conversational agent monitoring | Test calls and chats, plus recorded production calls | What the agent said, scored per conversation | Code-level spans, which need a tracer alongside | TestMu AI Agent Testing |
Agents that call many tools and hand work to sub-agents need the whole tree traced, with arguments and results on each tool span. The comparison of AI agent observability tools covers that narrower use case.
Recent Ownership Changes
Several tools in the LLM observability platform market changed owners, or agreed to, between May 2025 and August 2026, each confirmed by the companies involved:
- Weights & Biases - CoreWeave completed its acquisition on May 5, 2025.
- Langfuse - ClickHouse announced on January 16, 2026 that it had acquired Langfuse; the core stays MIT licensed and Langfuse Cloud continues as a standalone service.
- Helicone - the gateway announced on March 3, 2026 that it had been acquired by Mintlify; its services stay live in maintenance mode, which the announcement defines as security updates, new models, and bug and performance fixes.
- Galileo - Cisco announced its intent to acquire Galileo on April 9, 2026, and Splunk's acquisition page now says the deal is complete and names the product Splunk Agent Observability.
- Traceloop - ServiceNow's May 5, 2026 press release describes the acquisition of the OpenLLMetry maintainer as recently completed, with Traceloop behind runtime agent observability in AI Control Tower.
- Arize - Dynatrace announced on August 13, 2026 that it had signed a definitive agreement to acquire Arize, which makes Phoenix and Arize AX; at the time, Dynatrace expected the deal to close later that quarter or early in its third quarter, subject to regulatory reviews.
Before you standardize on one of these tools, check the new owner's announcement for license, hosting and maintenance commitments.
LLM Monitoring vs Observability Tools
The OpenTelemetry observability primer says observability "lets you understand a system from the outside by letting you ask questions about that system without knowing its inner workings", including novel problems it calls "unknown unknowns". For LLM applications, monitoring catches the failures you anticipated, and observability explains the rest:
- LLM monitoring tools - watch known signals such as latency, error rate, token spend, cost and evaluation scores, and alert when one crosses a threshold. Datadog Agent Observability, the alerts in LangSmith and the feedback-score charts in Opik all cover this half.
- LLM observability tools - keep each request's full trace, so after a failure you can ask a question you did not plan for, such as which prompt version, retrieved document or tool call produced a bad answer.
- Where they meet - online evaluation scores production traces with an LLM judge or a code check, and that score becomes one more monitored signal.
When you compare tools, check whether an alert links straight to the traces that triggered it. The guide to LLM observability covers how to instrument a pipeline for both, and the guide to AI agent monitoring covers which signals to watch once an agent starts calling tools.
How to Choose an AI Observability Tool
Take these steps in order, because the first ones rule out more tools than any feature comparison:
- Decide where traces may live - traces carry prompts, retrieved documents and tool payloads. If they cannot leave your network, the shortlist is Langfuse, Arize Phoenix, Opik, MLflow Tracing or your own OpenTelemetry backend, plus LangSmith's Enterprise self-hosting, the Braintrust hybrid data plane or an on-premises Fiddler deployment.
- Decide what each span may record - the OpenTelemetry GenAI spans specification requires the tool name on a tool-execution span but makes the call arguments and result opt-in, because they may contain sensitive information. Recording them makes a failure easier to debug and a trace riskier to store, so set the policy per tool.
- Instrument with OpenTelemetry where you can - ten of the eleven tools in this list produce or accept OpenTelemetry data, so OpenTelemetry instrumentation keeps the backend decision reversible. Expect GenAI attribute names to move while the conventions are marked Development.
- Match the stack you already run - Datadog users start with Datadog Agent Observability, LangChain users with LangSmith, MLflow users with MLflow Tracing, and teams that train in Weights & Biases with W&B Weave or its successor, CoreWeave Agent Lens.
- Check how production scores are produced - run online evaluation rules, judges and custom scorers on your own past failures before you commit. When scoring matters more than tracing, shortlist dedicated LLM evaluation tools as well.
Testing What a Traced Agent Changed With Agent Assurance
The tracers above read records that the agent's own code and SDKs produced. A tool span names the tool and, where you record them, the arguments sent and the response returned: the agent's account of the call, which does not show whether the order was really cancelled in the order system.
TestMu AI's Agent Assurance checks the effect before release. It is not an observability or tracing product and does not watch live traffic; it derives scenarios from the agent's code, invokes the real agent against staging, and grades each acceptance criterion against observed evidence, never against the agent's own account of its work:
- Tool calls against declared tools - each call the profile returns is checked against the tools the agent declares, including rules for calls it must not make. Without observed calls, that criterion is Unable to Verify.
- Effects the run leaves - files that changed under the paths the profile declares, artifacts produced, and records confirmed through a read-only check you supply and approve, such as a query tool on a stdio MCP server.
- Your traces as evidence - a profile's collect hook runs after each scenario to "fetch traces, tool calls, usage, logs, and other delayed evidence", as the Rook CLI profiles and hooks guide documents, so the backend you chose above can feed the judge; a claimed action in a trace still never counts as proof of the effect.
- Unverifiable results reported apart - a criterion no evidence could settle is Unable to Verify, never a pass and never a failure, and the report lists it as a verification gap beside the pass rate.
The help screen for rook run lists collect as its own phase after close, and its --run option continues an existing run in place for evidence that lands later, such as spans that reach a tracing backend after the agent responds:
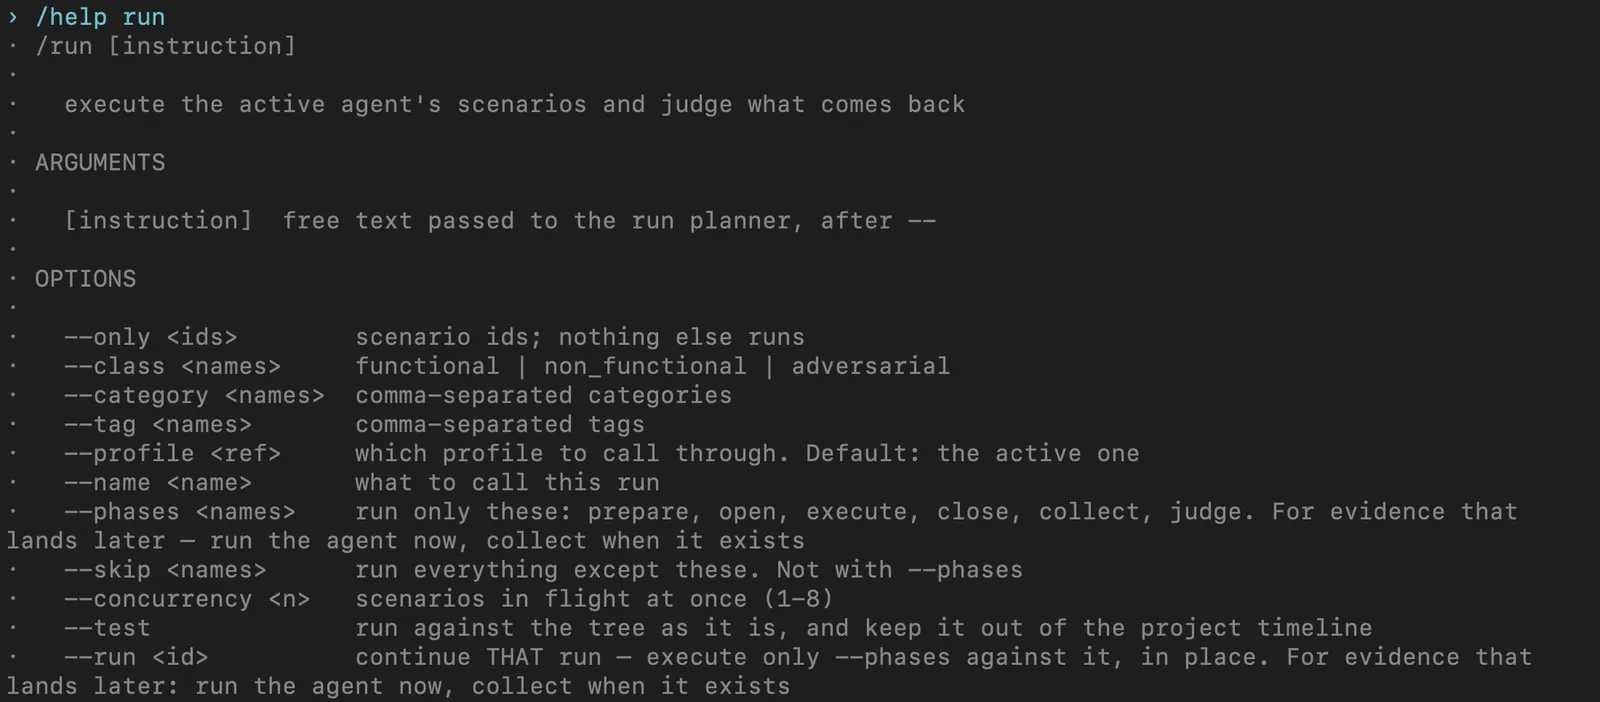
The screen above is the /help run output in Rook CLI 0.1.5, captured from a saved demo project and cropped to the options; running rook run --help on version 0.1.5 prints the same text for these options.
Next to the categories in this article, the difference is what counts as proof. Most eval and observability tools score what your agent said and recorded. Agent Assurance checks what the run changed, and reports what it could not verify.
| Agent Assurance | AI eval tools | LLM observability | |
|---|---|---|---|
| Test cases | From your code or spec | Written or synthesized | From production traces |
| Tool calls | Against declared tools | Against your lists | Logged, optionally scored |
| Side effects | Files, artifacts, probes | Scripted per task | Trace data only |
| Grading | Claimed actions aren't proof | LLM judge or code checks | LLM judge or human review |
| Adversarial tests | Generated by default | Add-on in some tools | Not generated |
| When it runs | Before release, in CI | CI and live traffic | Production, plus CI |
| Unverifiable results | Reported separately | Errors or opt-in skips | Left unscored |
The eval and observability columns describe each category's default approach, not any single product.
Agent Assurance runs from the terminal as Rook CLI, which installs from npm with Node 22 or newer:
npm install -g @testmuai/rook
rook --version
On the machine used for this article, rook --version printed 0.1.5. The Rook CLI install guide covers Homebrew and the shell installer. Run rook from the repository of the agent you want to test and point it at staging, because the agent's writes are real and are not rolled back.
In Claude Code, install the skill, then describe the test as a /rook request:
npx @testmuai/rook-skill@latest install --agent claude-code/rook Test the order-support agent in this repository with the staging profile, whose collect hook pulls each scenario's tool calls from our tracing backend. Propose up to three scenarios that check each tool call the collect hook returns against the tools the agent declares, confirm each cancelled order with a read-only order-status check, and list the writes the agent can make before invoking it.
Note: Agent Assurance grades each criterion against what a run changed and the tools your agent declares, and reports what it could not verify apart from the pass rate.
Conclusion
Start this week by instrumenting one agent path with OpenTelemetry and sending the same traces to two AI observability tools from this list, one you can self-host and one managed. Re-run the request behind your last production incident through both, and keep the one that takes you from the alert to the failing span faster.
Before the next release, also check what the agent changes in staging. The Agent Assurance quickstart runs a first test against a public sample agent, then shows how to connect your own with staging credentials.
Author

Sandeep Yadav
Blogs: 10

Sandeep Yadav is a Senior Software Engineer at TestMu AI (formerly LambdaTest), where he builds the platform's test intelligence and AI-native engineering systems. He has architected autonomous GitHub Apps, vector-search code intelligence, and self-diagnosing QA workflows, and designed distributed platforms that process 2M+ daily test executions and 1B+ events, turning high-volume test, log, and code data into intelligent, self-optimizing systems. He works on embedding reasoning models into production infrastructure to power autonomous review, root-cause analysis, and analytics workflows. He brings over four years of engineering experience with deep expertise in the Elastic Stack, Apache Kafka, and Redis. Earlier he engineered a GDPR-compliant, end-to-end-encrypted secure web-chat application at Mithi. A Facebook Hackercup 2021 Round 2 qualifier and merit-scholarship recipient, Sandeep holds a B.Tech in Electrical Engineering from Delhi Technological University.
Reviewer

Saurabh Prakash
Reviewer
Saurabh Prakash is an Engineering Manager at TestMu AI (formerly LambdaTest), where he leads engineering on agentic AI development and scalable system architecture for the quality engineering platform. He has also contributed to Test at Scale, the company's open-source test intelligence platform. He brings over 9 years of experience across Node.js, Java, Spring, MVC, data structures, algorithms, and scalable system design, with earlier roles as SDE 2 at Zomato, Senior Software Engineer at LogicHub, and Software Development Engineer at Directi. Saurabh holds a B.Tech in Computer Science and Engineering from Delhi Technological University.


AI Observability Tools FAQs
Did you find this page helpful?
More Related Blogs
TestMu AI forEnterprise
Get access to solutions built on Enterprise
grade security, privacy, & compliance
- Advanced access controls
- Advanced data retention rules
- Advanced Local Testing
- Premium Support options
- Early access to beta features
- Private Slack Channel
- Unlimited Manual Accessibility DevTools Tests