

Power Your Software Testing with AI Agents and Cloud
The Native AI-Agentic Cloud Platform to Supercharge Quality Engineering. Test Intelligently and Ship Faster.


- TestMu AI (Formerly LambdaTest)
- /
- Learning Hub
- /
- What Is AI Observability? Benefits, Tools & Best Practices
What Is AI Observability? Benefits, Tools & Best Practices
Learn what AI observability is, why it matters, and how it works. Explore tools, benefits, and practices for building reliable and trustworthy GenAI and agentic systems.
Last Updated on:
On This Page
- What Is AI Observability
- Key Benefits
- AI Test Observability
- Critical Components
- Key Metrics to Track
- RAG & Vector DBs
- How to Implement
- Evaluation vs Monitoring
- LLM-as-a-Judge
- Failure Modes & Risks
- Security & Threat Detection
- Real-Time Guardrails
- Agentic & GenAI Systems
- Testing Before Production
- Business ROI
- Emerging Trends
- Conclusion
In software engineering, observability is about collecting information from a system, like logs, metrics, and traces, so teams can clearly see how the software is running and spot issues.
But when it comes to AI, traditional observability falls short. Models are non-deterministic, producing different outputs for the same input.
AI observability is the ability to monitor, understand, and explain the behavior of AI systems across their lifecycle, covering inputs, model internals, outputs, performance, cost, and risks, so teams can detect anomalies, trace root causes, and ensure trustworthy outcomes.
Key Takeaways
- AI observability is the ability to monitor, analyze, and explain AI systems across their lifecycle, adding AI-specific signals such as model drift, bias, hallucinations, prompt behavior, and cost on top of logs, metrics, and traces.
- Traditional monitoring misses AI failures because models are non-deterministic, lose accuracy as production data drifts, and produce fluent but factually wrong answers that never raise an error.
- The five metric groups for an AI observability dashboard are token usage, model drift, response quality, latency and throughput, and cost, with Time-to-First-Token tracked separately for streaming LLM interfaces.
- RAG pipelines need their own signals: retrieval relevance, grounding and faithfulness, retrieval provenance, embedding drift, and retrieval latency measured apart from model inference time.
- Evaluation scores outputs against a curated dataset or rubric before release, monitoring watches live production traffic, and OpenTelemetry GenAI semantic conventions keep both portable across backends.
- The LLM-as-a-judge approach scores outputs against a rubric covering relevance, accuracy, tone, and safety, and the judge model needs calibration against human-labeled examples because judges favor longer answers.
- Guardrails act in real time while observability records what happened, so input guardrails screen for prompt injection and output guardrails catch toxicity and PII leakage before a response reaches the user.
- TestMu AI Agent Testing scores GenAI agent conversations on professionalism, conversation completeness, and conversation relevancy, and runs security-researcher and data-privacy personas to surface prompt-injection and leakage paths before production.
What is AI Observability
AI Observability is the ability to monitor, analyze, and explain the inner workings of AI systems across their lifecycle. Unlike traditional observability, which focuses mainly on logs, metrics, and traces, modern AI observability adds AI-specific signals such as model drift, bias, hallucinations, prompt behavior, and cost metrics.
In simple terms, it gives teams the visibility they need to answer not only "is the system running?" but also "is the AI making the right decisions for the right reasons?"
This visibility helps teams ensure that AI models are accurate, reliable, and aligned with business and compliance goals.
Without this visibility, failures like drift or hallucinations stay hidden until they reach users. With it, teams catch and resolve issues earlier in the lifecycle, reducing costly downtime, rework, and the risk of a silent regression shipping to production.
The urgency is real: the Stanford HAI 2025 AI Index reports that AI-related incidents are rising sharply, yet standardized responsible-AI evaluations remain rare among major model developers. Observability is how teams close that gap between deploying AI and actually governing it.
A model is only as trustworthy as the data feeding it, which is why AI observability pairs closely with data observability: one watches the pipelines the data moves through, the other watches what the model does with it.
Key Benefits of AI Observability
AI brings challenges that traditional monitoring can't catch. Models may give different results for the same input, lose accuracy over time due to data drift, or generate false outputs.
GenAI and AI agents add risks like prompt injections, inconsistent behavior, and rising costs. Without observability, these issues often stay hidden until they harm users or the business.
AI observability solves these problems by making the system transparent:
- Improved Quality & Reliability: Detect and fix hallucinations, drift, and regressions before they affect users.
- Faster Root Cause Analysis: Pinpoint exactly where and why failures happen, whether in input data, model logic, or external integrations.
- Better Compliance & Governance: Ensure fairness, bias checks, and explainability for regulatory requirements.
- Cost & Performance Optimization: Monitor token usage, compute resources, and latency to balance efficiency with speed.
- Stronger Security & Trust: Catch adversarial prompts, misuse in AI agents, or data privacy risks in real time.
- Continuous Improvement: Use observability insights to refine prompts, retrain models, and adapt systems to real-world changes.
What Is AI Test Observability & Why It Matters
Test observability is the practice of capturing detailed insights from test executions, going beyond simple pass or fail results.
Instead of just knowing whether a test broke, teams can understand why it broke, where it failed, and what interactions led to the issue.
In practice, test observability means transporting the same signals used in production, such as logs, traces, and metrics, into the testing process.
- Database calls made during execution
- External API requests and responses
- Feature flag toggles triggered
- Model embeddings or prompt chains generated by AI systems
This level of visibility is especially important for AI applications, and these are non-deterministic and prone to issues such as data drift, prompt regression, hallucinations, or inconsistent agent behavior.
Classic testing approaches can miss these subtle failures because they often only validate expected outputs.
The key difference is simple:
- Traditional testing tells you what failed.
- AI test observability tells you why it failed and how to fix it.
TestMu AI Test Insights applies the same idea to the test suite itself. It aggregates execution records across builds, browsers, and devices into pass/fail and stability trends, clusters similar failures by error message, and runs agentic Root Cause Analysis that correlates network, console, and framework logs to localize a likely cause. That analysis is a lead to verify, not a verdict.
Critical Components of AI Observability and Testing
Building reliable AI systems requires observability that goes deeper than infrastructure metrics. Both AI observability and test observability depend on capturing rich telemetry signals that reveal how models behave under different conditions.
The following components form the foundation:
- Input Monitoring: Validate schema, fields, drift, and outliers to prevent silent failures when production data shifts unexpectedly.
- Output Correctness: Detect hallucinations, incoherence, or bias; use semantic scoring and feedback to ensure reliable, meaningful responses.
- Performance Metrics: Track latency, throughput, GPU/CPU usage, and token costs to optimize performance and control budget overruns.
- Model Versioning: Record model lineage, track versions, and compare performance to prevent regressions and ensure transparent system behavior.
- Agent & Prompt Tracking: Capture prompts, retries, decisions, and tool calls to detect regressions, prompt injections, or failed workflows.
- Test Instrumentation: Enrich QA pipelines with logs, traces, and metrics, flagging flaky tests and drift for faster debugging.
Key Metrics to Track in AI Observability
Components tell you what to watch; metrics tell you whether the system is healthy. For AI systems, the signals that matter go well beyond CPU and memory. These five metric groups form the core of any AI observability dashboard.
| Metric Group | What to Track | Why It Matters |
|---|---|---|
| Token Usage | Token consumption per request, token efficiency, and usage patterns by prompt type. | Tokens drive both cost and latency; tracking them surfaces expensive prompts and optimization opportunities. |
| Model Drift | Shifts in response patterns, output quality, and input distribution over time. | Models degrade silently as real-world data evolves; drift detection gives an early warning before accuracy drops. |
| Response Quality | Hallucination frequency, factual accuracy, relevance, and answer consistency. | Quality is the whole point of a GenAI feature; unmonitored, a fluent but wrong answer erodes trust and creates risk. |
| Latency & Throughput | p95/p99 response time, time-to-first-token, and requests handled per second under load. | Slow AI responses kill user experience; tail latency reveals problems that averages hide. |
| Cost | Cost per inference, cost per resolved request, and spend by model or feature. | GenAI spend scales with usage; tying cost to outcomes keeps budgets predictable as traffic grows. |
Within latency, one metric deserves special attention for streaming LLM applications: Time-to-First-Token (TTFT). It measures how long the user waits before the first token of a response appears. Because most chat and copilot interfaces stream output as it generates, TTFT, not total completion time, is what users actually perceive as speed. A response that streams its first token in 300 milliseconds feels instant even if the full answer takes several seconds, whereas a high TTFT feels frozen no matter how fast the rest arrives. Track TTFT separately from end-to-end latency, since a slow first token usually points to prompt-processing or queueing delays rather than generation speed.
For the agent-specific version of this, covering the span tree to emit and how evals and traces feed each other, see the guide to AI agent observability.
Observability for RAG and Vector Databases
Most production GenAI features use retrieval-augmented generation (RAG): the model answers from documents fetched out of a vector database rather than memory alone. When a RAG answer is wrong, the model is often not the culprit; the retrieval step is. Standard model metrics will not catch that, so RAG pipelines need their own observability signals.
- Retrieval relevance: Score how well the fetched chunks match the query, so you can tell a bad answer caused by bad retrieval from one caused by the model.
- Grounding and faithfulness: Check that the response is supported by the retrieved context rather than invented, which is the core defense against RAG hallucinations.
- Retrieval provenance: Capture which documents and chunks were used for each answer, so every response is traceable and auditable.
- Embedding drift: Watch for shifts in the embedding distribution as new content is indexed, which can quietly degrade retrieval quality over time.
- Retrieval latency: Track vector search time separately from model inference, since a slow index can dominate end-to-end response time.
Instrumenting these signals turns a RAG pipeline from a black box into something you can debug step by step, which is essential before shipping retrieval-backed AI to users.
How to Architect and Implement AI Observability
Designing AI observability isn't just about picking a tool; it's about building the right architecture that can scale from early tests to full production systems.
Let's break it down:
1. Minimal Viable AI Observability Stack
Every team, no matter the size, can start small. A minimal stack typically includes:
- Data Monitoring Layer: Tracks data freshness, drift, and anomalies.
- Model Monitoring Layer: Captures performance metrics (accuracy, drift, latency, hallucinations).
- Agent Workflow Tracking: Logs prompts, tool calls, and reasoning paths for GenAI agents.
- Dashboard & Alerting: Centralized visibility with thresholds and anomaly alerts.
- Test Observability Hooks: Observability embedded into test pipelines for CI/CD.
Example Setup: A QA team using OpenTelemetry for logs, Prometheus for metrics, and Grafana dashboards to observe test runs before deploying to production.
2. Instrumentation: Logs, Traces, Events, Telemetry
Instrumentation is the backbone of observability. For AI systems, it means going beyond traditional logging.
- Logs: Capture inputs, outputs, errors, and hallucinations during test and production runs.
- Traces: Map multi-step reasoning in GenAI agents (prompt → tool → response).
- Events: Record significant state changes (e.g., data drift detected, fairness violation).
- Telemetry: Continuous signals like latency, throughput, GPU/CPU usage, and cost per inference.
Best Practice: Tag logs and traces with test IDs during CI/CD runs so failures can be correlated with observability data instantly.
3. Tools, Frameworks, Open Source vs Proprietary
Choosing the right mix depends on budget, compliance needs, and scale.
- Open Source
- OpenTelemetry: Standard for traces, logs, and metrics collection.
- Prometheus + Grafana: Metrics storage and visualization.
- WhyLabs, Evidently, Arize (OSS variants): Model monitoring and drift detection.
- Langfuse and Arize Phoenix: Open-source LLM tracing and evaluation, capturing prompts, traces, and scores for GenAI apps.
- Helicone: An open-source proxy that logs LLM requests, tokens, and cost with no code changes.
- Braintrust: An evaluation platform for scoring and comparing prompt and model versions against test datasets.
- Proprietary / Enterprise
- Dynatrace, New Relic, Datadog: Full-stack observability with AI insights.
- Arize AI, Fiddler AI, Weights & Biases: Specialized ML/LLM observability platforms.
- TestMu AI HyperExecute: AI-native test intelligence extends observability into test automation pipelines.
Tip: Start with OSS for cost efficiency. As workloads scale or compliance becomes critical, layer enterprise tools. For a tool-by-tool comparison that also tracks which tools changed owners, see the roundup of AI observability tools.
4. Embedding Observability in CI/CD / Test Pipelines
This is where most competitors stop short, but it's where teams gain the biggest quality wins.
- Step 1: Instrument Tests: Add logging, traces, and telemetry collection inside test cases.
- Step 2: Run in CI/CD: Connect test runs to observability backends (e.g., HyperExecute streaming logs to Grafana).
- Step 3: Monitor Flaky Outputs: Detect non-deterministic failures or regression drift early.
- Step 4: Feedback Loop: Feed production anomalies back into regression test suites.
Example: An LLM-powered AI chatbot is tested in CI/CD. During test runs, observability detects that latency doubles when prompts exceed 500 tokens. That insight helps teams optimize before going live.

Evaluation vs Monitoring and OpenTelemetry
Teams often blur two distinct practices. Getting the difference right decides where each quality signal belongs in your pipeline.
- Evaluation happens before and during testing. You score outputs against a curated dataset or rubric (accuracy, relevance, grounding) to decide whether a model or prompt is good enough to ship.
- Monitoring happens in production. You watch live traffic for drift, latency spikes, cost anomalies, and quality regressions on real, unlabeled inputs.
You need both: evaluation catches problems before release, and monitoring catches the ones that only appear with real users. Feeding production monitoring signals back into your evaluation sets is what turns observability into continuous improvement.
How You Integrate: SDK, Proxy, or OpenTelemetry
There are three common ways to get telemetry out of an AI application:
- SDK: Instrument the code directly for the richest, most precise traces, at the cost of code changes.
- Proxy: Route model calls through a gateway to capture telemetry with no code changes, with less application-level context.
- OpenTelemetry: Use a vendor-neutral standard so you are not locked into one backend.
OpenTelemetry now publishes GenAI semantic conventions, a standard set of span, metric, and event definitions for LLM and agent telemetry. Adopting them means tokens, model names, and prompt traces are recorded in a consistent, portable format that any compliant tool can read, which keeps your observability stack future-proof.
Implementing the "LLM-as-a-Judge" Paradigm for Automated Evaluation
You cannot manually review thousands of production traces, and simple heuristics like keyword matching miss whether an answer is actually good. The "LLM-as-a-judge" paradigm solves this by using a powerful evaluation model, such as GPT-4, to programmatically score outputs against a custom rubric, giving you automated quality measurement at scale.
The mechanism is a second, evaluator prompt. For each production trace or test output, you send the input, the model's response, and a scoring rubric to the judge model, and ask it to rate the response on the dimensions you care about:
- Relevance - does the answer address what the user actually asked?
- Accuracy - is it factually correct and, for RAG, grounded in the retrieved context?
- Tone - does it match the required voice, such as professional or empathetic?
- Safety - is it free of toxicity, bias, or policy violations?
A judge that returns a numeric score plus a short justification is far more useful than a raw number, because the reasoning tells you why an output failed. Combine LLM-as-a-judge with cheaper deterministic checks: run heuristics and automated scoring on every request, and reserve the more expensive judge model for sampled traffic or flagged cases. Two cautions keep it honest. Calibrate the judge against a set of human-labeled examples so you trust its scores, and be aware that judge models carry their own biases, such as favoring longer answers, so the rubric must be explicit. This is exactly how TestMu AI Agent Testing scores agent conversations on dimensions like professionalism, completeness, and relevancy.
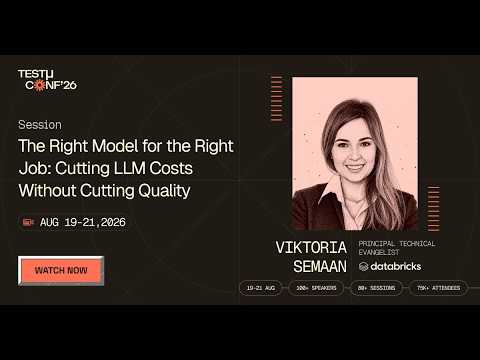
Calibrating that judge, and picking the model it runs on, is where evaluation budgets are won or lost. In this TestMu Conf 2026 session, The Right Model for the Right Job: Cutting LLM Costs Without Cutting Quality, Viktoria Semaan covers how to choose between open source, proprietary, and fine-tuned models, define custom metrics for your use case, and calibrate LLM judges.
Common Failure Modes & Risks Unique to AI Systems
AI systems don't always fail like traditional software. Instead of throwing errors, they often produce wrong or unpredictable results that can go unnoticed.
This is why AI observability is so important. Below are the most common risks teams need to track.
1. Data Drift & Concept Drift
The data your model sees in production changes over time. Inputs may look different (data drift) or their meaning changes (concept drift).
- Why it matters: Even accurate models can lose performance silently as real-world data evolves.
- Example: A retail demand forecast trained on last year's patterns may mispredict sales after a major event (like COVID-19). Observability helps detect these shifts early.
2. Model Regression & Prompt Regression
A new model version or a prompt change works worse in some cases, even if overall metrics improve.
- Why it matters: Regressions can quietly break business-critical workflows.
- Example: An updated chatbot answers general questions better but starts failing on refund-related queries. Test observability catches the regression by comparing outputs across versions.
3. Hallucinations & Misleading Outputs
Generative AI produces fluent but factually wrong answers.
- Why it matters: Hallucinations damage user trust and may cause compliance or legal risks.
- Example: A financial assistant confidently invents non-existent stock data. With Gen AI observability, these cases can be flagged during testing.
4. Bias & Fairness Issues
AI models may give results that are unfair to certain groups because of biased training data.
- Why it matters: Biased outputs harm users, reputations, and may violate regulations.
- Example: A hiring model ranks resumes differently based on gender. With observability, QA teams can test demographic slices and uncover bias early.
5. Performance Degradation & Latency
Models slow down, consume more compute, or fail under heavy load.
- Why it matters: Latency and downtime hurt user experience and increase costs.
- Example: An LLM responds in 2 seconds in testing but slows to 10 seconds during peak traffic. Observability surfaces these spikes so teams can fix scaling issues.
6. Agent & Orchestration Failures
Multi-step AI agents fail to complete workflows or call tools in the wrong order.
- Why it matters: Most real-world AI failures come from orchestration, not the model itself.
- Example: A travel-booking agent searches for flights but never confirms the booking. AI agent observability traces each step, making it clear where the workflow broke.
7. Security & Privacy Risks
Attacks like prompt injection or accidental leaks of sensitive data (PII).
- Why it matters: Security and privacy failures can cause compliance violations (GDPR, HIPAA) and major reputational damage.
- Example: A malicious user enters a crafted prompt to reveal hidden system instructions. Test observability simulates such attacks before they reach production.
AI Observability for Security and Threat Detection
Observability is also a security control. Many AI attacks, including prompt injection, jailbreaks, and data exfiltration, never trip traditional health metrics: CPU, uptime, and latency stay green while the agent is quietly compromised. The only way to catch them is to watch AI-native signals.
- Prompts and responses: The earliest place an injection or jailbreak shows up, often before any attack signature exists.
- Tool invocations and retrieval provenance: Spot an agent calling the wrong tool or acting on poisoned retrieved content.
- Trust-boundary violations: Flag when untrusted input crosses into a privileged action, such as sending data or executing a transaction.
- PII and secret leakage: Detect sensitive data appearing in inputs or outputs in real time.
- Multi-turn escalation: Catch attacks that build slowly across a conversation rather than in a single malicious message.
Monitoring alone is reactive, so pair it with adversarial testing. TestMu AI Agent Testing runs security-researcher and data-privacy personas against your agents to surface prompt-injection and leakage paths before they reach production.
Real-Time Guardrails: Preventing Toxicity, PII Leakage, and Security Threats
Observability tells you what went wrong after the fact; guardrails stop it as it happens. A guardrail is an active safety layer that sits between the user and the model, inspecting inputs and outputs in real time and blocking, redacting, or rewriting anything that violates policy before it reaches the user or the model.
Guardrails operate on both sides of the model:
- Input guardrails - screen incoming prompts for prompt injection, jailbreak attempts, and disallowed requests before the model ever sees them.
- Output guardrails - scan generated responses for toxicity, bias, and PII or PHI leakage, redacting or blocking them before they reach the user.
Dedicated tooling has emerged for this layer. Llama Guard is a safety classifier model that categorizes prompts and responses against a taxonomy of harms, and NeMo Guardrails is a toolkit for defining programmable rails that constrain what an application can say and do. Together with observability, they form a closed loop: guardrails block threats in real time, and observability records every block so you can see attack patterns, tune the rules, and prove compliance. The two are complementary, not alternatives, and production GenAI systems in regulated domains need both.
AI Observability for Agentic Workflows & GenAI Systems
GenAI is shifting from static models to autonomous agent workflows, adopted across startups and enterprises.
Powering use cases like AI chatbots in customer support, lead qualification in sales, IT ticket resolution, virtual care in healthcare, fraud monitoring in finance, and shopping assistants in e-commerce, and so much more.
Wherever these agents interact, with humans or other agents, they must remain observable, auditable, and reliable. The guide to AI agent monitoring covers the production signals and alerts for agents that call tools and change records.
And as discussed in the previous section, these AI systems don't fail like traditional software; they often exhibit unpredictable behaviors, a lack of context awareness, hallucinations, misleading outputs, and gaps in testing coverage, making observability essential for trust and safety.
AI observability, like TestMu AI's Agent Testing, goes beyond just running test cases. It provides insights into how GenAI agents perform across conversations, ensuring reliability and trust at scale by scoring and monitoring interactions on dimensions such as:
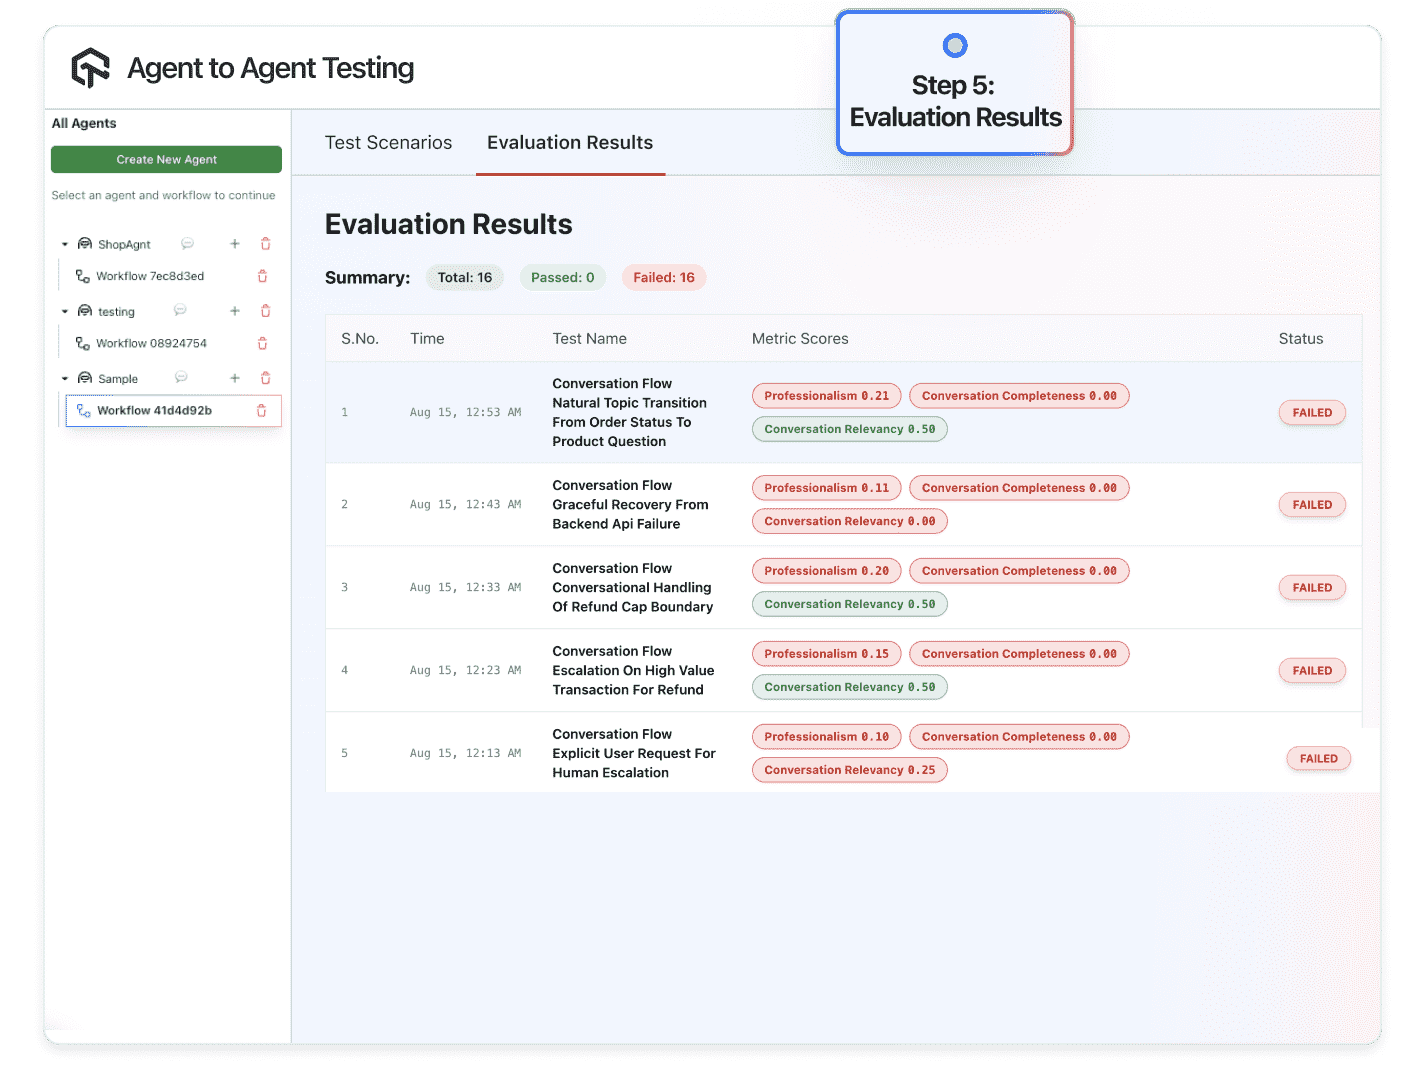
- Professionalism: Tracks tone, politeness, and adherence to expected communication standards.
- Conversation Completeness: Detects unfinished or abruptly ended conversations, signaling gaps in agent logic or memory.
- Conversation Relevancy: Measures how well responses align with user intent and context, surfacing issues like drift or hallucination.
These metrics act as observability signals for teams. They highlight weak spots in AI agents, allow continuous fine-tuning, and make it easier to detect failures early, before they impact customers or workflows.

Note: Monitor, score, and debug your AI agents across thousands of real-world scenarios with TestMu AI Agent Testing. Start testing for free!
Pre-Release Testing for Agents That Act With Agent Assurance
Conversation scores judge what an agent says, and production traces show what it did only after it has done it. When an agent calls tools, writes files, or hits APIs, you also need a test that checks the effect before release. TestMu AI's Agent Assurance covers agents that act, and it is not observability: it runs a suite against your agent before you ship and does not watch production traffic.
- Orchestration failures before launch - the travel-booking agent that searches but never confirms is the kind of case a scenario catches, because a criterion such as a confirmed booking is graded on the tool calls the agent made and the artifacts it produced, not on its own summary.
- Trust boundaries probed on purpose - where the Agent Testing personas above probe what an agent says, these adversarial scenarios try prompt injection, instruction override, tool misuse, and exfiltration attempts against an agent that acts, with its tool calls checked against its declared tool surface.
- Flaky results apart from regressions - results that flip with the scenario unchanged are reported separately from regressions, and each run shows what is newly failing and newly fixed.
- An explicit assurance gap - a criterion the run could not check gets Unable to Verify, which stays out of the pass rate and is reported beside it, never counted as a pass or a failure.
Agent Assurance runs from the terminal as rook, and you can drive it from Claude Code in the agent's repository. Install the skill, type /rook in a Claude Code session, and describe what to test; Claude Code's own approvals still apply, and loading /rook does not authorize shell commands or writes to the target.
npx @testmuai/rook-skill@latest install --agent claude-codeA bounded request for the booking example might read:
/rook Test the travel-booking agent in this repository for workflows that stop after the flight search without confirming a booking. Use the staging profile, propose up to three scenarios, and show me the possible writes before invoking the target.The skill is not the CLI, so install rook separately; the Claude Code setup guide covers both. The agent's writes are real, so run it against staging, not live traffic.
Measuring the Business ROI of AI Observability
Observability is easier to fund when it is framed as return on investment rather than engineering hygiene. Every technical signal maps to a business outcome, and three mappings make the case clearly.
| Observability signal | Business value |
|---|---|
| Token tracking and prompt-level cost | Identifies expensive prompts and enables prompt caching to cut LLM API spend directly. |
| Hallucination and quality monitoring | Prevents brand damage and legal risk from a confidently wrong answer reaching a customer. |
| Latency and TTFT tracking | Protects conversion and retention, since slow AI responses drive users away. |
| Drift detection | Avoids the silent revenue leak of a model degrading unnoticed in production. |
The cost lever is the most immediate. Token tracking shows which prompts and which repeated queries dominate spend, which is what justifies prompt caching: storing and reusing responses for identical or near-identical requests so you stop paying to regenerate the same answer. Teams routinely cut a meaningful share of their LLM API bill this way once observability shows them where the tokens go.
The risk lever is larger but less visible. A single hallucinated answer, a leaked PII record, or a toxic response can cost far more in brand and compliance terms than a year of monitoring. Framing observability as insurance against those events, plus a direct cut to API cost, is how the investment gets approved.
Emerging Trends & The Future of AI Observability
The next wave of observability is not about dashboards; it is about making AI systems explainable, auditable, and aligned with organizational intent:
1. From Model Monitoring to Agent Observability
AI is shifting from static models to agentic ecosystems, where multiple AI agents interact with each other, external tools, and APIs. This creates emergent complexity that traditional observability cannot capture.
Future observability will need to map the full lifecycle of agent reasoning, ensuring every decision is traceable and auditable. The question will no longer be "Did the model run?" but "Did the network of agents collaborate as intended, and can we prove it?"
2. From Input-Output to Intent-Outcome Alignment
Most monitoring today focuses on inputs and outputs. But AI failures often occur when outputs technically look "right" but fail to meet the underlying intent. Tomorrow's observability must evolve to measure business alignment, not just technical correctness.
This means linking AI responses to real outcomes, resolution of a customer issue, compliance with policy, or alignment with strategic KPIs. Observability will become the mechanism that verifies whether AI is creating measurable value.
3. Observability as the Backbone of Responsible AI
With the rise of the EU AI Act, SEC guidelines, and sector-specific mandates in finance and healthcare, explainability will become a non-negotiable observability feature.
Organizations will be expected to produce audit-ready trails of every decision: which data influenced it, which model version was used, and why a specific outcome was generated.
Beyond compliance, explainability will evolve into a trust currency, the difference between AI systems that are adopted and those that are rejected by users, regulators, and boards.
4. Real-Time Observability as a Strategic Differentiator
In AI-driven systems, problems compound in seconds, not days. Drift, bias, and hallucinations can damage trust faster than teams can respond with traditional tools. The future lies in real-time, continuous observability, where issues are detected and addressed instantly.
This transforms observability from a safety net into a competitive differentiator; organizations that can course-correct in real time will outpace those that cannot.
Conclusion
Start where the risk is highest: instrument your AI test pipeline so logs, traces, and metrics flow into one place, then add drift and hallucination checks on the outputs that matter most. From there, extend the same signals into production monitoring so issues surface before users feel them.
TestMu AI brings this into your existing workflow: Agent Testing scores and monitors GenAI agent interactions, while HyperExecute streams test logs and traces straight from CI/CD. Follow the HyperExecute getting started docs to wire observability into your first run.
In an era defined by GenAI and autonomous agents, observability is what separates AI that simply works from AI you can trust, audit, and improve.
Note: Bhavya Hada, Community Contributor at TestMu AI with expertise in software testing and automation testing, reviewed, fact-checked, and approved this article, which was researched and drafted with AI assistance. Our editorial process and AI use policy describes how every claim is verified before publication.
Author

Sandeep Yadav
Blogs: 10

Sandeep Yadav is a Senior Software Engineer at TestMu AI (formerly LambdaTest), where he builds the platform's test intelligence and AI-native engineering systems. He has architected autonomous GitHub Apps, vector-search code intelligence, and self-diagnosing QA workflows, and designed distributed platforms that process 2M+ daily test executions and 1B+ events, turning high-volume test, log, and code data into intelligent, self-optimizing systems. He works on embedding reasoning models into production infrastructure to power autonomous review, root-cause analysis, and analytics workflows. He brings over four years of engineering experience with deep expertise in the Elastic Stack, Apache Kafka, and Redis. Earlier he engineered a GDPR-compliant, end-to-end-encrypted secure web-chat application at Mithi. A Facebook Hackercup 2021 Round 2 qualifier and merit-scholarship recipient, Sandeep holds a B.Tech in Electrical Engineering from Delhi Technological University.
Reviewer

Ankit Mathur
Reviewer
Ankit Mathur is Vice President of Engineering at TestMu AI (formerly LambdaTest), leading platform engineering across the testing cloud. He scaled the platform's backend services to handle 60M+ HTTP requests per day through horizontal scaling, network-layer optimization for faster test execution on the cloud grid, and database and AWS infrastructure tuning. He brings 10+ years in distributed systems engineering, with earlier roles at Sumo Logic and Adobe, where he worked on Adobe Sign and holds a US patent for storing and protecting signatures and images in electronic documents. Ankit holds a postgraduate diploma in advanced computing and a B.Tech in Information Technology.


AI Observability FAQs
Did you find this page helpful?
More Related Learning Hubs
TestMu AI forEnterprise
Get access to solutions built on Enterprise
grade security, privacy, & compliance
- Advanced access controls
- Advanced data retention rules
- Advanced Local Testing
- Premium Support options
- Early access to beta features
- Private Slack Channel
- Unlimited Manual Accessibility DevTools Tests