
Agent Assurance for your AI Deployment
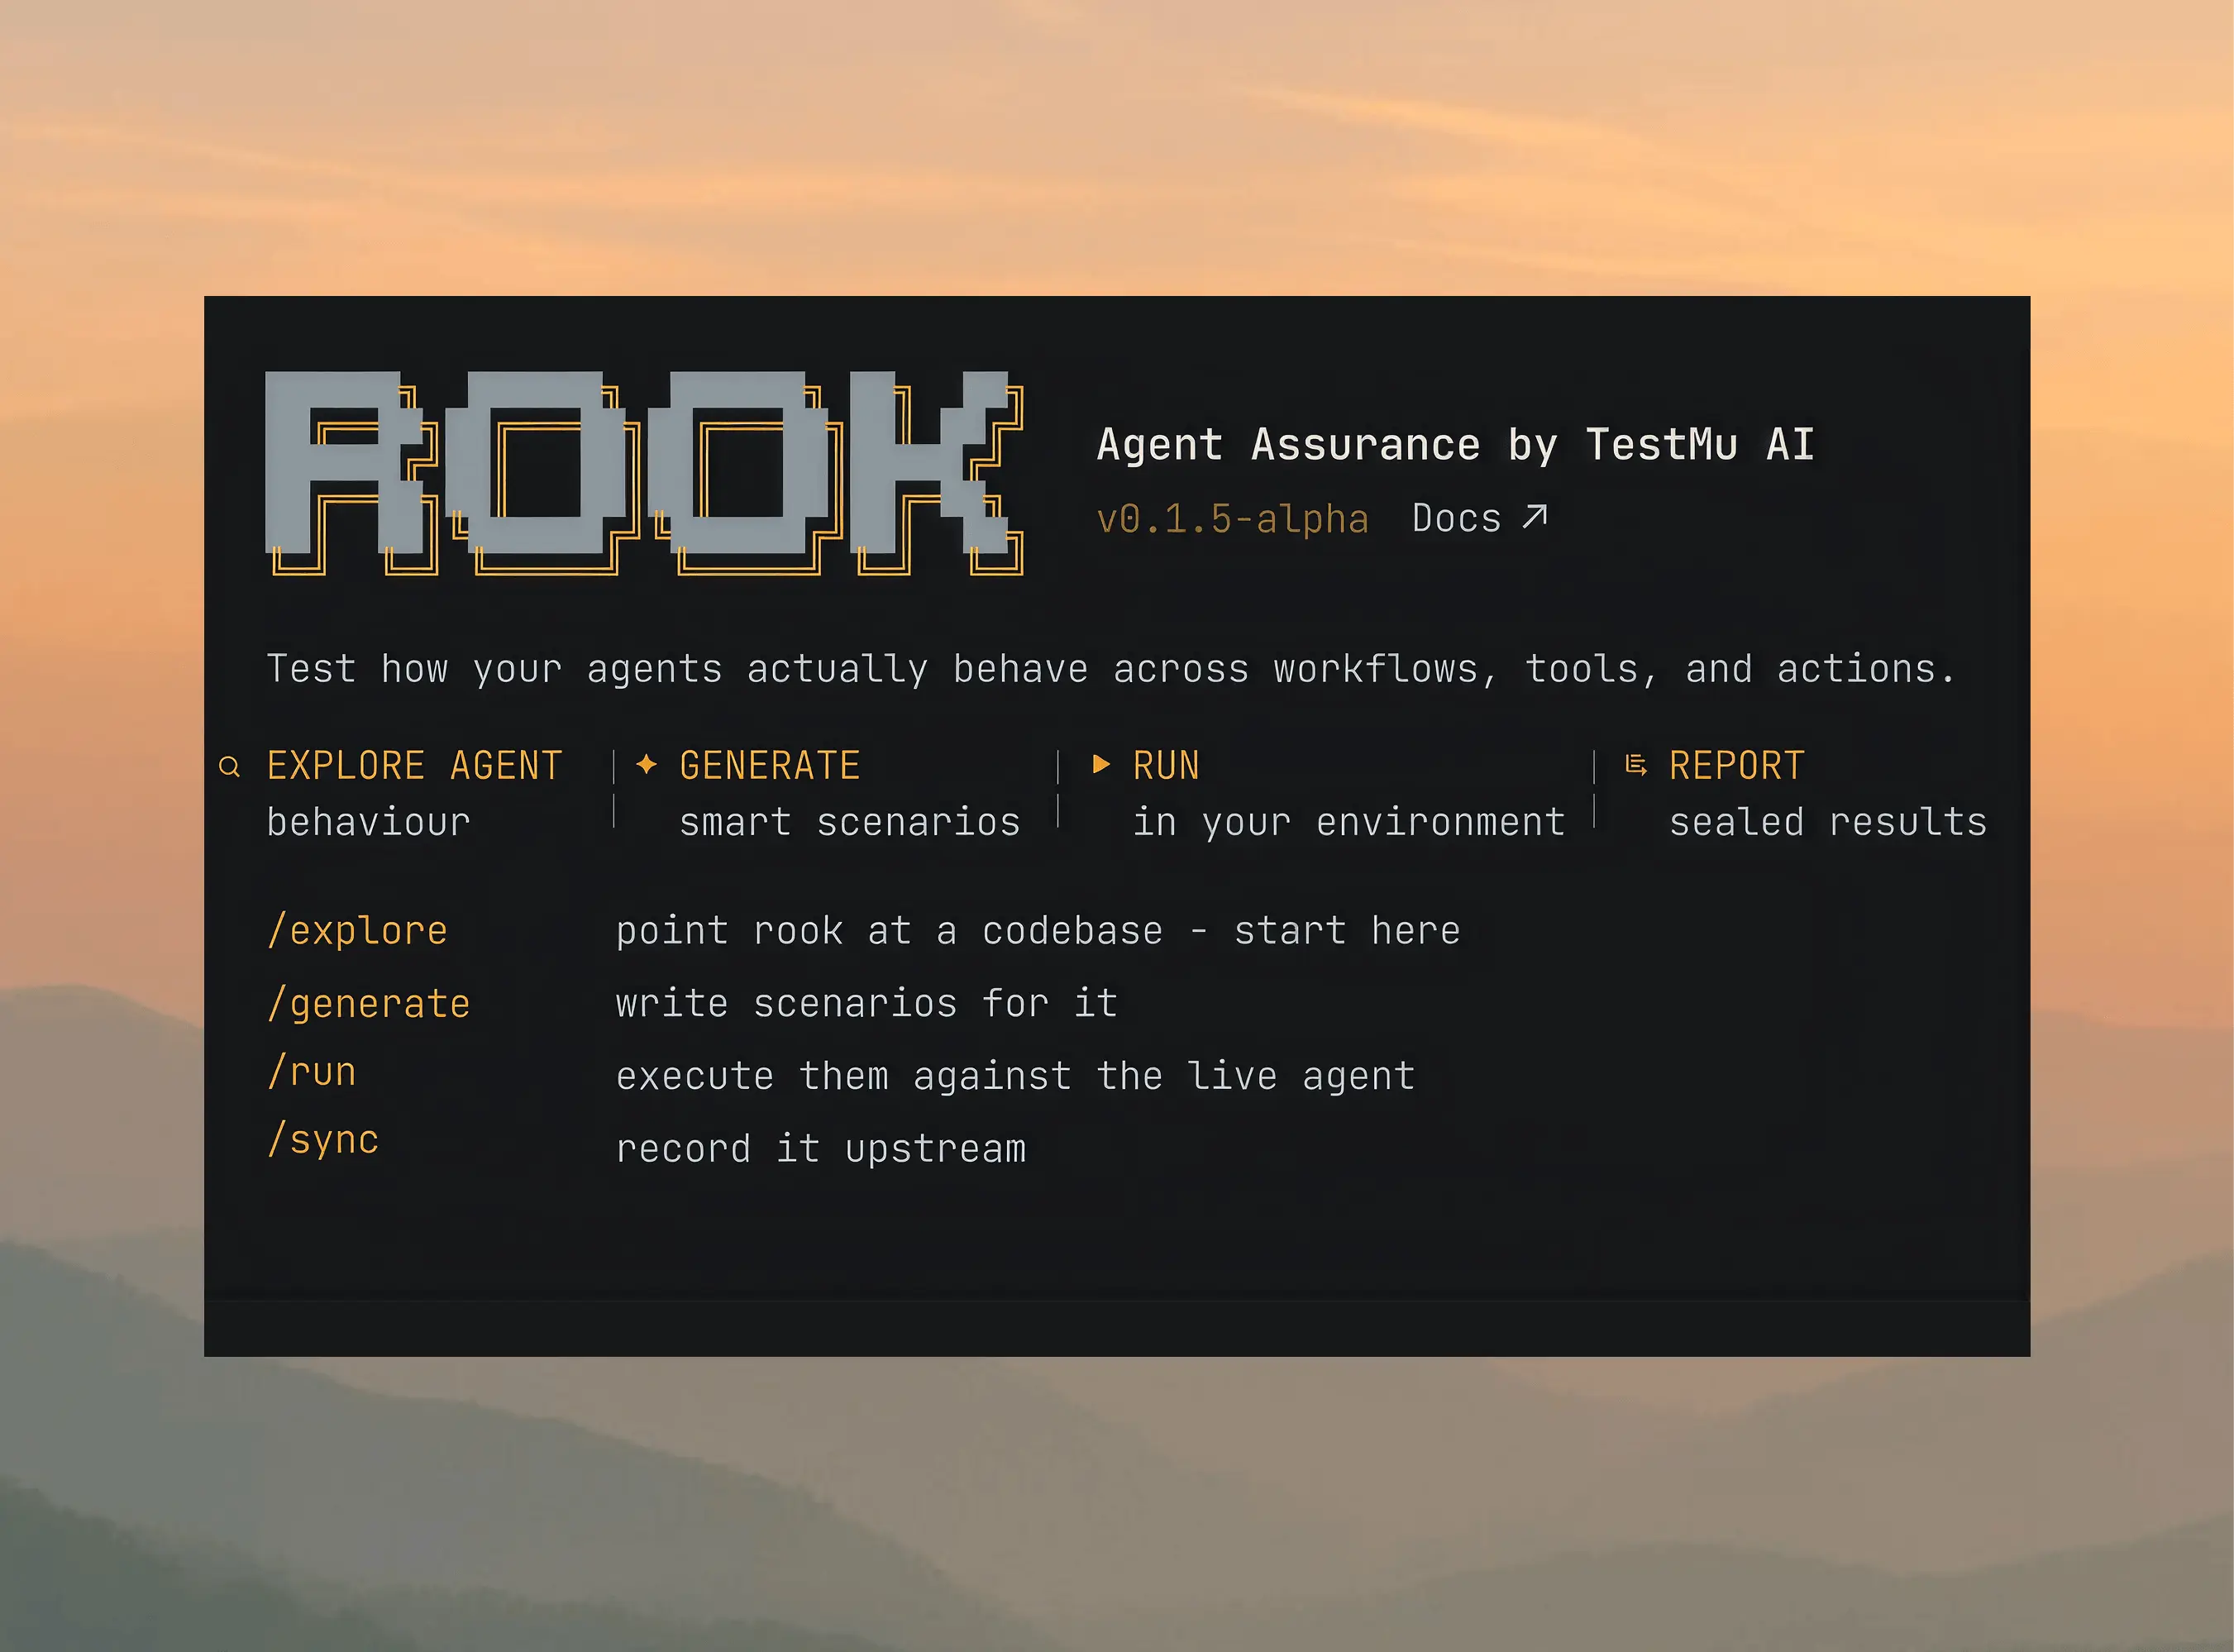
Test how your agents actually behave across workflows, tools, and actions. Catch failures and vulnerabilities before they ship.
npm install -g @testmuai/rook
- TestMu AI (Formerly LambdaTest)
- /
- Learning Hub
- /
- OpenTelemetry LLM Metrics Taxonomy: GenAI Names and Status
OVERVIEW
On 2026-10-19 the OpenTelemetry LLM metrics taxonomy on the main branch of the OpenTelemetry GenAI semantic conventions repository held 19 gen_ai.* metrics for LLM apps and agents, every one marked Development, in a repository with no tagged release. The v1.41 releases were the last before the GenAI metrics were deprecated: the v1.41.0 GenAI metrics doc lists 7, the v1.41.1 patch kept the same definitions, and since then the main branch has renamed two of the seven and replaced a third, the gen_ai.client.token.usage histogram.
The tables below list every name at both points, with its instrument, unit, buckets and attributes, so you can pick the names your pipeline emits and know which ones will move.
Overview
OpenTelemetry LLM metrics are the histograms and counters that OpenTelemetry's GenAI semantic conventions define for applications that call language models. The released v1.41.0 and its v1.41.1 patch define 7 GenAI metrics; the unreleased main branch of the semantic-conventions-genai repository, read on 2026-10-19, held 19 gen_ai.* metrics, all at Development status.
OpenTelemetry GenAI Metric Families
- Which OpenTelemetry metrics time an LLM call?: In the released OpenTelemetry v1.41.0 conventions, gen_ai.client.operation.duration times the whole call from the application's side, including the network, and two streaming histograms time the first chunk and each later chunk.
- What is gen_ai.client.token.usage?: The released OpenTelemetry v1.41.0 token metric, gen_ai.client.token.usage, is one histogram split into input and output by the gen_ai.token.type attribute, and OpenTelemetry's own Python GenAI helper still created it on 2026-10-19.
- What replaced gen_ai.client.token.usage?: On the unreleased main branch of semantic-conventions-genai, per-call distributions move to two histograms and token totals move to five counters, which have no bucket boundaries, for input, output, cache read, cache write and reasoning tokens.
- Can apps calling a hosted model API record gen_ai.server metrics?: No. The three OpenTelemetry gen_ai.server metrics, for request duration, time to first token and time per output token, are for teams that run a model server, and a hosted provider's servers are not yours to instrument.
- OpenTelemetry agent, workflow and tool metrics: Five OpenTelemetry GenAI metrics on the unreleased semantic-conventions-genai main branch time workflow runs, agent invocations and tool executions and count the model calls and client-side tool calls one agent invocation makes, and none of them exists in v1.41.0.
Status, Cost and Releases
- Are the OpenTelemetry GenAI metric names final?: No. Every GenAI metric in semantic-conventions v1.41.0 and on the semantic-conventions-genai main branch is marked Development, so record the release or commit your instrumentation follows.
- Does OpenTelemetry define a cost metric for LLM calls?: No. Neither the v1.41.0 registry nor the main-branch GenAI registry has a cost metric or a cost attribute, and the main-branch token metrics doc calls its usage counters a proxy for cost approximation.
- Last released GenAI metric names: OpenTelemetry semantic-conventions v1.41.0 of 2026-04-28 and its v1.41.1 patch of 2026-05-11 define 7 GenAI metrics and were the last releases before v1.42.0 of 2026-06-12 deprecated every gen_ai.* definition and moved it to the semantic-conventions-genai repository.
- Unreleased main-branch GenAI metric names: The semantic-conventions-genai main branch at commit 547934afa90a, read on 2026-10-19, held 19 gen_ai.* metrics, all at Development status, besides its 4 mcp.* metrics, in a repository with no tag or release.
- Testing side effects that LLM metrics miss: Before release, TestMu AI's Agent Assurance checks what an agent's tool calls changed through Rook CLI, which is pre-alpha and should be pointed at staging, and each criterion comes out Pass, Fail or Unable to Verify.
What Are OpenTelemetry LLM Metrics, and How Do They Differ From Spans and Events?
OpenTelemetry LLM metrics are the histograms and counters that OpenTelemetry's GenAI semantic conventions define for applications that call language models: a fixed name such as gen_ai.client.operation.duration, an instrument type, a unit, attributes with requirement levels and, for histograms, recommended bucket boundaries. Because every library that follows the conventions uses the same names, one dashboard can read metrics from any of them.
Metrics are one of three GenAI signals. The GenAI conventions overview lists metrics, spans and events, and marks the whole set with the status Development. OpenTelemetry for LLM apps usually means wiring all three:
| Signal | What it records for an LLM app | Where it is covered |
|---|---|---|
| Metrics | Aggregated numbers: call durations, streaming latency, token counts, agent and tool timings, cut by model, provider and error type | This page |
| Spans | One timed record per model call, agent invocation and tool call (chat, invoke_agent, execute_tool), joined into a trace | AI agent tracing |
| Events | Optional captures of model inputs and outputs, and evaluation results as gen_ai.evaluation.result | The limits section below |
Use metrics for questions about rates and percentiles across thousands of calls, and spans for questions about one request. Several metric definitions tie the two together: the client inference conventions, for one, say that when the call duration metric is reported alongside its span, the metric value should be the same as the span duration.
OpenTelemetry LLM Metrics Taxonomy Table: Every GenAI Metric Name, Unit and Bucket
The table lists every GenAI metric on the main branch, grouped by family, with the name the same measurement had in the v1.41.0 release. Buckets are the ExplicitBucketBoundaries the docs recommend, in seconds for durations and in counts otherwise; counters have none.
| Family | Metric on main (unreleased) | Instrument, unit | Buckets | Name in v1.41.0 (released) |
|---|---|---|---|---|
| Client | gen_ai.client.operation.duration | Histogram, s | 0.01 to 81.92 | Same name, then used for every operation including inference |
| Client | gen_ai.client.inference.duration | Histogram, s | 0.01 to 81.92 | None; inference was timed by gen_ai.client.operation.duration |
| Client | gen_ai.client.inference.time_to_first_chunk | Histogram, s | 0.01 to 81.92 | gen_ai.client.operation.time_to_first_chunk |
| Client | gen_ai.client.inference.time_per_output_chunk | Histogram, s | 0.01 to 81.92 | gen_ai.client.operation.time_per_output_chunk |
| Token | gen_ai.client.inference.usage.input_tokens | Counter, {token} | None (counter) | gen_ai.client.token.usage with gen_ai.token.type input |
| Token | gen_ai.client.inference.usage.output_tokens | Counter, {token} | None (counter) | gen_ai.client.token.usage with gen_ai.token.type output |
| Token | gen_ai.client.inference.usage.cache_read.input_tokens | Counter, {token} | None (counter) | None |
| Token | gen_ai.client.inference.usage.cache_write.input_tokens | Counter, {token} | None (counter) | None |
| Token | gen_ai.client.inference.usage.reasoning.output_tokens | Counter, {token} | None (counter) | None |
| Token | gen_ai.client.inference.operation.input_tokens | Histogram, {token} | 1 to 67,108,864 | gen_ai.client.token.usage, input values |
| Token | gen_ai.client.inference.operation.output_tokens | Histogram, {token} | 1 to 67,108,864 | gen_ai.client.token.usage, output values |
| Server | gen_ai.server.request.duration | Histogram, s | 0.01 to 81.92 | Same name |
| Server | gen_ai.server.time_to_first_token | Histogram, s | 0.001 to 10 | Same name |
| Server | gen_ai.server.time_per_output_token | Histogram, s | 0.01 to 2.5 | Same name |
| Workflow | gen_ai.invoke_workflow.duration | Histogram, s | 1 to 7,200 | None |
| Agent | gen_ai.invoke_agent.duration | Histogram, s | 0.1 to 409.6 | None |
| Agent | gen_ai.invoke_agent.inference_calls | Histogram, {inference_call} | 1 to 128 | None |
| Agent | gen_ai.invoke_agent.tool_calls | Histogram, {tool_call} | 1 to 128 | None |
| Tool | gen_ai.execute_tool.duration | Histogram, s | 0.01 to 81.92 | None |
The table was built by a Node script that, on 2026-10-19, downloaded the model files and Markdown docs of both refs: semantic-conventions at tag v1.41.0, and semantic-conventions-genai at commit 547934afa90a of 2026-10-18, the head of main when read. The header and summary lines it printed (per-metric lines omitted):
Read 2026-10-19 from github.com/open-telemetry
genai main 547934afa90a, 2026-10-18
genai tags 0, releases 0
semantic-conventions v1.41.0, 2026-04-28

RELEASED v1.41.0: 7 metrics
  stability development 7
  token 1 | client 3 | server 3

MAIN 547934afa90a (unreleased): 19 metrics
  stability development 19
  client 4 | server 3 | agent 5 | token 7
A patch release, semantic-conventions v1.41.1 of 2026-05-11, also exists. A byte comparison run on 2026-10-19 found its GenAI metrics model file identical to the one in v1.41.0, so the released names are the same in both.
GenAI Client Inference Metrics: Duration, Time to First Chunk and Time per Output Chunk
Client metrics are recorded by your application or the SDK wrapper it uses, so each duration includes the network, any gateway, and the provider's queue. The main branch's client inference conventions define what each clock covers and give the duration and streaming histograms one bucket list, doubling from 0.01 s to 81.92 s across 14 boundaries:
- Call duration -
gen_ai.client.inference.durationruns "from when the client issues the inference request to when the response is fully received or the operation ends with an error or cancellation". In v1.41.0 the same measurement isgen_ai.client.operation.duration. - First chunk -
time_to_first_chunkruns from the request "to when the first chunk is received in the response stream", and both refs say it SHOULD be reported for streaming calls only. - Each later chunk -
time_per_output_chunkis "recorded for each chunk received after the first one", from the end of the previous chunk to the end of the current one, so one streamed reply adds many observations. - Other operations - on main,
gen_ai.client.operation.durationstays for operations that are not inference, and its note says it "SHOULD NOT be reported for inference operations".
A chunk is whatever the provider's stream sends, which may hold one token or several, so time per output chunk is not the same number as time per output token.
Time to first chunk is the client-side view of time to first token: the wait a user sees before text starts to appear. The server-side counterpart is described in the model server section.
GenAI Token Metrics: Usage Counters and Per-Operation Histograms
The released v1.41.0 conventions record tokens in one histogram, gen_ai.client.token.usage, with a required gen_ai.token.type attribute of input or output. The main branch's inference token metrics split that job into two families:
- Usage counters - five monotonic counters (input, output, cache read, cache write, reasoning) that the doc calls "the primary instruments for measuring token consumption" and "a proxy for cost approximation". Each is broken down by
gen_ai.token.modality: text, image, audio or unknown. - Cache and reasoning subsets - cache read and cache write tokens are a subset of input tokens, and reasoning tokens a subset of output tokens, so never add them to the totals.
- Per-operation histograms -
gen_ai.client.inference.operation.input_tokensandoutput_tokensshow how tokens are spread across calls. The doc says they "should not be used for total usage or cost calculations"; use them for p95 and p99 per call. - Billable tokens - when a provider reports both used and billable tokens, instrumentation "MUST report billable tokens", and a failed call is recorded as
0when no usage came back.
There is no cost metric. The same script parsed both attribute registries and searched them for the word cost; its output also shows that gen_ai.token.type is gone from main and gen_ai.token.modality is new:
registry: 79 gen_ai attributes
  keys containing "cost": 0
  lines containing "cost": 0
  gen_ai.token.modality: text, image, audio, unknown
  gen_ai.token.type: absent
v1.41.0 gen_ai.token.type: input, output
v1.41.0 keys containing "cost": 0
v1.41.0 gen_ai.token.modality: absent
To chart spend, multiply the input and output counters by your own per-model price table, pricing the cache-read and cache-write shares of input tokens at their own rates where your provider does: input minus cache reads and writes at the input price, and each cache share at its own price. Keep the price table outside the metrics so a price change does not rewrite history.
Why Do OpenTelemetry Token Histograms Have No Modality Breakdown?
The inference token metrics doc keeps modality on the counters and off the per-operation histograms, because "percentiles across modalities do not add up". The token metrics design note works through the same example as that doc: 100 identical operations with 300 input tokens each, 100 text and 200 image, for which a modality split returns a p95 of 200 instead of 300.
A second script reproduced that example and added the view a dashboard actually gets: a p95 computed from bucket counts with the spec's token buckets, interpolated the way Prometheus does for classic histograms. Its output:
100 operations, 100 text + 200 image tokens each
p95 of input tokens per operation
                       exact    from buckets
one series per op      300      985.6
split by modality      200      246.4

300 falls in bucket (256, 1024]
usage counters, sum over modality: 30000 tokens
In the script's output, the exact values match the doc: 300 per operation, and 200 once each modality is its own series. The token buckets grow by a factor of four, so all 100 values of 300 share the bucket from 256 to 1,024, and because Prometheus histogram_quantile "assumes a uniform distribution of observations within the bucket", the interpolated p95 lands at 985.6, more than three times the true value. Summed over modality, the usage counters give the exact total of 30,000 tokens, which is why the token doc sends totals to the counters and keeps the histograms for distributions.
Read a token percentile from these histograms as a bucket range. If you need exact per-call figures for a few high-value calls, take them from the span attributes instead.
GenAI Model Server Metrics: Request Duration, Time to First Token and Time per Output Token
The three gen_ai.server metrics are for teams that run a model server, and their names did not change between v1.41.0 and main. The GenAI metrics doc says server time to first token "helps measure the time spent in the queue and the prefill phase", and gives it the finest buckets in the set, from 0.001 s to 10 s.
| Question | Client metric (v1.41.0 name) | Server metric | Gap between them |
|---|---|---|---|
| How long did the call take? | gen_ai.client.operation.duration | gen_ai.server.request.duration | Network, gateways and anything outside the server |
| When did output start? | gen_ai.client.operation.time_to_first_chunk | gen_ai.server.time_to_first_token | Network, plus any buffering before the first chunk is sent |
| How fast did output flow? | gen_ai.client.operation.time_per_output_chunk | gen_ai.server.time_per_output_token | Chunks can hold several tokens, and the server records one per-request average while the client records every chunk |
| Which calls count? | The duration metric counts every call, with error.type on failures | Time to first token and time per output token cover successful responses only | Server time-to-first-token and per-token charts hide failed requests |
If you call a hosted model API, you cannot record the server metrics: the provider's servers are not yours to instrument. Chart the client metrics, and when you also run your own inference engine, put client and server panels side by side so the gap points at the network or at the engine.
OpenTelemetry GenAI Agent, Workflow and Tool Metrics
None of the five agent-level metrics exists in v1.41.0; all are in the main-branch metrics model file. Workflow runs get the longest duration buckets in the set and agent invocations the next longest; the taxonomy table above lists the boundaries.
- gen_ai.invoke_workflow.duration - one workflow run, "a coordinated process composed of multiple agents or other operations involving generative AI", from the call that starts it to completion.
- gen_ai.invoke_agent.duration - one in-process agent invocation, until the agent emits the last chunk of its final response or fails; meant for agent frameworks that can bound a single invocation.
- gen_ai.invoke_agent.inference_calls - how many model calls one invocation made, failed calls included. Calls made by sub-agents are counted against those agents, so each call is counted once across the tree.
- gen_ai.invoke_agent.tool_calls - how many tool calls one invocation triggered. Only client-side tools count; a provider's built-in web search or code execution does not.
- gen_ai.execute_tool.duration - one tool execution, with
gen_ai.tool.nameas a required attribute, so you can chart p95 latency per tool.
A rising high percentile of model calls per invocation, with no change in traffic, can be a sign that an agent has started looping or retrying its own model calls. A threshold set from a baseline turns a signal like that into an alert, which is how AI monitoring catches drift in production.
Required and Recommended Attributes on GenAI Client Inference Metrics
Attributes decide which ways you can cut a metric. For the client inference metrics, the main-branch docs set these requirement levels; the GenAI attribute registry defines each value, and the script counted 79 gen_ai attributes in it.
| Attribute | Requirement level | Stability | Example values |
|---|---|---|---|
gen_ai.operation.name | Required | Development | chat, generate_content, text_completion |
gen_ai.provider.name | Required | Development | openai, gcp.vertex_ai, aws.bedrock |
error.type | Conditionally required, if the operation ended in an error; not on the two streaming metrics | Stable | timeout, or the provider's error code |
gen_ai.request.model | Conditionally required, if available | Development | The exact model name requested |
gen_ai.response.model | Recommended | Development | The model version that answered |
server.address, server.port | Recommended; port conditionally required if the address is set | Stable | The host and port behind any proxy, when known |
gen_ai.token.modality | Required on the usage counters only | Development | text, image, audio, unknown |
- Low cardinality - the docs ask for
error.typeto be "another low-cardinality error identifier" when no error code fits. Never put a request ID, user ID or prompt text on a metric attribute; each new value creates a new time series. - Request versus response model - a request for an alias can be answered by a dated model version, so chart regressions by
gen_ai.response.modelwhen you have it. - Prompt versions - a prompt version changes more often than a model and belongs on spans, where LLM prompt monitoring can tie a regression to the version that caused it.
- Agent, workflow and tool keys - the agent-level metrics carry their own attributes:
gen_ai.workflow.nameon the workflow duration,gen_ai.agent.nameon the agent metrics (conditionally required on the duration, recommended on the two call counts) andgen_ai.tool.name, required, on the tool duration.
Released vs Unreleased GenAI Metric Names: The Migration Table
The GenAI conventions changed home this year. The v1.42.0 release notes of 2026-06-12 say "All gen_ai.* attributes, metrics, events, and spans have been deprecated and moved to the dedicated OpenTelemetry GenAI Semantic Conventions Repository", which GitHub shows was created on 2026-05-05.
| Date | Change | Released? | Effect on metric names |
|---|---|---|---|
| 2026-04-28 | semantic-conventions v1.41.0 | Yes | Seven GenAI metrics; with the v1.41.1 patch of 2026-05-11, the last releases before deprecation |
| 2026-06-12 | semantic-conventions v1.42.0 | Yes | All gen_ai.* definitions deprecated and moved; names unchanged |
| 2026-09-22 | semantic-conventions-genai pull request 374 | No, main only | gen_ai.client.token.usage and gen_ai.token.type replaced by the token counters and histograms |
| 2026-10-06 | semantic-conventions-genai pull request 521 | No, main only | Streaming metrics renamed to gen_ai.client.inference.*; gen_ai.client.inference.duration added |
| 2026-10-18 | Commit 547934afa90a, head of main | No tag, no release | Nineteen gen_ai.* metrics, all Development |
Pull request 374, merged on 2026-09-22 as commit 8ffdf568e1b4, records its breaking change as replacing "the gen_ai.client.token.usage histogram (and the gen_ai.token.type attribute it relied on) with separate per-direction, per-operation token usage histograms, so token distributions can be aggregated correctly." Its title adds the breakdown "by modality, reasoning, cache usage" that the counters now carry.
Pull request 521, merged on 2026-10-06 as commit 4f85037ef86e, adds gen_ai.client.inference.duration, renames the two streaming metrics and clarifies "that gen_ai.client.operation.duration is not for inference". The taxonomy script's diff between the two refs:
DIFF v1.41.0 -> 547934afa90a
  kept 4, renamed 2, removed 1, added 13
  ~ gen_ai.client.operation.time_to_first_chunk
  > gen_ai.client.inference.time_to_first_chunk
  ~ gen_ai.client.operation.time_per_output_chunk
  > gen_ai.client.inference.time_per_output_chunk
  - gen_ai.client.token.usage
  + gen_ai.client.inference.duration
  + gen_ai.invoke_workflow.duration
  + gen_ai.invoke_agent.duration
  + gen_ai.invoke_agent.inference_calls
  + gen_ai.invoke_agent.tool_calls
  + gen_ai.execute_tool.duration
  + gen_ai.client.inference.usage.input_tokens
  + gen_ai.client.inference.usage.output_tokens
  + gen_ai.client.inference.usage.cache_read.input_tokens
  + gen_ai.client.inference.usage.cache_write.input_tokens
  + gen_ai.client.inference.usage.reasoning.output_tokens
  + gen_ai.client.inference.operation.input_tokens
+ gen_ai.client.inference.operation.output_tokens- Kept -
gen_ai.client.operation.durationand the three server metrics keep their names, but on main the client duration no longer covers inference calls. - Renamed - only the prefix changes, from
gen_ai.client.operationtogen_ai.client.inference; the buckets stay the same. - Replaced -
gen_ai.client.token.usagehas no one-to-one successor: totals move to counters and distributions to two histograms.
Libraries still follow the release. OpenTelemetry's own Python GenAI instruments helper, on main at commit de43f819a4a9 of 2026-10-16, creates gen_ai.client.operation.duration and gen_ai.client.token.usage with the 14-boundary buckets above. Emit the released names, write the ref you follow next to your instrumentation config, and plan the switch for the first tagged GenAI release that contains the new ones.
How to Emit OpenTelemetry LLM Metrics From an LLM App
Use an instrumentation library for your model SDK when one exists. When you wrap the calls yourself, create the histograms with the bucket advice from the conventions; the OpenTelemetry JavaScript API takes it as advice.explicitBucketBoundaries, defined in its MetricAdvice interface and still marked experimental there.
- Create one histogram per metric name with the unit and buckets from the table above.
- Record the duration of every call, failed ones included, with
error.typeset on failures. - Record input and output tokens from the provider's usage field, never from your own estimate. v1.41.0 says that instrumentation which cannot obtain the token counts, and offers no offline counting, "MUST NOT report usage metric", so the snippet below, written for the released histogram, skips the token record; on main, the per-operation histograms keep that sentence, and every token metric adds that a call whose response was not received or carried no token usage is recorded as
0. - Keep attributes to the required and recommended set; no IDs or prompt text.
const duration = meter.createHistogram(
  'gen_ai.client.operation.duration', {
    unit: 's',
    advice: { explicitBucketBoundaries: [0.01, 0.02,
      0.04, 0.08, 0.16, 0.32, 0.64, 1.28, 2.56,
      5.12, 10.24, 20.48, 40.96, 81.92] },
  });
const tokens = meter.createHistogram(
  'gen_ai.client.token.usage', {
    unit: '{token}',
    advice: { explicitBucketBoundaries: [1, 4, 16,
      64, 256, 1024, 4096, 16384, 65536, 262144,
      1048576, 4194304, 16777216, 67108864] },
  });

function recordCall(seconds, usage, error) {
  const attrs = {
    'gen_ai.operation.name': 'chat',
    'gen_ai.provider.name': 'openai',
    'gen_ai.request.model': 'gpt-4.1-mini',
  };
  if (error) attrs['error.type'] = error;
  duration.record(seconds, attrs);
  if (!usage) return;
  tokens.record(usage.input,
    { ...attrs, 'gen_ai.token.type': 'input' });
  tokens.record(usage.output,
    { ...attrs, 'gen_ai.token.type': 'output' });
}
A script run on 2026-10-19 put that snippet behind a MeterProvider from @opentelemetry/sdk-metrics 2.7.1 (with @opentelemetry/api 1.9.1), fed it five stub calls with no model contacted, one of them a 30-second timeout, and read back what the SDK aggregated:
@opentelemetry/sdk-metrics 2.7.1

gen_ai.client.operation.duration [s]
  ok      n=4 sum=6.33 <=0.64:1 <=1.28:1 <=2.56:1 <=5.12:1
  timeout n=1 sum=30 <=40.96:1
  boundaries 14, first 0.01, last 81.92

gen_ai.client.token.usage [{token}]
  input   n=4 sum=4540 <=1024:2 <=4096:2
  output  n=4 sum=987 <=64:1 <=256:2 <=1024:1
  boundaries 14, first 1, last 67108864
The SDK applied the advised boundaries, and the timeout landed in its own error.type series instead of inflating the success latency. The same durations recorded with no advice fell back to the SDK's default boundaries:
no advice: 15 boundaries, first 0, 5, 10, 25
  n=5 <=5:4 <=50:1
Those defaults come from the OpenTelemetry metrics SDK specification, which starts them at 0, 5, 10 and 25, "heavily influenced by the default buckets of Prometheus clients", so all four successful calls, from 0.47 s to 3.1 s, share one bucket and no percentile can tell them apart. The specification also says a View that sets its own histogram aggregation overrides the advice, so check your SDK configuration before trusting the buckets on a dashboard.
Limits of LLM Metrics: Correctness, Content and Side Effects
Every metric in the taxonomy counts or times something. None says whether an answer was right, and the conventions keep quality elsewhere: the GenAI events doc defines evaluation results as an event, gen_ai.evaluation.result, with a score value and label, and says instrumentations "MAY capture" model inputs and responses as events.
- Correctness - a fast, cheap call with a wrong answer looks healthy on every panel. Scores come from AI evals run on outputs, then attached as evaluation events or charted next to the metrics.
- Content - metrics carry no prompt or reply text by design, so drift in what users ask or what the model says needs LLM observability over sampled outputs.
- Which call failed - a spike in
error.typetells you that calls failed and roughly when; the span for one failed call tells you which request and which step. - Side effects -
gen_ai.invoke_agent.tool_callscounts calls, failed ones included, andgen_ai.execute_tool.durationtimes them. Neither records whether a refund was issued once, twice or never.
The last gap matters most for agents that act. A successful tool call with a normal latency can still write the wrong record, and only a check of the system the agent changed will show it.
Agent Assurance: Pre-Release Checks of the Side Effects LLM Metrics Miss
Production metrics tell you how an agent behaved after users met it. Before you ship a change to an agent that edits files, opens tickets or changes records, you also need to know what its tool calls changed, and a duration histogram cannot hold that answer.
Agent Assurance from TestMu AI checks those side effects before release through Rook CLI, which is pre-alpha and installs publicly from npm:
npm install -g @testmuai/rookInstall targets: macOS and Linux, and 64-bit Windows through npm or WSL. Node.js 20 or newer has to be on the machine before the npm route works. The docs' Agent Assurance overview explains the profile that tells it how to reach your agent: an HTTP endpoint, for example, or a local command.
- Scenarios from the agent itself - it builds scenarios out of the agent's source code or its written spec, each with acceptance criteria of its own; by default the suite mixes functional cases with adversarial ones, and non-functional scenarios such as token economy are added on request.
- Run figures per result - each scenario result records agent latency and conversation turns, plus input and output tokens when the agent's profile reports them.
- Evidence of what changed - each criterion is graded on evidence: files written inside the directories the profile lists, each tool call held up against the tool list in the agent's own declaration, and read-only record lookups through a tool you approve.
- Three verdicts - each criterion comes out Pass, Fail or Unable to Verify. Undecided scenarios stay out of the scenario pass rate, and the criteria left unchecked are reported on their own, so missing evidence never reads as a pass or a fail.
Some of the criteria get a model judge's score, yet a reply announcing the refund is not evidence: the criterion passes only once the refund appears in the record. Most eval and observability products grade an agent's reply and the trace it logged; Agent Assurance grades the effects of the run and lists what it was unable to check.
Point it at staging: whatever the agent writes in a run is real and stays in place afterwards. Rook CLI has no production monitoring and no runtime blocking; it runs next to your metrics pipeline as the check before release.
Your First Step: Pin the Semantic Conventions Version Behind Your OpenTelemetry LLM Metrics Taxonomy
Pin the release your OpenTelemetry LLM metrics taxonomy follows, today v1.41.0 or its v1.41.1 patch, and emit gen_ai.client.operation.duration and gen_ai.client.token.usage with the advised buckets, adding the streaming histogram if you stream. Add server metrics only for model servers you run, and agent metrics once your framework can bound an invocation.
Before each upgrade, read the breaking entries among the changelog fragments in the semantic-conventions-genai repository and rerun a name diff like the one above. For agents that change records or files, add a pre-release suite with Agent Assurance (npm install -g @testmuai/rook), and see the Agent Assurance CI/CD guide for running that suite in a pipeline, so the release decision rests on what a run changed.
Author

Sandeep Yadav
Blogs: 10

Sandeep Yadav is a Senior Software Engineer at TestMu AI, where he builds the platform's test intelligence and AI-native engineering systems. He has architected autonomous GitHub Apps, vector-search code intelligence, and self-diagnosing QA workflows, and designed distributed platforms that process 2M+ daily test executions and 1B+ events, turning high-volume test, log, and code data into intelligent, self-optimizing systems. He works on embedding reasoning models into production infrastructure to power autonomous review, root-cause analysis, and analytics workflows. He brings over four years of engineering experience with deep expertise in the Elastic Stack, Apache Kafka, and Redis. Earlier he engineered a GDPR-compliant, end-to-end-encrypted secure web-chat application at Mithi. A Facebook Hackercup 2021 Round 2 qualifier and merit-scholarship recipient, Sandeep holds a B.Tech in Electrical Engineering from Delhi Technological University.
Reviewer

Saurabh Prakash
Reviewer
Saurabh Prakash is an Engineering Manager at TestMu AI, where he leads engineering on agentic AI development and scalable system architecture for the quality engineering platform. He has also contributed to Test at Scale, the company's open-source test intelligence platform. He brings over 9 years of experience across Node.js, Java, Spring, MVC, data structures, algorithms, and scalable system design, with earlier roles as SDE 2 at Zomato, Senior Software Engineer at LogicHub, and Software Development Engineer at Directi. Saurabh holds a B.Tech in Computer Science and Engineering from Delhi Technological University.


OpenTelemetry LLM Metrics FAQs
Did you find this page helpful?
More Related Learning Hubs

TestMu AI forEnterprise
Get access to solutions built on Enterprise
grade security, privacy, & compliance
- Advanced access controls
- Advanced data retention rules
- Advanced Local Testing
- Premium Support options
- Early access to beta features
- Private Slack Channel
- Unlimited Manual Accessibility DevTools Tests