

Power Your Software Testing with AI Agents and Cloud
The Native AI-Agentic Cloud Platform to Supercharge Quality Engineering. Test Intelligently and Ship Faster.


- TestMu AI (Formerly LambdaTest)
- /
- Blog
- /
- 7 Best AI Test Observability Platforms for CI/CD Pipelines (2026)
7 Best AI Test Observability Platforms for CI/CD Pipelines (2026)
Compare the 7 best AI test observability platforms for CI/CD pipelines, from flaky test detection to automated root cause analysis, and pick the right fit.
Last Updated on:
CI/CD pipelines have made it possible to build, test, and ship software faster than ever, but speed without visibility is a liability. When a pipeline goes red, someone has to answer why: a real regression, a flaky test, or an environment hiccup? AI test observability platforms exist to answer that question automatically, using machine learning to detect anomalies, classify failures, and point at root causes instead of leaving engineers to dig through logs.
This guide compares the leading AI test observability platforms for CI/CD pipelines side by side, then covers the evaluation criteria and the core concepts behind test observability so you can pick the right fit for your team.
Overview
To optimize your CI/CD pipeline, use TestMu AI for execution-native test observability or SeaLights for quality intelligence and predictive test selection. These platforms leverage machine learning to automatically detect anomalies, classify failures, and identify root causes, eliminating manual log analysis.
- Flaky test detection: AI platforms identify tests that pass and fail intermittently without code changes, tracking the flaky test rate over time.
- Automated root cause analysis: These tools correlate logs, traces, and artifacts to point directly at the cause of a failure and cut mean time to resolution.
- Test observability: Observability answers whether a pipeline failure was caused by a real regression, a flaky test, or an environment hiccup, allowing teams to catch issues early.
- Best for execution-native observability: TestMu AI Test Insights - Uses test intelligence to unify execution data, classify failures by cause, and correlate network, console, and framework logs to reduce resolution times.
- Best for test impact analysis: SeaLights - Maps test coverage to code changes and uses predictive test selection to recommend the minimal set of tests to run, shortening pipeline runtimes and identifying release risks.
- Best for self-hosted ML triage: ReportPortal - Uses machine learning to auto-classify test failures based on historical team classifications, making this open-source platform ideal for teams requiring on-premise data residency.
- Best for full-stack monitoring integration: Datadog CI Visibility - Tracks build and test executions as traces, automatically flags flaky tests, and allows teams to correlate pipeline failures directly with production application monitoring data.
- Best for OpenTelemetry debugging: Honeycomb - Uses OpenTelemetry instrumentation and high-cardinality analysis to isolate the exact dimensions, such as runners or branches, causing pipeline slowdowns or test failure spikes.
- Best for enterprise causal analysis: Dynatrace - Utilizes its Davis AI engine to deliver automated anomaly detection and causal root cause analysis across services, infrastructure, and delivery pipelines.
- Best for deployment tracking: New Relic - Monitors pipelines by marking deployments and configuration changes on charts, enabling teams to correlate post-release error rates with specific changes using anomaly detection.
Comparison Table: Leading AI Test Observability Platforms
| Platform | AI Capabilities | CI/CD Integrations | Deployment | Primary Focus |
|---|---|---|---|---|
| TestMu AI Test Insights | Flaky test detection, AI-Native Test Triage, agentic root cause analysis | 120+ tools incl. Jenkins, GitHub Actions, GitLab CI | SaaS | Unified test analytics and observability across test execution |
| SeaLights | Test impact analysis, predictive test selection, quality-risk scoring | Major CI servers and build tools | SaaS | Quality intelligence and test-gap analysis |
| ReportPortal | ML-based failure triage and auto-classification of test errors | Plugs into common CI runners and frameworks | Self-hosted or cloud | Open-source test reporting and analysis |
| Datadog CI Visibility | Flaky test detection, pipeline anomaly alerts, trace-level test views | GitHub Actions, Jenkins, GitLab CI, and more | SaaS | Pipeline and test visibility inside a full observability suite |
| Honeycomb | High-cardinality analysis (BubbleUp) to isolate slow or failing pipeline steps | OpenTelemetry-based instrumentation of builds | SaaS | Debugging pipeline performance with OpenTelemetry data |
| Dynatrace | Davis AI engine for automated root cause analysis and anomaly detection | Broad DevOps toolchain integrations | SaaS / managed | Full-stack observability across the delivery pipeline |
| New Relic | Change tracking, anomaly detection, error correlation | CI/CD change markers and pipeline monitoring | SaaS | Application observability with CI/CD context |
Top 7 AI Test Observability Platforms for CI/CD Pipelines (Compared)
Each platform below approaches the same goal, understanding what your tests are telling you, from a different angle. Here is what each does best.
1. TestMu AI Test Insights
TestMu AI's Test Insights unifies all test execution data from the TestMu AI platform into one analytics and observability layer, so QA teams see pass/fail trends, flaky tests, and failure causes without stitching reports together. AI-Native Test Triage classifies failures by cause (application logic, network, browser-specific rendering, or test-script issues), and agentic root cause analysis correlates network logs, console logs, and framework logs to localize the failure, cutting MTTR from hours of log digging to minutes. It connects to 120+ CI/CD and DevOps tools including Jenkins, GitHub Actions, and GitLab CI, and every test run carries full session artifacts (video, screenshots, network and console logs) as evidence.
Best for: teams running web and mobile test suites who want observability native to their execution platform rather than bolted on afterward.
2. SeaLights
SeaLights is a quality intelligence platform centered on test impact analysis: it maps which tests cover which code, then uses that map to recommend the minimal set of tests to run for a given change. That predictive test selection shortens pipeline runtime while surfacing untested code areas (test gaps) that represent hidden release risk.
Best for: large suites where running everything on every commit is too slow, and leadership wants quality-risk visibility per release.
3. ReportPortal
ReportPortal is an open-source test reporting platform whose standout feature is ML-based failure triage: it learns from how your team classifies failures (product bug, automation issue, environment issue) and starts auto-classifying similar failures on subsequent runs. Being self-hostable makes it a strong fit for organizations that need test data to stay inside their own infrastructure.
Best for: teams that want AI-assisted triage without a SaaS dependency, and are comfortable operating their own instance.
4. Datadog CI Visibility
Datadog CI Visibility extends the Datadog observability suite into the pipeline: it tracks build and test executions as traces, flags flaky tests automatically, and alerts on pipeline anomalies like a rising flaky test rate or slowing job durations. Because it lives beside application monitoring, you can correlate a failing test with what the application was doing at that moment.
Best for: teams already on Datadog who want pipeline and test telemetry in the same pane as production monitoring.
5. Honeycomb
Honeycomb approaches pipeline observability through OpenTelemetry: you instrument builds and test jobs as traces, then use its high-cardinality analysis (BubbleUp) to isolate exactly which dimension, a runner, a branch, a test file, explains a slowdown or failure spike. It is less a turnkey test dashboard and more a powerful debugging lens for engineering teams who treat the pipeline as a production system.
Best for: platform teams standardizing on OpenTelemetry who want deep, query-driven answers about pipeline behavior.
6. Dynatrace
Dynatrace brings its Davis AI engine to the delivery pipeline: automated anomaly detection and causal root cause analysis across services, infrastructure, and deployments. In a CI/CD context it shines at answering "what changed and what did it break," tying a deployment event to the degradation it caused.
Best for: enterprises wanting one AI engine across full-stack observability, with the pipeline as one of many monitored layers.
7. New Relic
New Relic covers the CI/CD angle through change tracking and pipeline monitoring: deployments and config changes become markers on every chart, so when error rates move after a release, the correlation is visible immediately. Combined with anomaly detection and OpenTelemetry support, it gives delivery teams a clear before/after picture for every change that ships.
Best for: teams that want deployment-to-impact correlation inside a general-purpose observability platform.

Note: See flaky tests, failure causes, and trends across every run with AI-native Test Insights. Try TestMu AI Today!
Key Features to Look for in an AI Test Observability Tool
Whichever platform you shortlist, evaluate it against these criteria:
- Automated flaky test detection: The tool should identify tests that pass and fail intermittently without code changes, and track your flaky test rate over time. Flaky tests are the single biggest trust-killer in CI gates.
- Automated root cause analysis (RCA): When a test fails, the platform should correlate logs, traces, and artifacts to point at the cause, not just report red. This is the feature that directly reduces MTTR (mean time to resolution).
- Predictive test selection: For large suites, AI that selects which tests a change actually needs keeps pipelines fast without sacrificing coverage.
- Native CI/CD integrations: First-class support for the runners you use, such as Jenkins, GitHub Actions, and GitLab CI, so telemetry flows in without custom glue code.
- Open standards support: OpenTelemetry compatibility keeps your instrumentation portable if you switch vendors later.
- Rich failure evidence: Videos, screenshots, network logs, and console logs attached to every failed run turn triage from reproduction work into review work.
The Challenge of Traditional Testing
Traditional software testing methods often involve a set of predefined test cases that are executed on a fixed schedule. This approach can have its own limitations, for instance, it may not identify unexpected defects, especially when the codebase is large and complex. Additionally, it can lead to long test cycles that delay the release of software updates. Modern CI/CD practices compress those cycles, which is exactly why the visibility gap becomes the bottleneck.
The Importance of Test Observability
Test Observability is a modern approach to software testing that focuses on real-time monitoring and analysis of the testing process. It involves collecting and analyzing data from various testing stages, including unit tests, integration tests, and end-to-end tests. By doing so, development teams can gain deeper insights into the health and performance of their applications throughout the testing process.
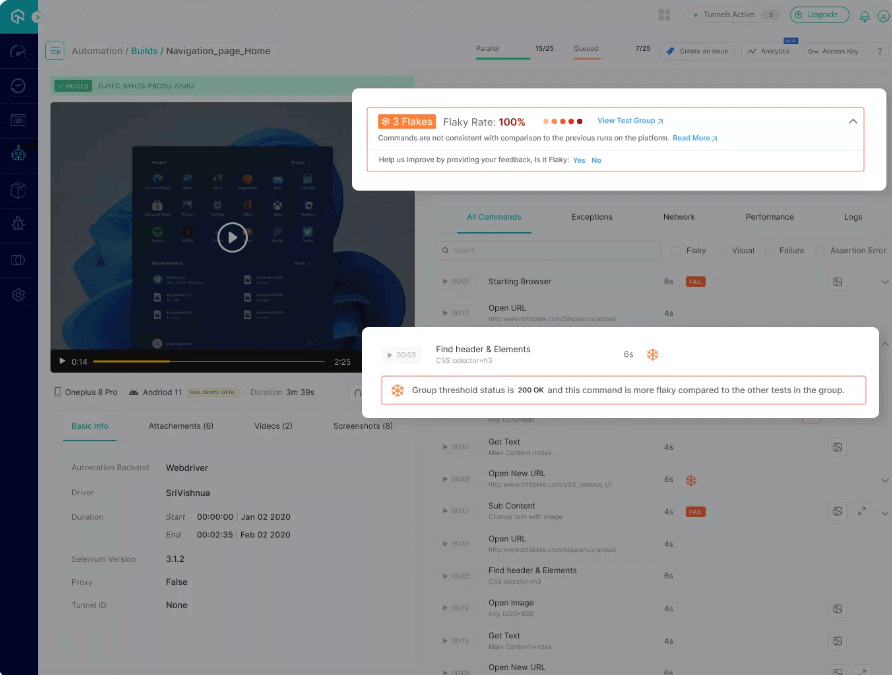
Here are some key benefits of incorporating Test Observability into your CI/CD pipeline:
- Early Detection of Issues: Test Observability allows you to detect and address issues as soon as they arise during the testing phase. This proactive approach helps prevent defects from progressing further downstream in the deployment process.
- Improved Test Efficiency: By continuously monitoring test execution and results, you can identify bottlenecks and optimize your testing process for speed and efficiency. This leads to shorter test cycles and faster deployments.
- Comprehensive Test Coverage: Test Observability provides a holistic view of your application’s behavior during testing. It ensures that all critical test scenarios are covered, reducing the risk of post-deployment failures.
- Data-Driven Insights: AI-driven analytics in Test Observability tools can provide actionable insights based on historical test data. This can help you make data-driven decisions to prioritize testing efforts and optimize test cases.
- Faster Debugging: When issues do arise, Test Observability tools can help you quickly pinpoint the root cause, reducing the time and effort required for debugging and fixing defects.

AI-Native Test Observability
AI plays a crucial role in enhancing Test Observability. Machine learning algorithms can analyze vast amounts of testing data in real-time, identifying patterns and anomalies that human testers might miss. AI-native test observability tools can automatically trigger alerts when unusual behavior is detected, allowing teams to respond promptly.
With the rise of AI in testing, its crucial to stay competitive by upskilling or polishing your skillsets. The KaneAI Certification proves your hands-on AI testing skills and positions you as a future-ready, high-value QA professional.
For instance, TestMu AI's AI-native Test Analytics and Observability Suite makes it fast and simple to unify all test execution data on a centralized test analytics platform so QA teams can make an informed decision.
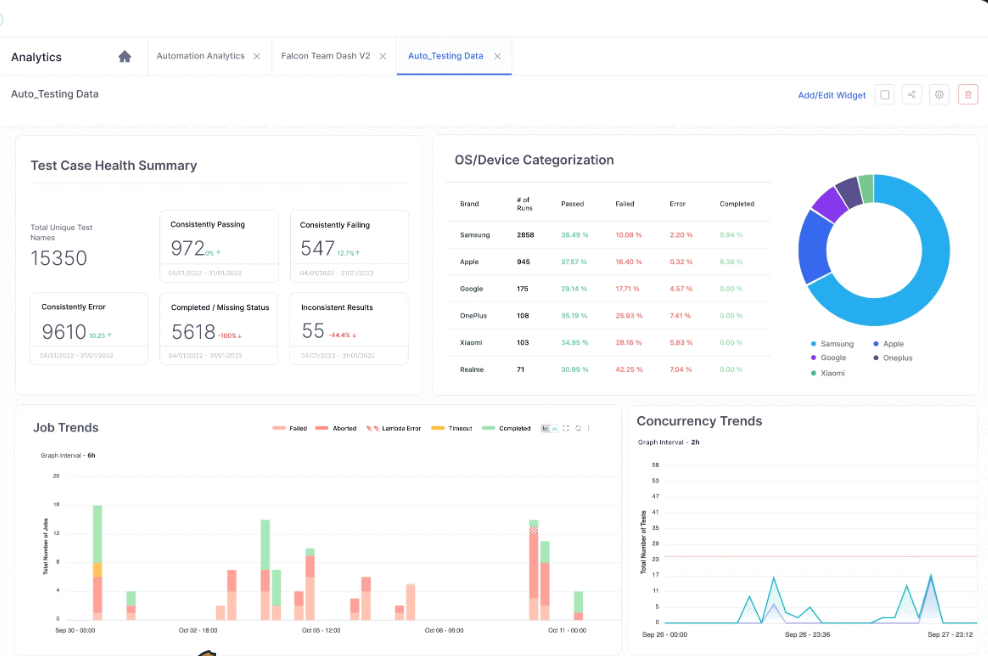
Here are some ways how TestMu AI can assist in Test Observability:
- Anomaly Detection: AI can identify abnormal test outcomes, such as unexpected errors or performance degradation, and alert the team in real-time.
- Browser and OS/ Device Categorization: Easy monitoring of overall test distributions on multiple devices and environments.
- Test Trends: Analyze the trends of the tests executed on the platform over a period of time.
- Predictive Analysis: Machine learning models can predict potential issues based on historical data, helping teams prioritize their testing efforts.
- Test Case Optimization: AI can suggest which test cases to run based on code changes and historical test results, optimizing test coverage.
- Performance Monitoring: AI can monitor the performance of the application during testing, ensuring it meets performance targets.
- Root Cause Analysis: AI can assist in identifying the root causes of test failures, speeding up the debugging process.
Conclusion
In today’s fast-paced software development landscape, achieving CI/CD success requires more than just automation; it demands comprehensive Test Observability. The right platform depends on where your pain lives: choose a quality-intelligence tool if suite runtime is the bottleneck, an open-source option if data residency matters, a full-stack suite if you want pipeline and production telemetry together, or an execution-native platform if you want observability built into where your tests already run.
When it comes to test observability, TestMu AI is your QA team’s go-to solution. The AI-native Test Analytics platform provides you with the insights you need to improve your testing process and deliver better software. Your QA teams can see exactly what happened during the tests: which steps passed, which steps failed, and why, with screenshots and videos of the tests in action. This information is essential for debugging and fixing issues quickly, and for identifying and prioritizing the most important tests to run.
Assess and share all your test analytics from a single dashboard with TestMu AI Analytics!
Author

Anindya Mishra
Blogs: 1

Anindya Mishra is a community contributor with over five years of experience across AI, SaaS, and technology startups. On TestMu AI (formerly LambdaTest), he authored an article on test observability and AI-driven CI/CD, covering how observability detects issues early and supports reliable software deployment. He holds a Bachelor of Technology in Electronics and Communication Engineering from PES University and is pursuing a Master of Business Administration at The George Washington University.


CI/CD Test Observability FAQs
Did you find this page helpful?
More Related Blogs
TestMu AI forEnterprise
Get access to solutions built on Enterprise
grade security, privacy, & compliance
- Advanced access controls
- Advanced data retention rules
- Advanced Local Testing
- Premium Support options
- Early access to beta features
- Private Slack Channel
- Unlimited Manual Accessibility DevTools Tests