Test Cases in Build Insights
Overview
A single test session often runs several scenarios — sign in, search, checkout. When you report each scenario as a test case (with lambda-hooks, a webhook or a supported reporter — see Test Case Insights), TestMu AI tracks every test case on its own: its status, duration and history, and the smart tags, flakiness and failure category that apply to it.
This page covers where test cases appear and what you can do with them:
- Test Cases in Build Insights — switch a build between test sessions and test cases.
- Test cases on the automation build page — the Insights and Test Cases tabs on App and Web Automation builds.
- Test Cases View widget — test case history on your dashboards.
- Test case intelligence — smart tags, flakiness and failure categories for test cases.
- Anomaly notifications — get an email, Slack or webhook digest when a build has anomalies.
Test cases are available for Web Automation and App Automation, and HyperExecute test cases also appear in Build Insights. Some parts of this experience are being rolled out gradually; if you don't see a feature described here, contact support.
Test Cases in Build Insights New
Open Insights → Build Insights, then select a build. The Insights and Tests tabs carry a Test Sessions / Test Cases toggle in the top-right corner:
- Test Sessions — the existing view, one row per test session.
- Test Cases — every test case reported inside those sessions.
Each mode keeps its own filters, search and grouping, so switching back and forth doesn't reset your work; the date range is shared by both modes.
Insights tab in Test Cases mode
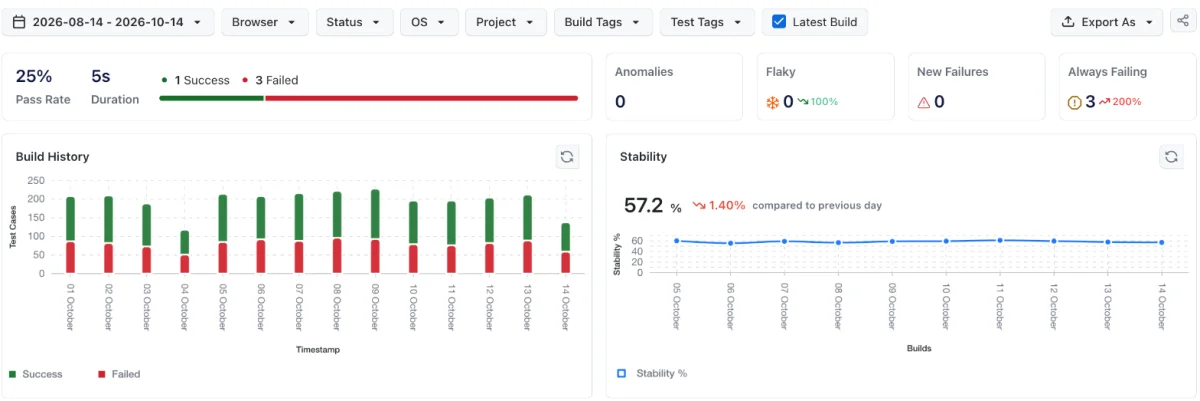
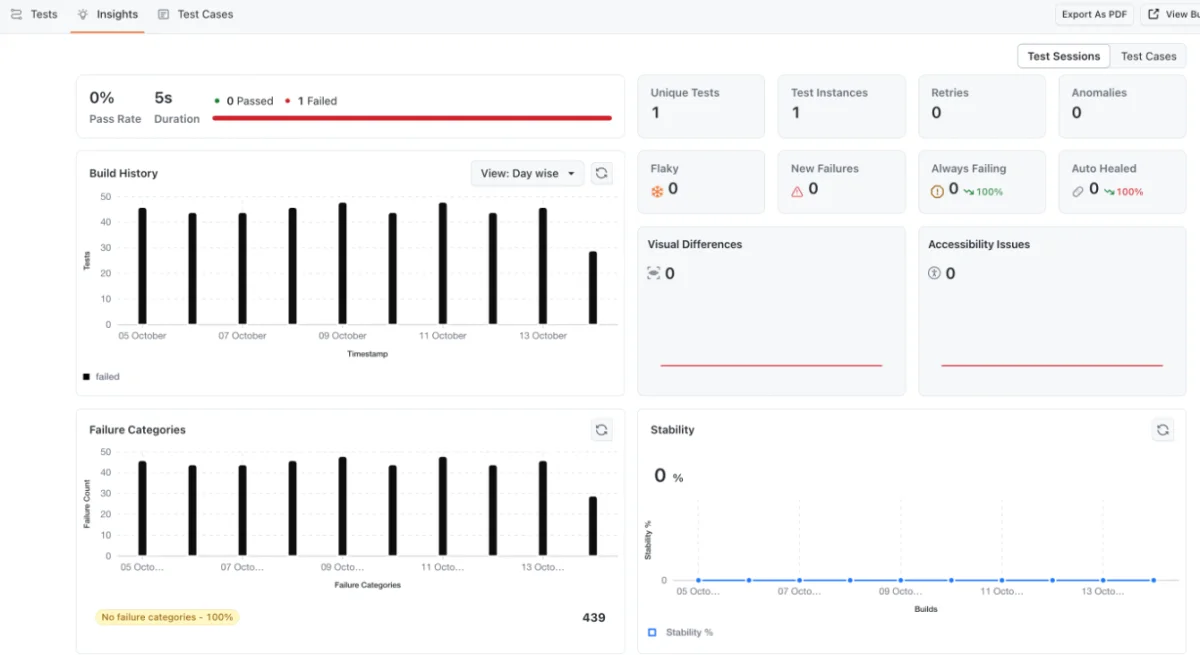
In Test Cases mode the Insights tab summarises the build at test case level:
- Pass rate and duration, with test case counts shown as Success and Failed.
- Anomalies, Flaky, New Failures and Always Failing — counts of test cases carrying each smart tag.
- Build History — test cases per day, split by status.
- Stability, and the Browsers and OS breakdowns.
Widgets that only apply to test sessions — Unique Tests, Test Instances, Retries, Auto Healed, Visual Differences, Accessibility Issues and Failure Categories — are hidden in this mode.
Drill into a metric
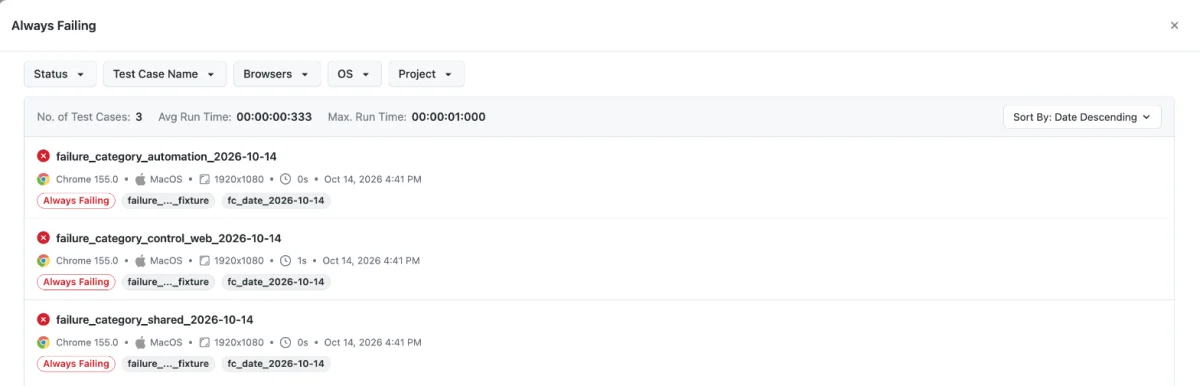
Click the count on Anomalies, Flaky, New Failures or Always Failing, or a bar in Build History, to open a drawer that lists the matching test cases. The drawer shows the number of test cases, the average and maximum run time, and lets you filter by Status, Test Case Name, Browsers, OS and Project and change the sort order. Each row is one run of a test case, so the count in the drawer matches the number on the tile.
Tests tab in Test Cases mode
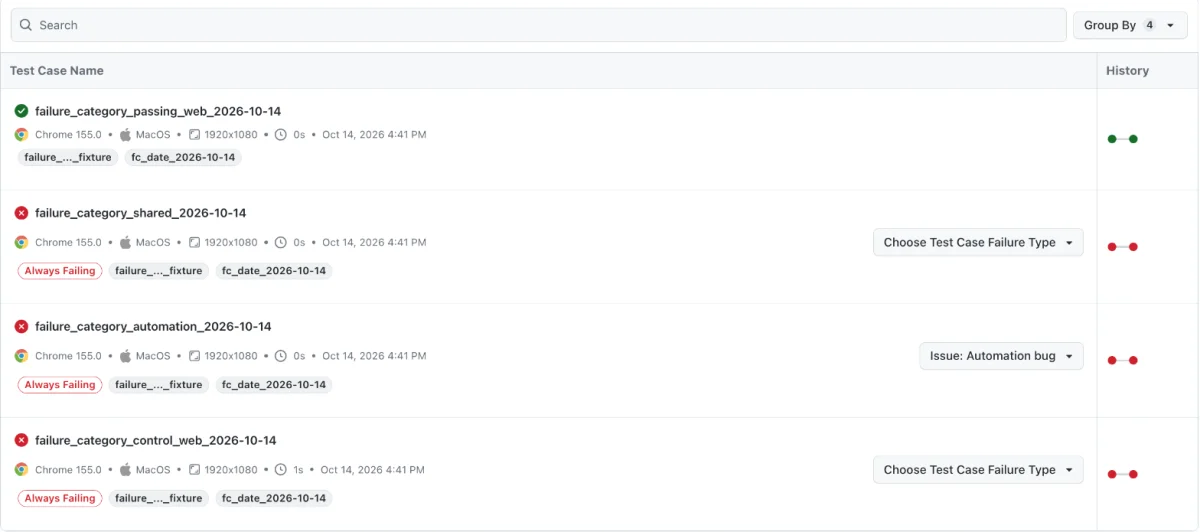
In Test Cases mode the Tests tab lists every test case in the build, ten per page:
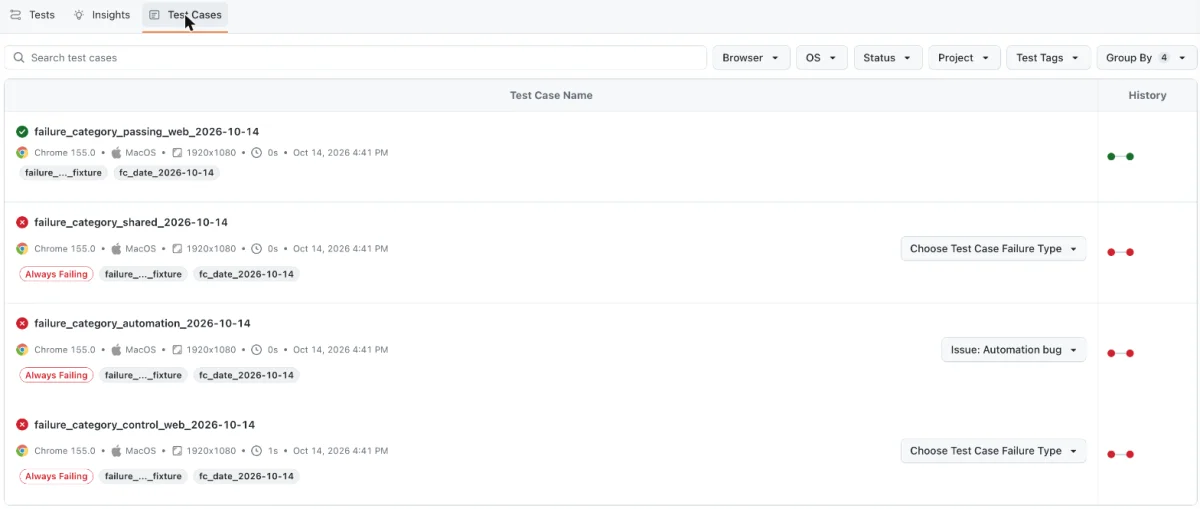
- Test Case Name with its status, browser, OS, resolution, duration and last run time, plus a flake rate when the test case is flaky.
- Its smart tags (for example Always Failing) and test tags.
- For failed test cases, a failure category selector — see Failure categories for test cases.
- History — the latest runs of that test case as coloured dots, newest on the right.
Use Search to find a test case by name, and Group By to group the list by Browser, OS, Resolution or Device. Job Labels, Custom Tags and Show Unique Instances apply to test sessions only and are hidden in this mode. Click a test case to open its test report in a new tab.
Run history
Hover over a history dot to see that run's Status, Time, Duration and Test ID. Click a dot to open that run's test report in a new tab. On shared links the history is read-only.
Build-wise and Day-wise history New
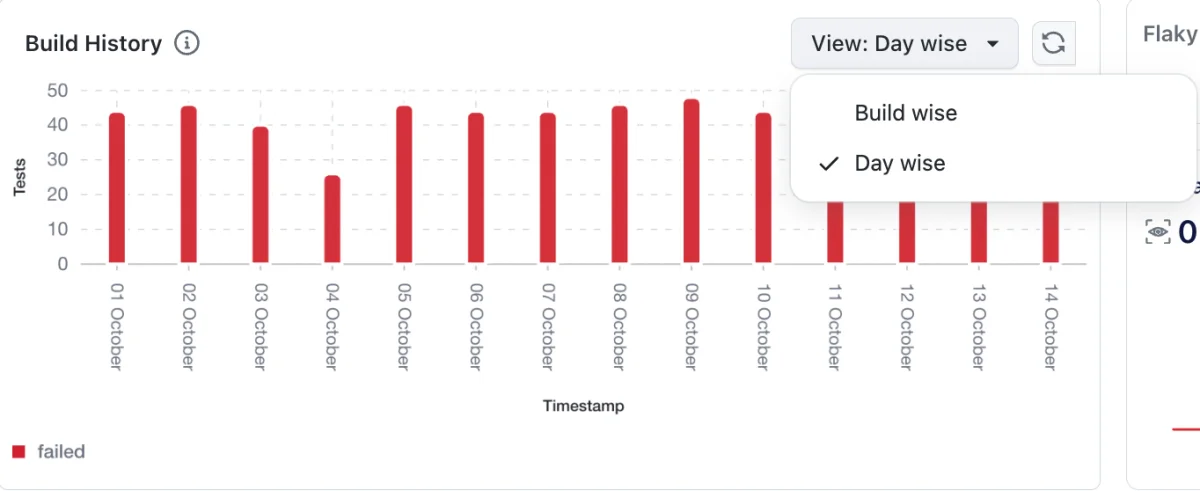
The Build History, Failure Categories and Stability charts have a View selector:
- Day wise (default) — one bar or point per day.
- Build wise — one bar or point for each of the latest 10 builds, so you can compare build to build.
Your choice is remembered in your browser. Shared links always open in Day wise, and in Test Cases mode the charts are always Day wise.
Test cases on the automation build page New
On App Automation and Web Automation, open a build to see three tabs:
- Tests — the test sessions in the build.
- Insights — the build's insights, with the same Test Sessions / Test Cases toggle as Build Insights. Use Export As PDF to download them, or View Build Insights to open the full Build Insights page.
- Test Cases — every test case in the build. This tab appears only when the build contains test cases.
The Test Cases tab keeps search, the Browser, OS, Status, Project and Test Tags filters, and Group By in a single row above the list. Group By accepts more than one dimension here.
Open a test case in a drawer
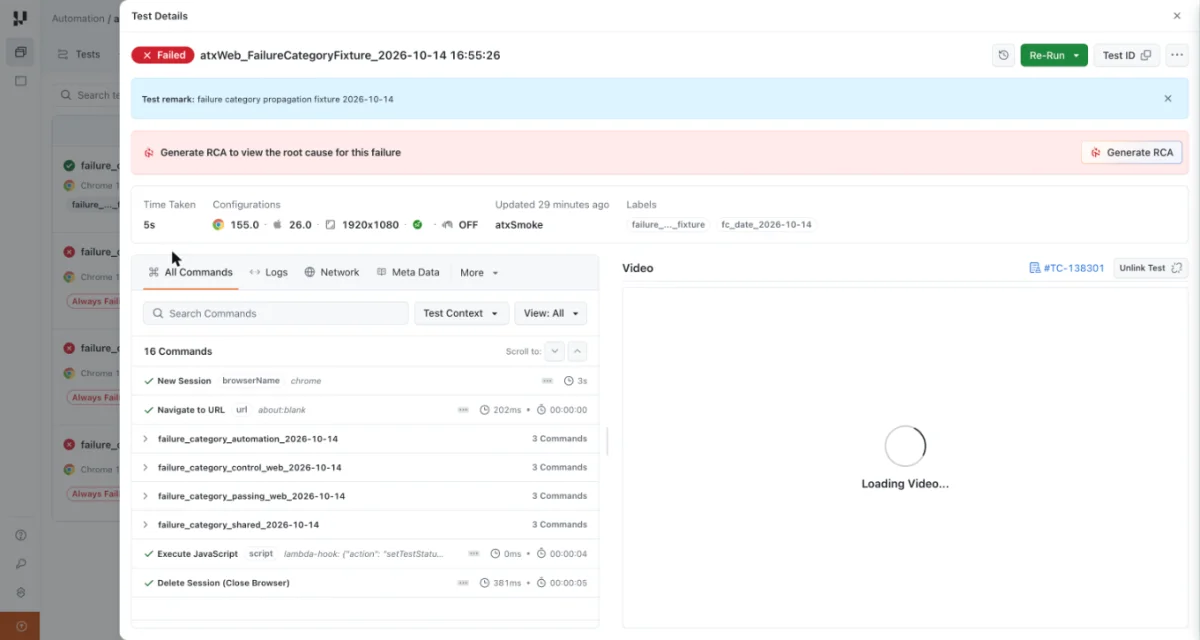
Click a test case to open the full test details — command logs, video, network and metadata — in a Test Details drawer, without leaving the list. The page URL includes the test case, so you can share a link that opens straight to it.
Test Cases View widget
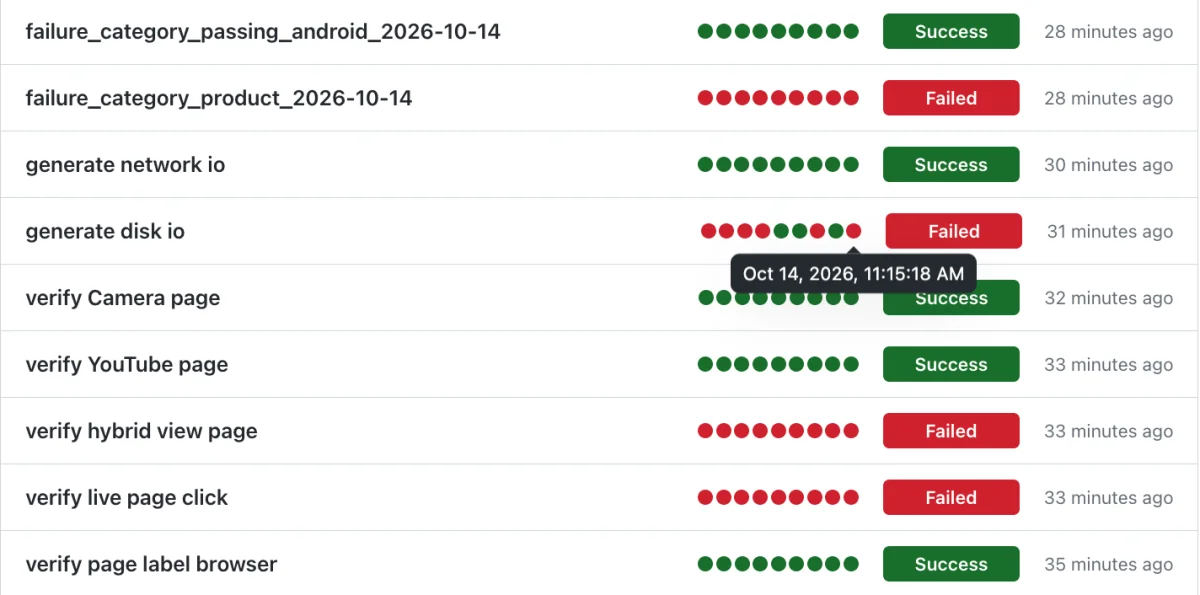
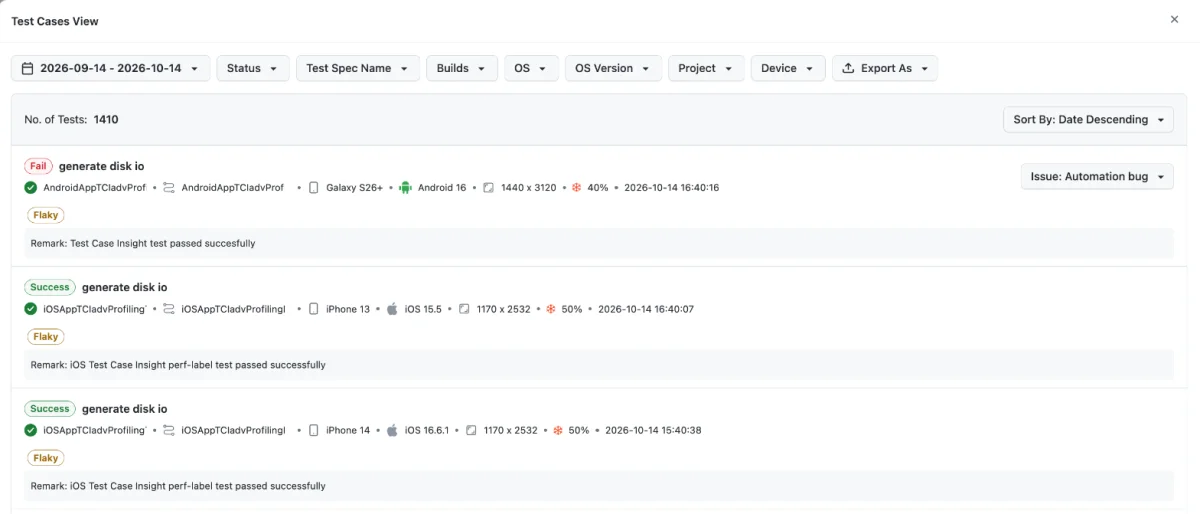
The Test Cases View widget lists test cases on your dashboards with their latest status, when they last ran, and up to nine history dots with the newest on the right. Hover over a dot to see the date and time of that run.
Click a test case to open its drilldown. Alongside the date range, Status, Test Spec Name, Builds, OS and Project filters, you can narrow the runs by OS Version and Device — useful for spotting a failure that only happens on one device or OS version. Each run shows its device, OS version, resolution, flake rate and smart tags, and failed runs show their failure category.
Test case intelligence
Smart tags for test cases
Smart Tags are computed for each test case, not just for each test session:
| Smart tag | When a test case gets it |
|---|---|
| New Failure | Its latest run failed after a run of consecutive passes (10 by default). |
| Always Failing | Its latest runs all failed (5 consecutive failures by default). |
| Performance Anomaly | Its latest run passed but took noticeably longer than its usual duration — more than two standard deviations above the average of its recent passing runs (10 by default). |
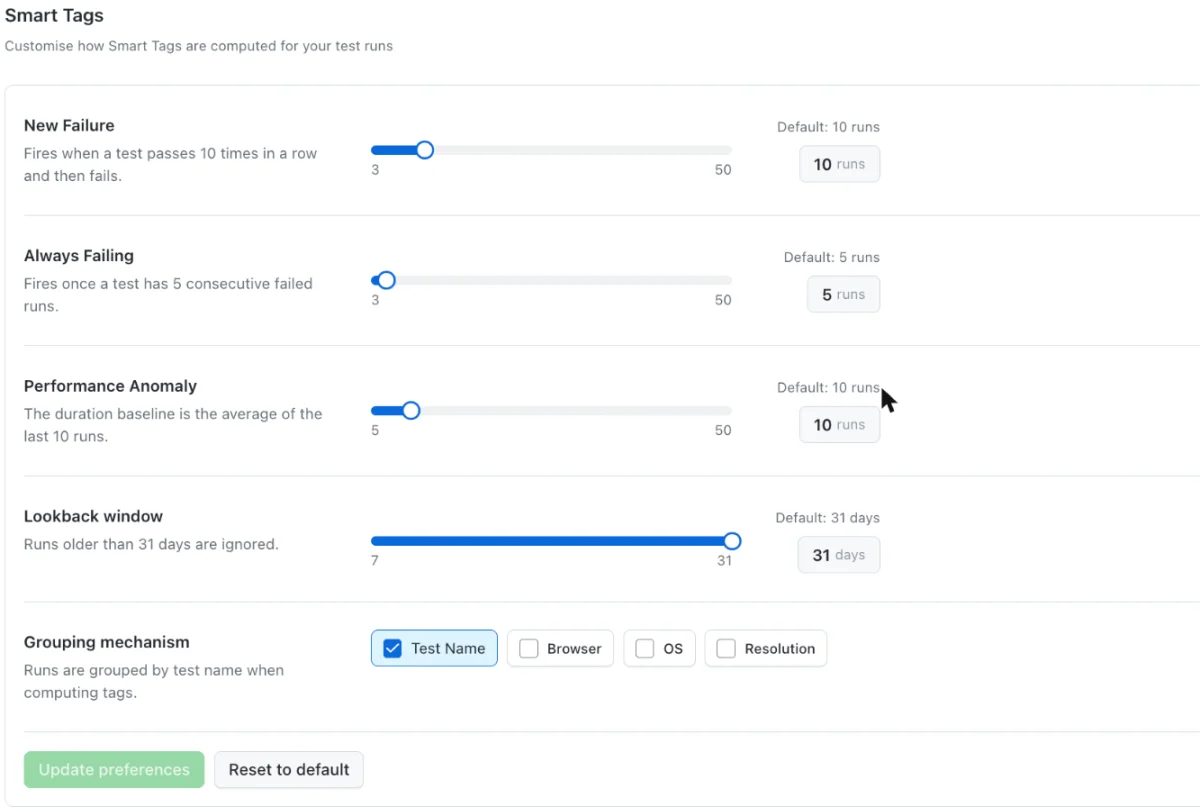
Configure the thresholds in Organization Settings → Org Product Preferences → Insights → Smart Tags:
| Setting | What it controls | Range | Default |
|---|---|---|---|
| New Failure | Consecutive passes before a failure counts as new | 3–50 runs | 10 runs |
| Always Failing | Consecutive failures required | 3–50 runs | 5 runs |
| Performance Anomaly | Runs used to build the duration baseline | 5–50 runs | 10 runs |
| Lookback window | How far back runs are considered | 7–31 days | 31 days |
| Grouping mechanism | Group runs by Test Name, and optionally Browser, OS and Resolution | — | Test Name |
Flaky test cases
A test case is marked Flaky when its status keeps flipping between passed and failed across recent runs. The flake rate is the share of consecutive runs whose status changed; a test case is flaky once the rate reaches the threshold, and only after it has a full window of runs. Flaky test cases show a Flaky tag and their flake rate in lists and drilldowns, and are counted on the Flaky tile in Build Insights.
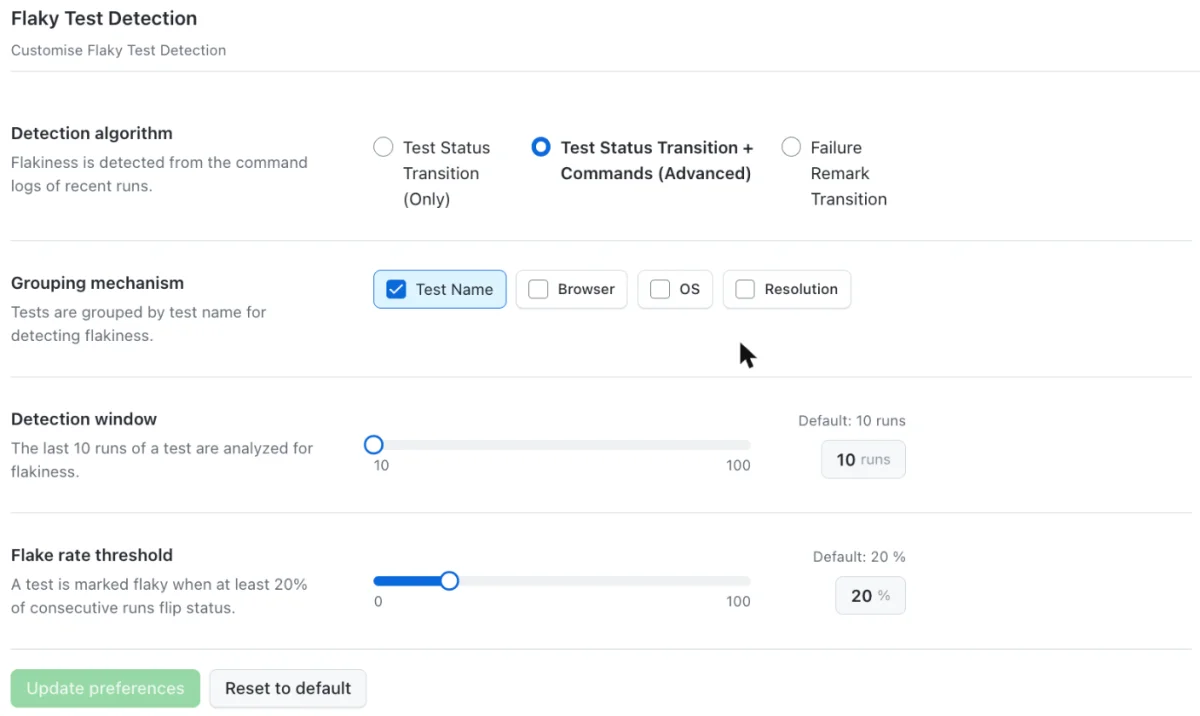
The detection window, the flake rate threshold and the grouping come from Organization Settings → Org Product Preferences → Insights → Test Intelligence → Flaky Test Detection. The Detection algorithm setting applies to test sessions; test cases always use status transitions.
| Setting | Range | Default |
|---|---|---|
| Detection window | 10–100 runs | 10 runs |
| Flake rate threshold | 0–100% | 20% |
| Grouping mechanism | Test Name, and optionally Browser, OS, Resolution | Test Name |
Failure categories for test cases
You can categorise the failure of an individual test case, the same way Failure Categorization works for test sessions. On a failed test case, open Choose Test Case Failure Type and pick Product bug, Automation bug, Environment issue or No defect. The category applies to that test case run only — other test cases in the same session and the parent test session keep their own categories.
When the same test case later fails again on the same failing command, the category you chose is carried forward to the new run automatically. A category is never applied to a passed test case, and it never overwrites a category already set on a run.
Anomaly notifications New
Get a digest by email, Slack or webhook whenever a build finishes with anomalies, instead of checking the dashboard after every run.
Set up notifications
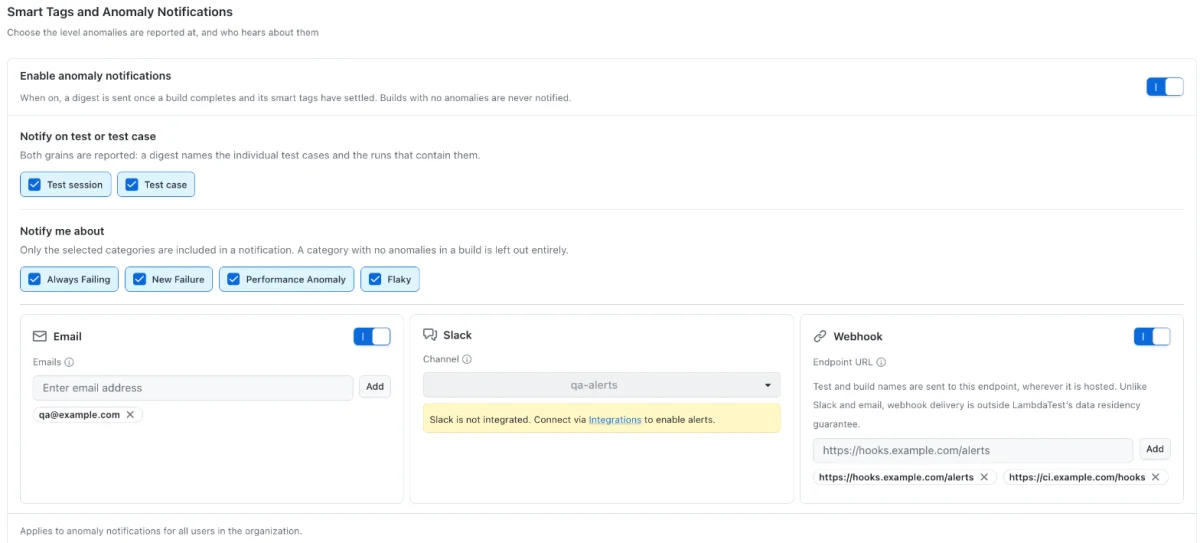
Go to Organization Settings → Org Product Preferences → Insights → Smart Tags. The Smart Tags and Anomaly Notifications card holds the settings, which apply to the whole organization:
- Turn on Enable anomaly notifications.
- Under Notify on test or test case, choose Test session, Test case, or both.
- Under Notify me about, choose the anomalies to report: Always Failing, New Failure, Performance Anomaly and Flaky.
- Turn on at least one channel:
- Email — add up to 50 recipient addresses.
- Slack — choose a channel. Slack must first be connected under Integrations.
- Webhook — add up to 20 public
httporhttpsendpoint URLs.
- Click Update.
Update stays disabled until you have selected at least one level, one anomaly type and one channel.
When a notification is sent
- One digest is sent per build, once the build has completed and its smart tags have settled.
- Only the anomaly types you selected are included, and a type with no anomalies in the build is left out.
- Builds with no anomalies are never notified.
- The same build is not notified twice on the same channel.
What a notification contains
- Email — the subject names the build and the number of anomalies, for example
Checkout-Regression • 3 test anomalies detected. The email lists the build name and ID, product, detection level and build end time, then one section per anomaly type with up to five tests or test cases, and a View in Insights button. - Slack — the same details with up to three entries per anomaly type, and View in Insights and View Build buttons.
- Webhook — a JSON
POSTwith theX-LT-Event: test_intelligence_anomalyheader. The body carriesevent,build_id,build_name,build_url,product,detection_levels,build_end_time,totalsand anitemslist with one entry per anomaly.
Each entry names the test, or the test case and the test that contains it, along with its duration, its configuration and, for flaky entries, the flake rate.
Related
- Test Case Insights — how to report test cases from your tests.
- Build Insights — the build list and build details.
- Smart Tags — smart tags for test sessions.
- Failure Categorization AI — failure categories for test sessions.
 Chat with Us