

Power Your Software Testing with AI Agents and Cloud
The Native AI-Agentic Cloud Platform to Supercharge Quality Engineering. Test Intelligently and Ship Faster.


- TestMu AI (Formerly LambdaTest)
- /
- Blog
- /
- How to Enable Safari Developer Menu on Mac and iOS
How to Enable Safari Developer Menu on Mac and iOS
Enable the Safari Develop menu on macOS Sonoma and Ventura, plus Developer Mode on iOS 16 and iOS 17. Step-by-step instructions to inspect and debug Safari.
Last Updated on:
Enabling Safari's Developer menu unlocks tools for monitoring page load times, tracking resource requests, testing device responsiveness, and editing HTML and CSS live in the browser, but the toggle location differs by macOS version since Apple renamed both the preferences window and the checkbox in recent Safari releases.
How to Enable the Develop Menu in Safari on Mac (macOS Sonoma, Ventura, and Older)
Safari’s Developer menu is hidden by default but can be quickly enabled through the browser settings. Once activated, it provides access to advanced tools for inspecting and debugging websites.
The exact wording depends on which version you are running, because Apple renamed both the preferences window and the checkbox in recent releases. macOS Ventura renamed Preferences to Settings, and Safari 16.4 replaced the old “Show Develop menu in menu bar” checkbox with a broader “Show features for web developers” option that enables the Develop and Feature Flags menus together.
| Your version | Menu path | Checkbox to tick |
|---|---|---|
| macOS Sonoma (Safari 17), or macOS Ventura updated to Safari 16.4+ | Safari > Settings > Advanced | Show features for web developers |
| macOS Ventura on Safari 16.0 to 16.3 | Safari > Settings > Advanced | Show Develop menu in menu bar |
| macOS Monterey and earlier (Safari 15 and older) | Safari > Preferences > Advanced | Show Develop menu in menu bar |
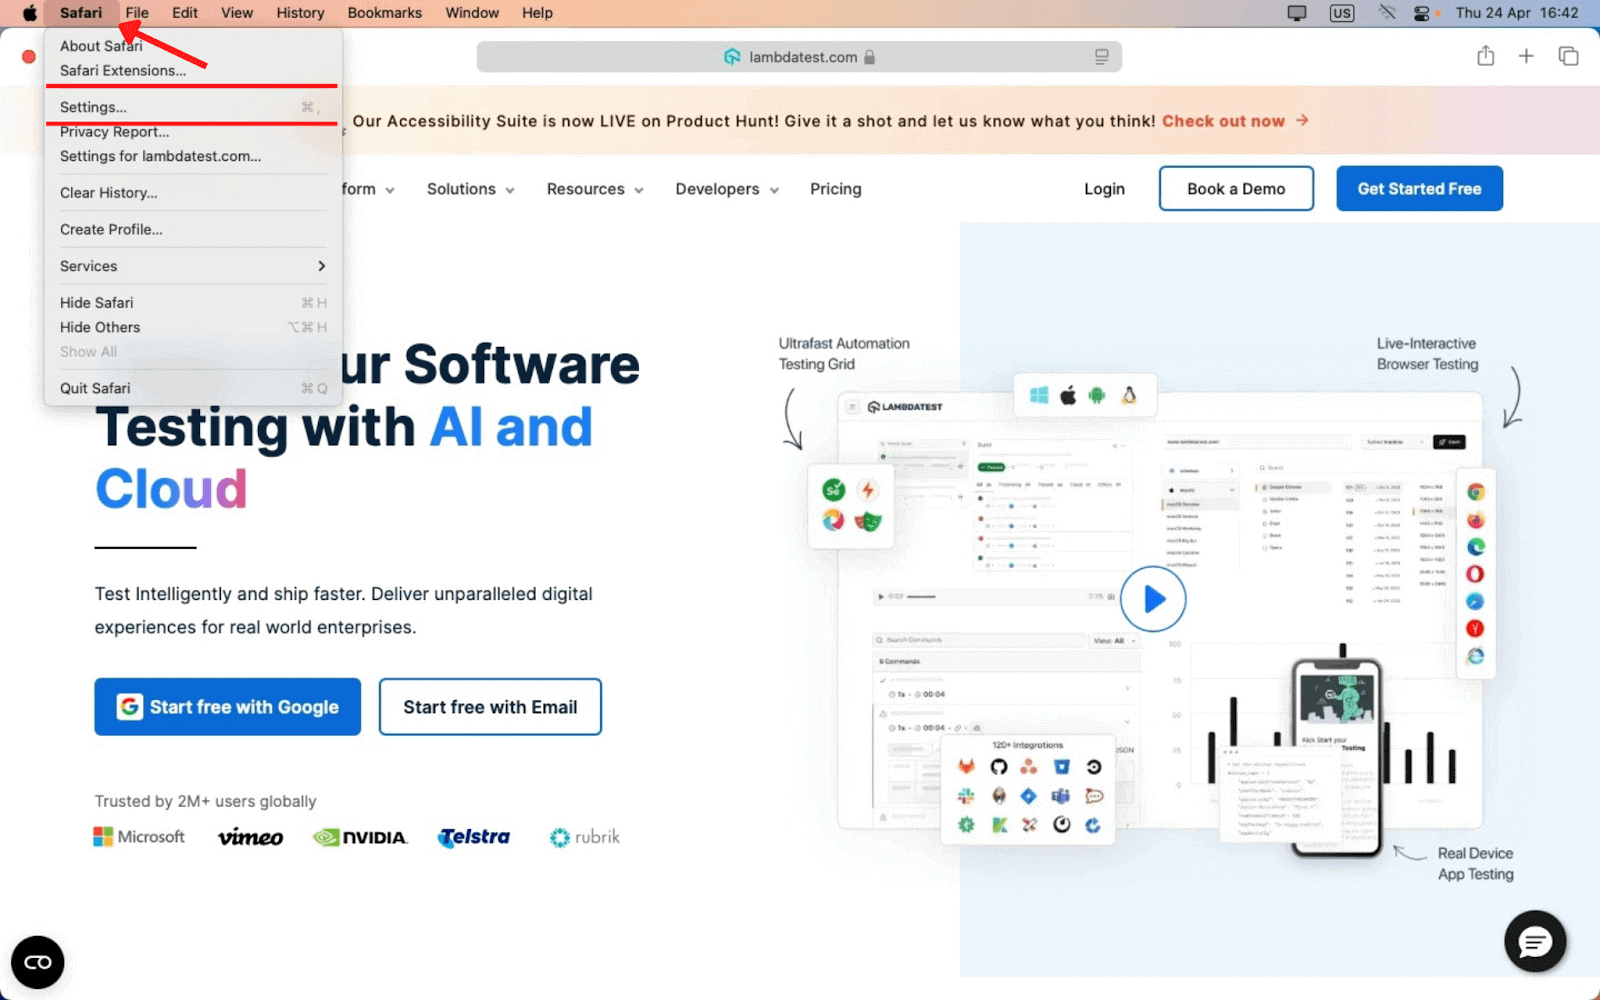
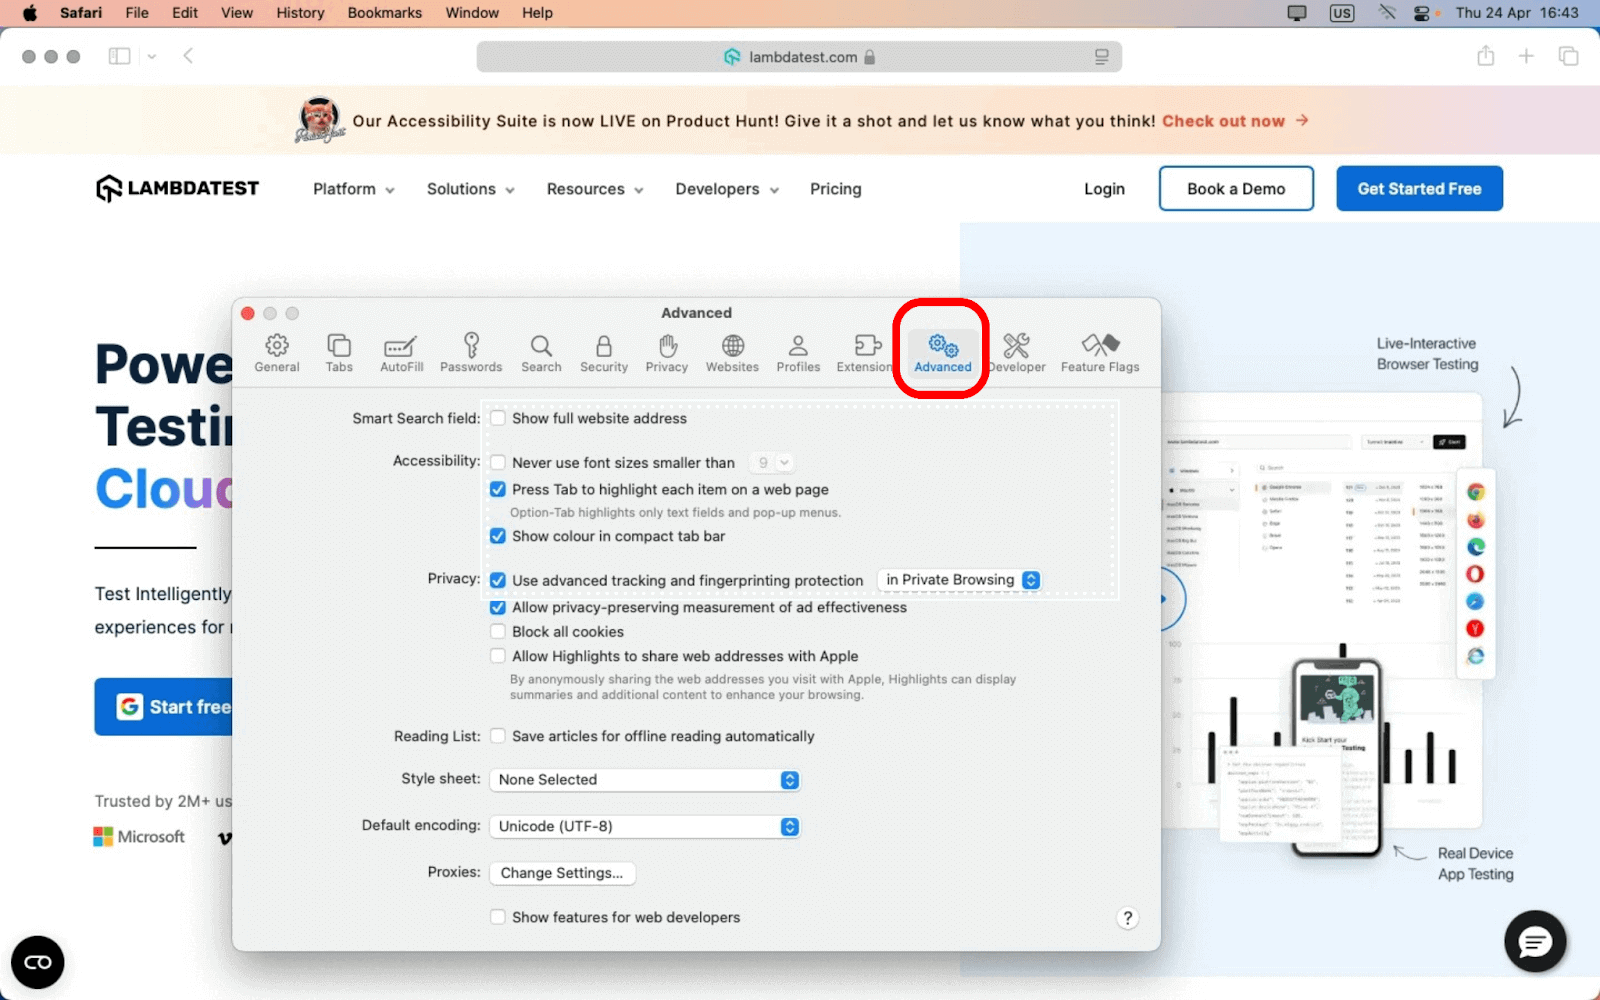
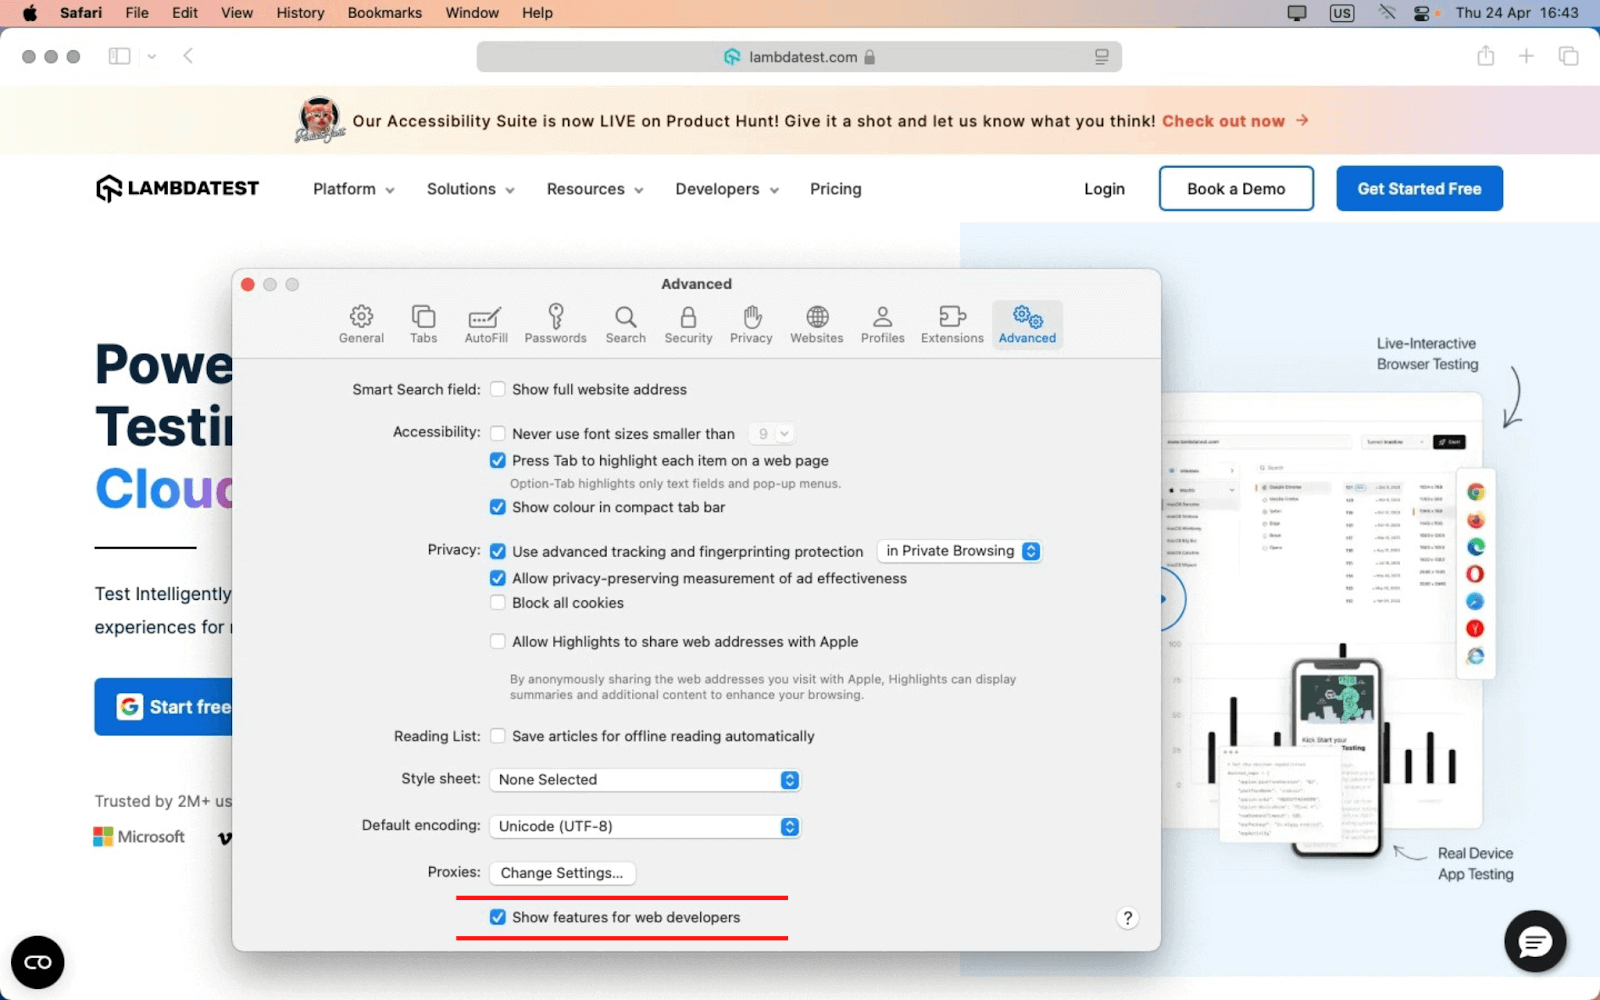
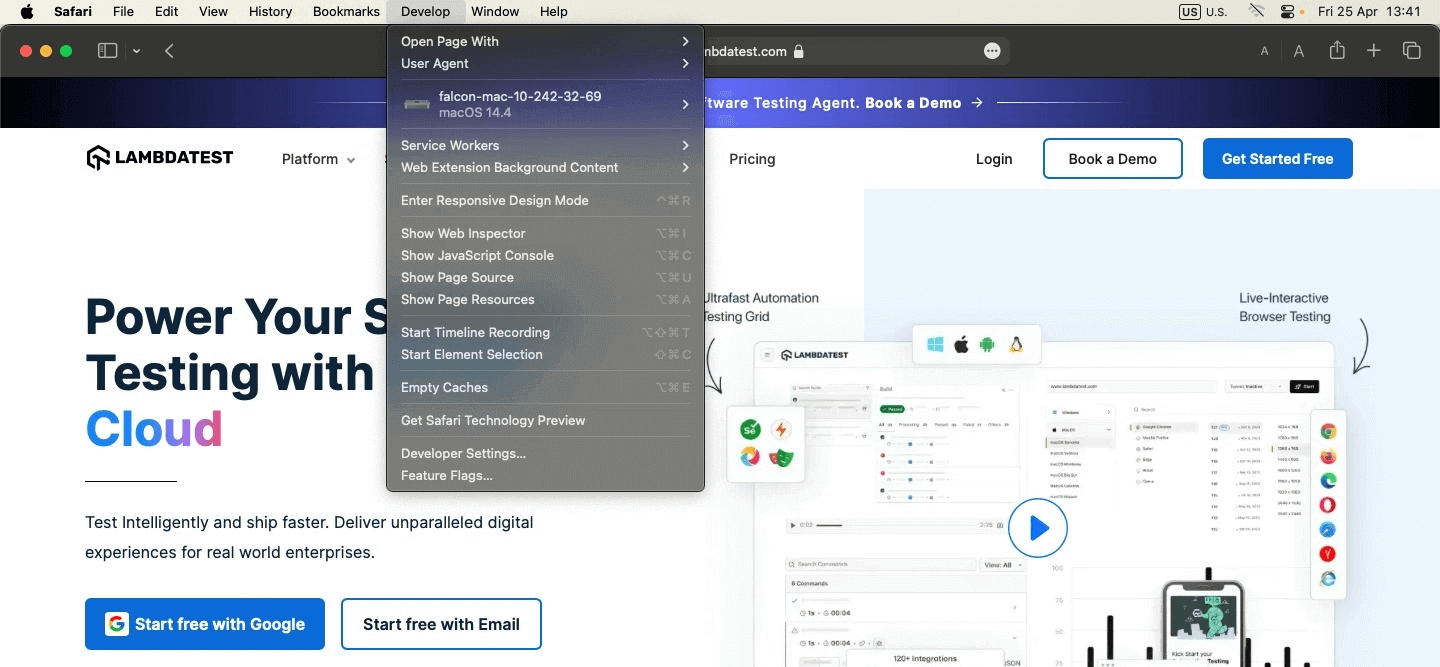
To enable the Safari Developer menu, follow the steps below:
- Open Safari Browser on your Mac.
- Click Safari in the top menu bar and select Settings (or Preferences in older versions).
- Go to the Advanced tab.
- Check the box at the bottom: “Show features for web developers.“
- Once enabled, you’ll see a new “Develop” option in the Safari menu bar, giving you access to powerful debugging tools.
If the Develop menu still does not appear, quit and reopen Safari. The setting is stored per user account, so it has to be enabled again on every Mac and every macOS user profile you work from. If you do not have a Mac to enable it on, a virtual macOS online session gives you desktop Safari on a real macOS machine in your browser.
Steps to Debug Using Safari Developer Menu Option
Safari’s Developer menu offers powerful tools to inspect, debug, and edit web pages in real time. It’s ideal for analyzing layout issues, reviewing CSS, and testing code changes instantly.
To get started, follow the steps below:
- Open the webpage in Safari.
- Go to Develop > Show Web Inspector.
- In the Elements tab, hover over the text element (e.g., a heading or paragraph) to highlight it on the page.
Check the applied CSS classes and computed styles in the right sidebar, for example, line-height, font size, and color. The Box Model section allows you to view padding, margin, border, and element dimensions (e.g., 521px × 986px).
- You can live-edit the CSS directly in the Styles pane (for example, change line-height: 30px to line-height: 25px) to preview layout and spacing changes in real time.
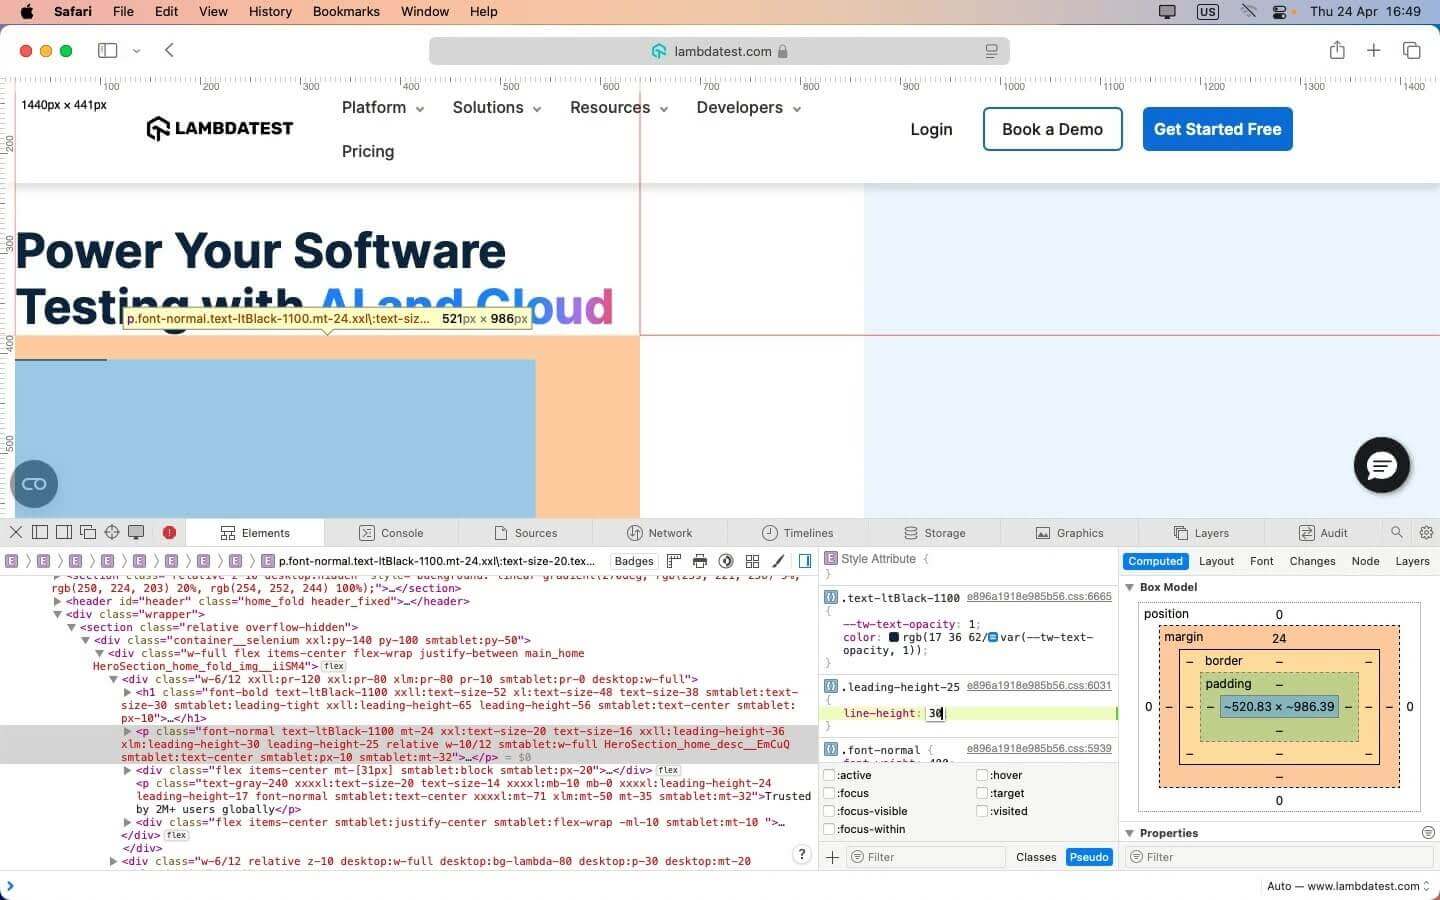
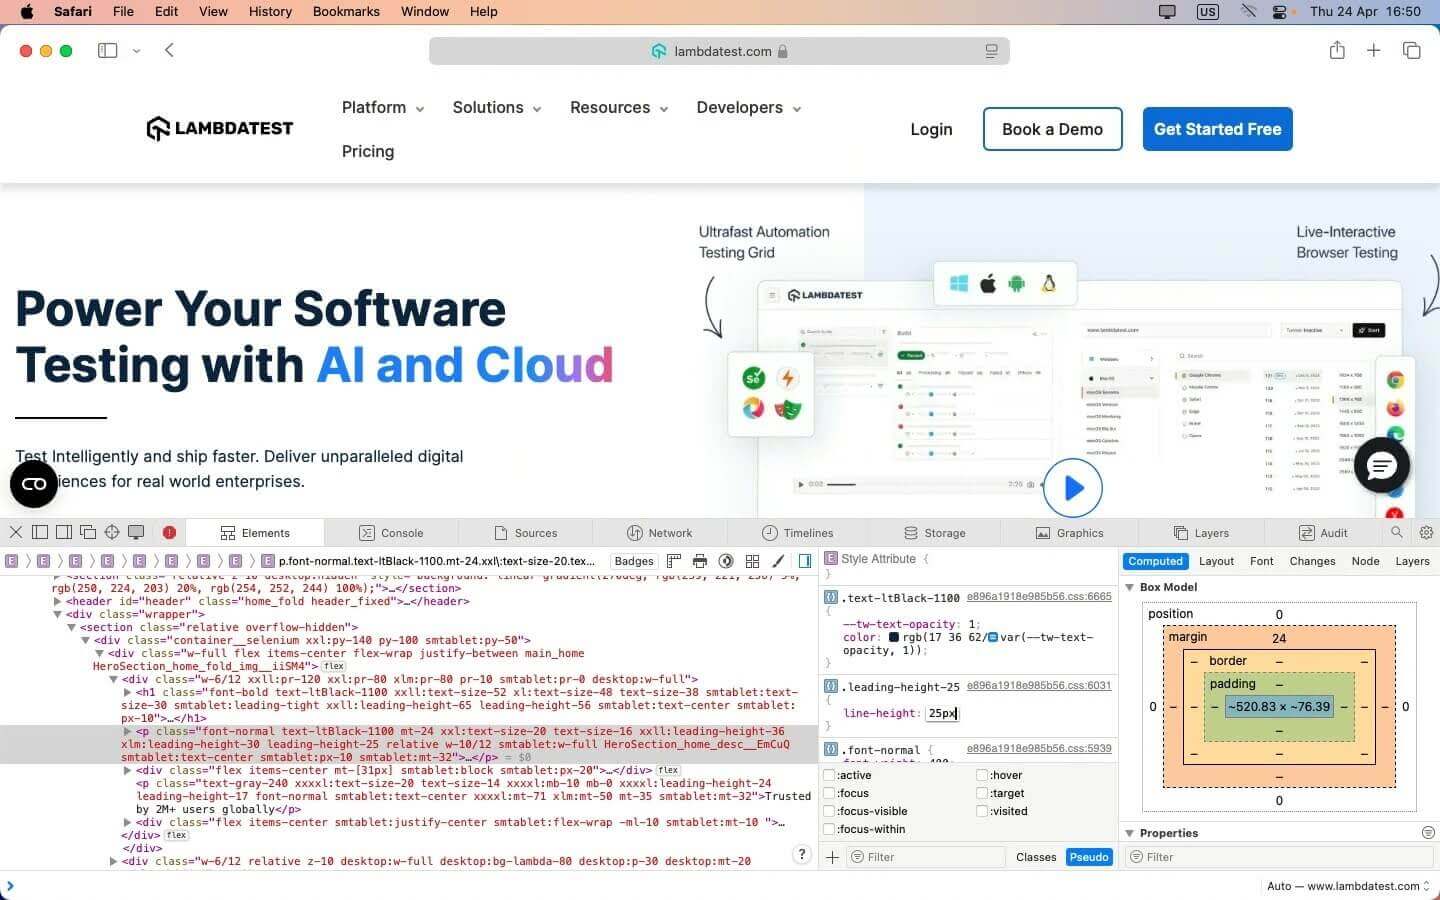
This process helps quickly identify and resolve front-end issues.
How to Enable Developer Mode on iOS 16 and iOS 17 (iPhone & iPad)
Two different settings get confused here, and picking the wrong one is the most common reason developers get stuck on iPhone. Safari on iOS and iPadOS has no Develop menu of its own (the screen is too small to host an inspector), so what you enable depends on what you are actually trying to do.
| Your goal | Setting to enable |
|---|---|
| Debug a website running in mobile Safari | Settings > Safari > Advanced > Web Inspector |
| Run or install a development-signed app from Xcode | Settings > Privacy & Security > Developer Mode |
Web debugging does not require Developer Mode. If your goal is inspecting a page, skip straight to the Web Inspector steps below.
Enabling Developer Mode on iOS 16 and iOS 17
Developer Mode arrived in iOS 16 and works the same way in iOS 17. It gates the device against running development-signed builds, and Apple keeps it off by default to protect users from being talked into sideloading malicious software.
- Connect the device to a Mac and attempt to run your app from Xcode at least once. Until you do, the Developer Mode entry stays hidden.
- On the device, open Settings > Privacy & Security.
- Scroll to Developer Mode and toggle it on.
- Tap Restart when prompted. The device reboots. This step is mandatory.
- After it restarts, unlock the device and tap Turn On on the confirmation dialog, then enter your passcode.
Developer Mode persists across reboots, so this is a one-time setup per device. It resets if you erase the device or leave it disconnected from Xcode for an extended period.
Debugging Mobile Safari From Your Mac
To inspect a page that is open on your iPhone or iPad, you pair the device with Safari on a Mac and use the Mac’s Web Inspector against the device’s live page:
- On the iPhone or iPad, go to Settings > Safari > Advanced and turn on Web Inspector.
- On the Mac, enable the Develop menu using the steps earlier in this guide.
- Connect the device to the Mac with a cable and tap Trust on the device if you are prompted.
- Open the page you want to debug in Safari on the device.
- On the Mac, open Develop, find your device by name in the list, and select the open page.
- Web Inspector opens on the Mac, wired to the page running on the device. DOM edits, CSS changes, and console output all apply to the real handset in your hand.
This is the only supported way to reach developer tools for iPhone Safari. Everything renders on the device, and the Mac supplies the interface. If the device never appears under Develop, confirm Web Inspector is on, re-seat the cable, and check that you tapped Trust. For more on what changes between the desktop and handset rendering path, see Safari mobile view.

Note: Don't have every iPhone and iPad on your desk? Debug mobile Safari on real iOS devices in the cloud with TestMu AI. Try it free!
Conclusion
The Safari Developer menu is an essential toolkit for web developers on macOS. Enabling it unlocks powerful tools for debugging, performance analysis, and real-time editing that streamline the development process.
On a Mac, it comes down to one checkbox: “Show features for web developers” on macOS Sonoma and Ventura, or “Show Develop menu in menu bar” on older releases. On iPhone and iPad, remember the split: Web Inspector under Settings > Safari > Advanced is what you need for web debugging, while Developer Mode under Settings > Privacy & Security exists for running development apps from Xcode.
Whether you’re inspecting elements, monitoring network activity, or fine-tuning load times, the Developer Menu makes web development more efficient and effective. Responsive Design Mode and a paired iPhone will catch most Safari-specific issues, but real coverage means checking against the range of devices and OS versions your users actually run. See mobile device testing for how to think about that matrix.
Author

Bhawana
Blogs: 75


Bhawana is a Community Evangelist at TestMu AI with over 3 years of experience creating technically accurate, strategy-driven content in software testing. She has authored 50+ blogs on test automation, cross-browser testing, mobile testing, and real device testing. She also serves as Product Marketing Manager for Kane CLI, the command-line tool that runs browser automation from the terminal using natural-language flows in a real Chrome browser. Bhawana is certified in KaneAI, Selenium, Appium, Playwright, and Cypress, reflecting her hands-on knowledge of modern automation practices. On LinkedIn, she is followed by 6000+ QA engineers, testers, AI automation testers, and tech leaders.


Frequently asked questions
Did you find this page helpful?
More Related Blogs
TestMu AI forEnterprise
Get access to solutions built on Enterprise
grade security, privacy, & compliance
- Advanced access controls
- Advanced data retention rules
- Advanced Local Testing
- Premium Support options
- Early access to beta features
- Private Slack Channel
- Unlimited Manual Accessibility DevTools Tests