

Power Your Software Testing with AI Agents and Cloud
The Native AI-Agentic Cloud Platform to Supercharge Quality Engineering. Test Intelligently and Ship Faster.


- TestMu AI (Formerly LambdaTest)
- /
- Learning Hub
- /
- White Box Testing: Techniques and Examples With Real Code
White Box Testing: Techniques and Examples With Real Code
White box testing explained with a real coverage run: statement, branch, and path coverage, worked examples, tools, and where a green report still hides bugs.
Last Updated on:
A coverage report that reads 100% feels like a finish line. It is not one. It tells you every line of code ran during your tests, which is a different claim from every line of code being correct, and the gap between those two sentences is where a surprising number of production bugs live.
TL;DR
White box testing is a software testing method where the tester can read the source code and designs test cases from its internal structure rather than from the requirements alone. It uses coverage techniques such as statement, branch, and path coverage to measure which lines and decisions a suite actually executed.
Core White Box Coverage Techniques
- Statement coverage: Measures the percentage of executable lines the test suite runs at least once. It is the weakest of the three techniques, because a line can execute under one input and still be wrong for every other input.
- Branch coverage: Measures whether every decision in the code was taken both ways. An if statement with no else still has two outcomes, and branch coverage is the technique that forces a test for the untaken one.
- Path coverage: Measures whether every feasible route through a function was exercised. It is the strongest technique and the least practical, since the number of routes grows quickly with each added decision.
- Cyclomatic complexity: Counts the decisions in a function and adds one, giving the number of independent paths a basis path suite needs. It is a sizing metric for how much testing a function will require.
Why Coverage Percentages Mislead
Coverage records execution, not correctness. Two coverage tools can report 100% and 50% branch coverage for the same file and the same test, because they count decisions differently, so the number alone is not a safety signal.
What is White Box Testing?
White box testing is a testing method in which the internal structure of the code is visible to the tester and is used to design the test cases. It is also called glass box, clear box, transparent box, or structural testing, and all five names point at the same property, which is that the implementation is not hidden.
That visibility changes what a test can target. In black box testing you can only reach the code through its public surface, so a branch that no realistic input triggers stays untested and unnoticed. With the source open in front of you, that branch is a line number, and you can write a test that drives execution straight into it.
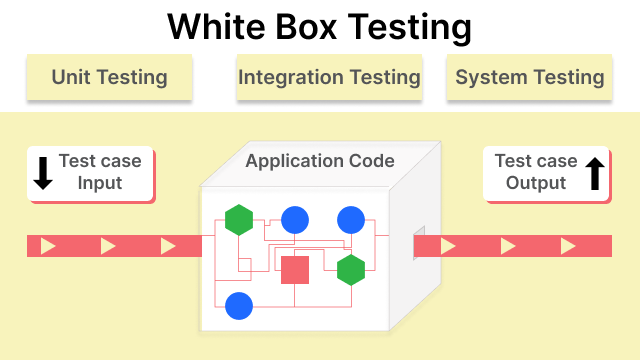
It sits at the lower levels of the test pyramid. Unit testing is almost always white box, because the person writing the test can see the function under test. Code-level integration testing usually is too. By the time you reach system and acceptance testing, the implementation is normally treated as opaque again.
The practical output of white box testing is a coverage number, and the rest of this guide is largely about reading that number correctly.
Why Perform White Box Testing?
Black box testing tells you whether the feature works for the inputs you thought to try. White box testing tells you which parts of the implementation nobody tried at all. Those are different questions, and only the second one can find code that no test has ever executed.
Four reasons teams invest in it:
- It finds untested code, not just failing code. A coverage report names the exact lines your suite never reached. No amount of black box testing can produce that list, because it has no view of the lines.
- Defects are cheapest here. White box testing runs at the unit level, which is the earliest point a defect can be caught by an automated test. The same bug found in production costs orders of magnitude more to fix.
- It exposes dead and unreachable code. Branches no input can trigger show up as permanently uncovered, which is a maintenance signal you cannot get from the outside.
- Security work depends on it. Tracing untrusted input from entry point to sink requires reading the code. This is why static application security testing and white box penetration testing both sit in this category.
It is most worth the cost on code where a silent wrong answer is expensive: pricing, tax, permissions, payment handling, and anything a regulator might ask about later. It is least worth the cost on thin presentation code that changes weekly.
Types of White Box Testing
The techniques above describe how you measure. These are the places the method gets applied:
- Unit testing is the largest category by volume. Functions and classes are tested in isolation by the developer who wrote them, and defects found here are the cheapest to fix in the entire lifecycle.
- Basis path testing derives the minimum test set from the control flow graph using cyclomatic complexity, as worked through above.
- Loop testing targets the three loop forms, simple, nested, and concatenated, at the values that break them: zero iterations, one iteration, and one past the intended maximum.
- Mutation testing deliberately introduces small faults into the code and checks whether the suite fails. A mutant that survives means a test is executing that line without asserting anything about it, which is the flaw the coverage run above demonstrated.
- Memory leak testing traces allocation and release through the implementation, which cannot be done from the outside on a long-running service.
- White box penetration testing gives the security tester source code, architecture, and infrastructure detail up front, so untrusted input can be traced through the code rather than guessed at.
- Static white box testing covers everything examined without execution, including code review and linting. It catches undefined variables and unreachable statements before a test ever runs.
White Box Testing Techniques
The three core techniques form a ladder. Each one subsumes the one below it, and each one costs more to satisfy. Working through them against the same applyBulkDiscount function makes the difference concrete.
Statement Coverage
Statement coverage is the percentage of executable lines run at least once, calculated as executed statements divided by total statements. It is the cheapest technique and the easiest to satisfy, which is exactly why it is the easiest to be fooled by. The single 60-unit test above reached 100% statement coverage on a function containing two bugs.
Branch Coverage
Branch coverage, also called decision coverage, asks whether every decision has been evaluated both true and false. The function has two if statements, so four outcomes need exercising. The 60-unit test covers two of them, which is where the 50% reading comes from. Reaching 100% requires at least one input below each threshold, and writing those inputs is what exposed the boundary bugs.
Branch coverage is the single highest-value technique to enforce in a pipeline. It is achievable on real codebases, and unlike statement coverage it cannot be satisfied without thinking about the negative case.
Path Coverage and Cyclomatic Complexity
Path coverage requires every feasible route through the function to be exercised. Two sequential if statements suggest four combinations, but one of them is unreachable: units cannot be 51 or more without also being 11 or more, so the combination "first condition false, second condition true" can never occur. Three feasible paths, not four.
That number is predictable in advance. Cyclomatic complexity, the metric formalized in NIST Special Publication 500-235, counts the decision points in a function and adds one. Two decisions gives a complexity of 3, which is the size of the basis path set, and it matches the three feasible paths exactly.
Complexity is a useful budgeting tool. A function with a complexity of 3 needs three tests. A 200-line function with fifteen nested conditions needs a number nobody is going to write, which is a signal to split the function rather than a signal to test harder.
White Box Testing Example
Here is the method applied end to end on a single function. It applies volume discounts against a published price sheet promising 5% off from 10 units and 15% off from 50 units.
function applyBulkDiscount(units, unitPrice) {
  let rate = 0;
  if (units > 10) {
    rate = 0.05;
  }
  if (units > 50) {
    rate = 0.15;
  }
  return Number((units * unitPrice * (1 - rate)).toFixed(2));
}
Step one is counting the decisions. There are two, so cyclomatic complexity is 3 and the basis path set needs three tests. Note that two if statements suggest four combinations, but one is unreachable: units cannot exceed 50 without also exceeding 10, so the combination "first false, second true" can never occur.
Step two is designing a test per technique. This is where the three techniques stop being abstract:
| Technique | Test cases it demands | What it leaves untested |
|---|---|---|
| Statement coverage | One case, units = 60, which executes every line including both if bodies | Every input below a threshold. The false side of both decisions is never evaluated. |
| Branch coverage | Adds units = 9, forcing both decisions to evaluate false at least once | The exact threshold values, unless you deliberately choose them as your inputs. |
| Path coverage | Three cases, one per feasible path: below both tiers, in the middle tier, in the top tier | Nothing structural, though it still says nothing about whether the returned number is correct. |
Step three is choosing the input values, and this is the step that finds the bug. Boundary values are the ones worth picking, so instead of testing 9 and 60, test the thresholds themselves:
test('9 units pay list price', () => {
  assert.strictEqual(applyBulkDiscount(9, 10), 90);
});

test('10 units get the 5 percent tier', () => {
  assert.strictEqual(applyBulkDiscount(10, 10), 95);
});

test('50 units get the 15 percent tier', () => {
  assert.strictEqual(applyBulkDiscount(50, 10), 425);
});
Two of the three fail on a real run:
✔ 9 units pay list price
✘ 10 units get the 5 percent tier
    actual: 100, expected: 95
✘ 50 units get the 15 percent tier
    actual: 475, expected: 425

ℹ tests 3
ℹ pass 1
ℹ fail 2
Both conditions use a strict greater-than where the price sheet says "or more". A customer ordering exactly 50 units is overcharged by 50 dollars, and a customer ordering exactly 10 gets no discount at all. Changing both to >= turns the suite green.
That is the whole method in three steps: count the decisions, pick a technique, choose boundary values. The last step matters most, and it is the one a coverage percentage will never prompt you to do.
When a Coverage Number Lies
There is a second failure mode worth knowing about, and it surprised us when we measured it. The tool reporting your coverage may not count decisions the way you assume.
Using the single 60-unit test from the example above, on Node.js v24.18.0, the coverage reporter built into the Node.js test runner reports a clean sweep:
$ node --test --experimental-test-coverage

file       | line % | branch % | funcs % | uncovered lines
-----------------------------------------------------------
pricing.js | 100.00 |   100.00 |  100.00 |
-----------------------------------------------------------
The same file and the same test, measured with nyc 18.0.0, the Istanbul-based reporter:
$ npx nyc --reporter=text node --test

File        | % Stmts | % Branch | % Funcs | % Lines | Uncovered Line #s
------------|---------|----------|---------|---------|-------------------
 pricing.js |     100 |       50 |     100 |     100 | 3-6
A fifty point disagreement on branch coverage, and the two bugs from the example live in exactly the lines Istanbul flags. The reason is the counting model. V8-based reporters count executed blocks, and an if statement with no else has no separate block for the untaken path, so nothing is flagged as missed. Istanbul instruments the syntax tree instead and creates a counter for both outcomes of every decision, including the implicit else.
The practical takeaway is short. Before you set a coverage threshold that anyone is held to, run both kinds of reporter once on the same file and see whether they agree. A gate set against the more permissive model can be passed by a suite that never tests a negative case.
How to Perform White Box Testing
Five steps, in the order they actually happen:
- Pick a unit small enough to reason about. A single function or class. The smaller the target, the closer you can get to exhausting its behaviour, which is the whole point of the method.
- Map the control flow. List every decision and count them. The count plus one gives the number of independent paths, which tells you how many tests to budget before writing any.
- Write a test per path, starting with the negative cases. Most developers write the happy path first and stop, which is precisely how the 100% reading above happened. Reverse the order and the boundary cases get written while you still have attention left.
- Measure with a tool whose counting model you have checked. Run both an Istanbul-based and a V8-based reporter once on the same file to see whether they agree. If they do not, standardize on the stricter one before setting any threshold in CI.
- Re-run on every change and treat a coverage drop as a review comment. Coverage is most useful as a delta. An absolute threshold invites gaming, whereas a drop on a specific pull request points at a specific untested branch.
Step two is where most teams stop investing, and it is the step that determines whether the rest is worth doing. Detailed guidance on turning a control flow map into cases is in our guide on writing test cases effectively.
White Box vs Black Box Testing
The two methods fail in opposite directions, which is why mature suites run both. White box testing cannot tell you a required feature was never built, because there is no code to cover. Black box testing cannot tell you a branch is unreachable, because it never sees the branch.
| Aspect | White box testing | Black box testing |
|---|---|---|
| Test cases derived from | The implementation, including branches, loops, and boundary conditions visible in the code | The specification, requirements, and expected user behaviour |
| Performed by | Developers and SDETs who can read the codebase | Testers, and often people with no access to the source |
| Starts when | The implementation exists, since the code is the input | The requirements exist, so test design can begin before any code is written |
| Primary metric | Code coverage: statement, branch, and path percentages | Requirements coverage and defect detection rate |
| Catches well | Untested branches, unreachable code, boundary and logic errors, memory issues | Missing features, misread requirements, integration and usability failures |
| Misses | Anything that was never implemented, because absent code cannot be covered | Dead code and rarely triggered branches no realistic input reaches |
| Cost of a refactor | High, since tests are coupled to the structure they measure | Low, since tests survive any refactor that preserves behaviour |
| Typical level | Unit and code-level integration | System, acceptance, and functional testing |
Gray box testing sits between them, giving the tester partial knowledge such as the database schema or the API contract without the full source. It is common in integration and security work, where knowing the shape of the system is enough to design better inputs.

White Box Testing Tools
White box tooling splits into two jobs: the framework that runs your tests, and the reporter that measures what they touched. The pairing matters more than either choice alone, as the fifty-point disagreement above showed.
| Tool | Ecosystem | What it does |
|---|---|---|
| nyc / Istanbul | JavaScript and TypeScript | AST-instrumented coverage reporting. Counts both outcomes of every decision, including implicit else branches, which makes it the stricter option. |
| Node.js built-in reporter | JavaScript | V8 block coverage through the native test runner, with no dependency to install. Faster, but more permissive on branch counting. |
| Jest and Vitest | JavaScript and TypeScript | Test frameworks with coverage built in, both delegating to Istanbul or V8 depending on configuration. |
| JaCoCo | Java and JVM | Bytecode-level coverage with separate line, branch, and cyclomatic complexity counters, and the usual choice for Maven and Gradle builds. |
| Coverage.py | Python | Statement and branch coverage for pytest and unittest suites, with per-file thresholds. |
| gcov and lcov | C and C++ | Compiler-integrated coverage through GCC, reporting line and branch execution counts. |
| PIT | Java | Mutation testing that measures whether tests actually assert on the lines they execute, which is the gap coverage alone cannot see. |
| SonarQube | Multi-language | Static analysis that aggregates coverage alongside complexity and code smells, and enforces quality gates on pull requests. |
A note on older guides, including earlier versions of this one: JSUnit and CSUnit are frequently still listed as white box tools. Both have been unmaintained for well over a decade and should not be used on new projects. Their modern replacements are Jest or Vitest for JavaScript and NUnit or xUnit for .NET.
Advantages and Limitations
White box testing earns its cost at the unit level and loses it quickly above that. The advantages first:
- Coverage is measurable. It is one of the few testing methods that produces an objective number, which makes it possible to spot regressions in test quality on a pull request.
- It runs fast and automates cleanly. Unit-level tests execute in seconds and need no environment, so they can gate every commit rather than every release.
- Testing can start before the UI exists. The code is the input, so the suite does not wait on a finished interface.
- It localizes defects precisely. A failing unit test names the function. A failing end-to-end test names the journey and leaves you to find the function.
- It surfaces dead code. Permanently uncovered branches are a maintenance signal no black box method can produce.
And the limitations, which are worth budgeting for rather than arguing with:
- Tests are coupled to structure. A refactor that preserves behaviour can still invalidate the suite, because it was written against the branches rather than the contract. This is the tax you pay for precision.
- Exhaustive path testing is infeasible. Feasible paths grow with every added decision, and loops make the count unbounded in principle. Basis path testing is the practical compromise.
- It requires people who can read the code. That limits who on the team can contribute, and makes it expensive on codebases in unfamiliar languages.
- It cannot find missing features. Absent code cannot be covered, so a requirement nobody implemented is invisible to every technique here.
- High coverage reads as safety. The most expensive limitation, because it is social rather than technical. A green 100% ends conversations that should still be happening.
The way to hold coverage honestly is to treat it as a floor that catches regressions, never as evidence the behaviour is right. Our comparison of code coverage versus test coverage works through the distinction, and the test coverage guide covers what to measure alongside it.
Where White Box Coverage Stops
Every technique in this guide operates on one surface: the source code. Statement coverage, branch coverage, mutation testing, and static analysis all read the implementation and reason about it. That shared surface is their strength and also their ceiling.
Nothing in a coverage report knows what the customer saw. In the run above, the fixed function returns 425 for 50 units, and a passing unit test proves that. It does not prove the checkout page displayed 425, that the discount line item rendered, or that the total the payment processor received matched the one on screen. Those failures live in the rendered result, and no amount of code-level coverage reaches them.
This gap widened once AI coding agents entered the loop. An agent reads code, writes code, and verifies with unit tests, type checkers, and linters, every one of which operates on that same closed code surface. When the agent reports "passed", it is reporting on the code, not on the page.
Kane CLI is built to close that specific gap. It is a deterministic browser agent that drives a real Chrome instance through the Chrome DevTools Protocol and validates the rendered UI from a natural language objective, with no selectors to maintain. It does not read your code. It watches what the code produced.
npm install -g @testmuai/kane-cli

kane-cli run "add 50 units of the standard plan to the cart, \
assert the order total reads 425.00" --url http://localhost:3000
A pass is granted only on explicit evidence, meaning DOM state, URL changes, network responses, screenshots, or console logs, so the outcome is reproducible even though the model reasoning behind it is not. Every run leaves a session directory containing a step-by-step record of the agent's actions, screenshots, and a full trace, which is the artifact a coverage percentage never gives you.
The division of labour is clean. Branch coverage proves the discount tier was exercised. Kane CLI proves the customer was charged 425.

Note: Coverage proves the line ran. Driving the flow in a real browser proves the number on screen is right. Kane CLI does the second from your terminal. Read the Kane CLI docs
White Box Testing Best Practices
Six practices separate a suite that catches regressions from one that only produces a number:
- Gate on branch coverage, not statement coverage. Statement coverage can be satisfied without ever testing a negative case. Branch coverage cannot, which is why it is the only one of the two worth enforcing.
- Always test at the boundary, never near it. Testing 9 and 60 units passes. Testing 10 and 50 finds the bug. Off-by-one errors live exactly on the threshold and nowhere else.
- Track coverage as a delta, not an absolute. A fixed threshold invites gaming with assertion-free tests. A drop on a specific pull request points at a specific untested branch.
- Split functions that score high on complexity. A cyclomatic complexity above roughly 10 means the test count needed is no longer realistic. That is a refactoring signal, not a reason to test harder.
- Add mutation testing where correctness is expensive. It is the only cheap way to detect tests that execute a line without asserting anything about it, which is the failure the example above demonstrates.
- Pair it with a method that sees the rendered result. Code-level coverage is blind to what the user was shown, which the next section covers in detail.
Conclusion
White box testing is the only method that can tell you which parts of your implementation your tests never touched. That is a genuinely valuable answer, and it is a narrower one than the percentage on the dashboard suggests. The experiment in this guide took one function, one test, and two standard tools to produce readings of 100% and 50% on the same code, with two live overcharging bugs sitting in the difference.
Three things follow. Enforce branch coverage rather than statement coverage, since only the former forces a test for the negative case. Check which counting model your reporter uses before you set a threshold anyone is held to. And pair the code-level suite with something that verifies the rendered result, because no coverage tool can see the page.
Once the unit layer is solid, the next constraint is usually environments rather than logic. TestMu AI runs your Selenium, Cypress, and Playwright suites across 3,000+ browser and OS combinations on Automation Cloud, and the automation docs cover wiring coverage reporting into that pipeline.
What are the three main white box testing techniques?
The three main white box testing techniques are statement coverage, branch coverage, and path coverage. Statement coverage checks that every line runs at least once. Branch coverage checks that every decision is taken both ways. Path coverage checks that every feasible route through the function is exercised. Each one is strictly stronger than the one before it.
What is white box testing in software testing?
White box testing is a method where the tester can read the source code and designs test cases from its internal structure rather than from the requirements alone. Because the code is visible, test cases can target specific branches, loops, and boundary conditions, and coverage tools can measure exactly which of them the suite executed.
Can a test suite hit 100% coverage and still miss bugs?
Yes, and it is common. Coverage records which lines and decisions executed, not whether the result was correct. In our own run, a single test produced 100% statement coverage on a pricing function that overcharged customers by 50 dollars at one of its tier boundaries. The line ran, the assertion never checked that boundary, and the report stayed green.
Why do two coverage tools report different numbers for the same code?
Because they count branches differently. V8-based tools such as the Node.js built-in coverage reporter count executed blocks, and an if statement with no else has no separate block for the untaken path. Istanbul-based tools such as nyc instrument the syntax tree and create a counter for both outcomes of every decision, including the implicit else.
Who performs white box testing?
Developers usually perform white box testing, because it requires reading the code and understanding the language it is written in. SDETs and automation engineers also run it when they own the unit and integration layers. Testers without code access cannot perform it, which is why it sits at the lower levels of the test pyramid.
What are the types of white box testing?
The common types are unit testing, integration testing at the code level, basis path testing, loop testing, mutation testing, memory leak testing, and white box penetration testing. They differ in what they target, but all of them share the same precondition, which is visibility into the implementation.
What is white box testing vs black box testing?
White box testing designs test cases from the implementation and measures how much of it ran. Black box testing designs test cases from the specification and ignores the implementation entirely. White box catches unreachable code, untested branches, and logic errors. Black box catches missing features and requirements the code never implemented.
What is static white box testing?
Static white box testing examines source code without executing it. Code review, linting, and static application security testing all fall into this category. It catches undefined variables, unreachable statements, and known insecure patterns early, but it cannot observe runtime behaviour, so it is normally paired with a dynamic coverage-driven suite.
What is white box penetration testing?
White box penetration testing is a security assessment where the tester is given full access to source code, architecture diagrams, and infrastructure detail before starting. That access makes it far more thorough than a blind assessment, because the tester can trace untrusted input through the code instead of guessing where it flows.
What are the challenges in white box testing?
The main challenges are cost and false confidence. It requires testers who can read the codebase, tests need rewriting whenever the implementation is refactored, and exhaustive path testing is infeasible on anything but small functions. The subtler challenge is that a high coverage number reads as safety when it only measures execution.
Author

Sakshi John


Sakshi John is an experienced technical content writer with over 5 years of expertise in automation, AI-driven testing, and cross-browser testing. She has contributed to prominent platforms like TestMu AI and worked as a Communications Consultant at the United Nations APCTT. Sakshi holds a Master's degree in International Relations and has authored numerous technical blogs, enhancing her credibility in the software testing industry.
Reviewer

Salman Khan
Reviewer
Salman is a Test Automation Evangelist and Community Contributor at TestMu AI, with over 6 years of hands-on experience in software testing and automation. He has completed his Master of Technology in Computer Science and Engineering, demonstrating strong technical expertise in software development, testing, AI agents and LLMs. He is certified in KaneAI, Automation Testing, Selenium, Cypress, Playwright, and Appium, with deep experience in CI/CD pipelines, cross-browser testing, AI in testing, and mobile automation. Salman works closely with engineering teams to convert complex testing concepts into actionable, developer-first content. Salman has authored 120+ technical tutorials, guides, and documentation on test automation, web development, and related domains, making him a strong voice in the QA and testing community.


White Box Testing FAQs
Did you find this page helpful?
More Related Learning Hubs
TestMu AI forEnterprise
Get access to solutions built on Enterprise
grade security, privacy, & compliance
- Advanced access controls
- Advanced data retention rules
- Advanced Local Testing
- Premium Support options
- Early access to beta features
- Private Slack Channel
- Unlimited Manual Accessibility DevTools Tests