
Power Your Software Testing with AI Agents and Cloud
The Native AI-Agentic Cloud Platform to Supercharge Quality Engineering. Test Intelligently and Ship Faster.

- TestMu AI (Formerly LambdaTest)
- /
- Blog
- /
- How to Test a SaaS Dashboard Without Code
How to Test a SaaS Dashboard Without Code (2026 Guide)
Test filters, dynamic widgets, role-based views, and the data behind every chart on your SaaS dashboard in plain English. No Selenium, no code.
Last Updated on:
KaneAI tests a SaaS dashboard by writing plain-English steps that check a widget's rendered number against the API response behind it, rather than only confirming a click landed. It also catches a chart that stays stale after a filter changes and confirms a read-only viewer cannot see an admin-only export button, without a single Selenium selector.
Why SaaS dashboards are hard to test
A dashboard looks like one screen, but it is really dozens of moving parts that all have to agree with each other:
- Dynamic widgets that load asynchronously, so a chart, a table, and a KPI card each finish rendering at their own pace and a test has to wait for the right one
- Filters and date ranges that must re-query the backend, so the visible number is only correct if the underlying request actually changed
- Role-based views, where an admin, an editor, and a read-only viewer must each see a different set of widgets, filters, and export controls
- Data-driven assertions, because a green pass on a click means nothing if the chart is plotting stale or wrong values
- Empty, loading, and error states that only appear for new accounts, throttled APIs, or a tenant with no data yet
- Charts and canvas elements that render as pixels, not text, so there is no simple label to read back and confirm
And that is one tenant on one screen size. Real coverage means testing across account plans, empty vs. populated data, and every browser and device your customers open the dashboard on.
The old way: brittle dashboard scripts
Here is what it takes just to load a dashboard, apply a date filter, and confirm the revenue widget updated, in a typical Selenium setup:
const driver = await new Builder().forBrowser("chrome").build();
await driver.get("https://yourapp.com/dashboard");
await driver.wait(until.elementLocated(By.css(".widget-revenue canvas")), 10000);
const before = await driver.findElement(By.css(".widget-revenue .total")).getText();
await driver.findElement(By.css("select#date-range")).click();
await driver.findElement(By.css("option[value='last-7-days']")).click();
const spinner = await driver.findElement(By.css(".chart-loading"));
await driver.wait(until.stalenessOf(spinner), 10000);
const after = await driver.findElement(By.css(".widget-revenue .total")).getText();
assert.notStrictEqual(before, after, "Revenue widget did not update after the filter");
Ten lines, and it is already brittle. It hangs on a class name for the widget, a class name for the loading spinner, and an option value for the filter, and any one of them changing quietly breaks the test. Maintenance like this is the dominant cost of a large automation suite: engineers spend a large share of every sprint re-pointing selectors and re-timing waits instead of adding new coverage. And it still requires someone who writes JavaScript or Python in the first place, which asynchronous widgets and canvas charts only make harder. That is the core tradeoff behind code-based vs. codeless test automation.
If you are a manual QA engineer, a product manager, or a founder without a dedicated automation engineer, the code wall means the dashboard usually gets checked by hand, one filter and one role at a time, and never on the full matrix of browsers before a release.
The no-code way: write the test the way you would explain it
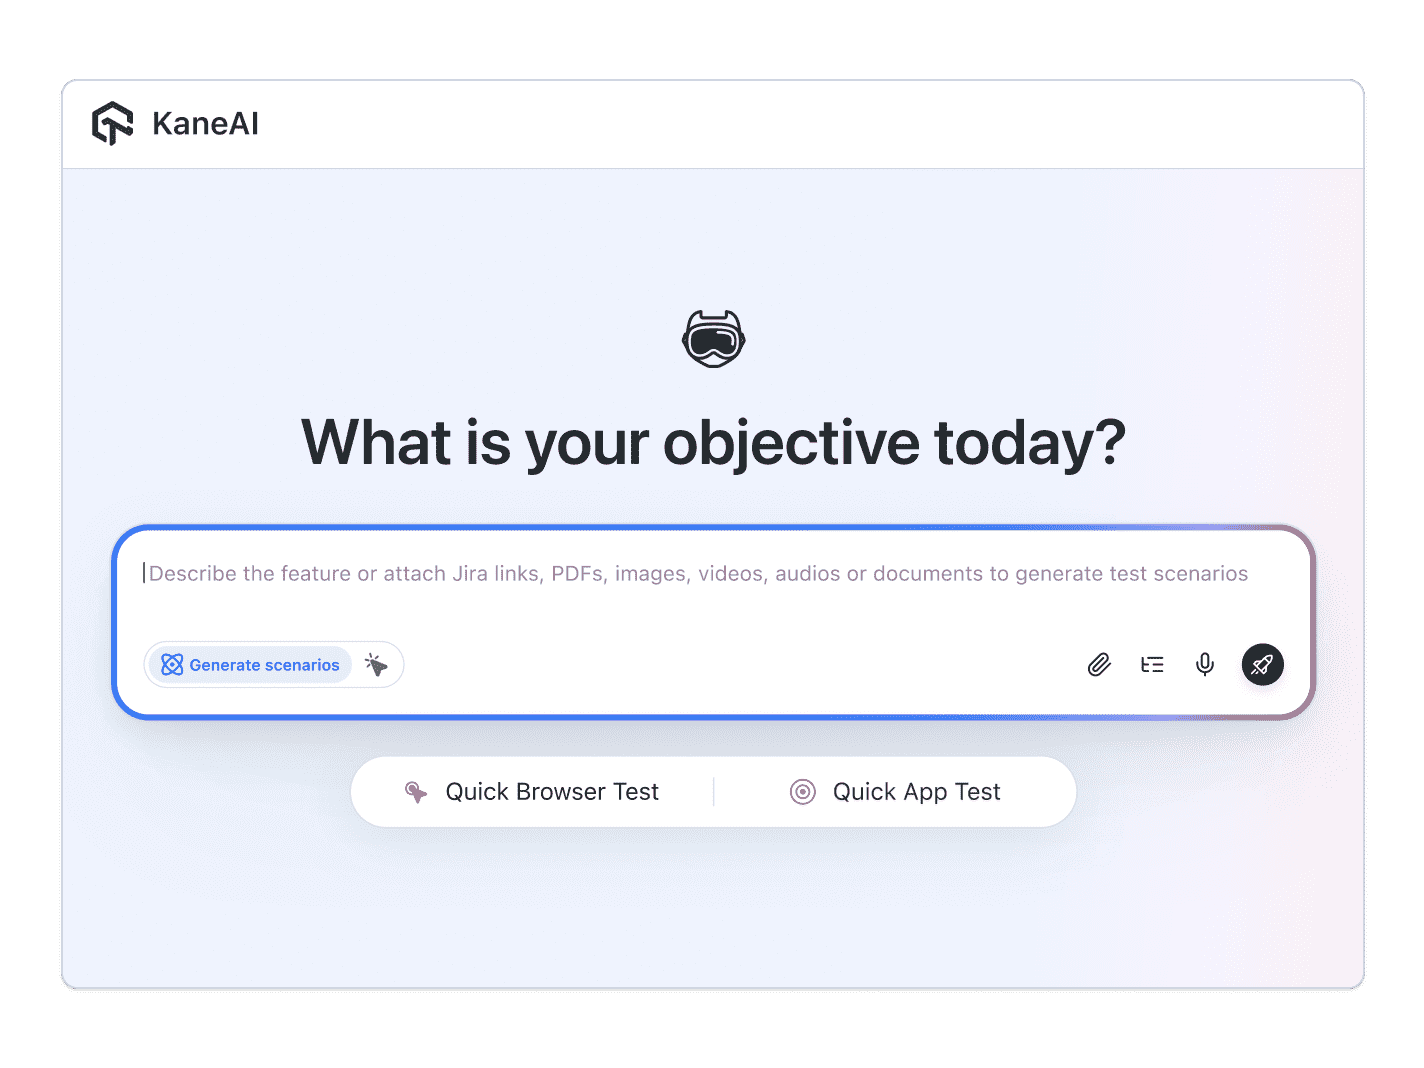
With KaneAI, you write that same scenario in plain English:
- Go to yourapp.com and open the analytics dashboard
- Wait for the revenue widget to finish loading and note the total shown
- Change the date range to Last 7 Days
- Verify the revenue total changes and the chart re-renders with the new range
- Verify the API response behind the widget matches the number on screen
That is the whole test. KaneAI reads each step, finds the right widget and filter on your live dashboard the way a human tester would, by understanding the page rather than matching brittle CSS selectors, and runs it. When a developer renames a KPI card or re-orders the grid, the test adapts instead of breaking, and self-healing re-anchors the step and flags the change for you. For a dashboard specifically, that means it handles dynamic widgets that load at their own pace, role-based views for each user type, data-driven assertions that confirm the value on screen is right, and API-plus-UI validation that proves a filter actually changed the underlying query result rather than just repainting the same numbers. When the dashboard reads from a warehouse, the expected value can come straight from the source query; the guide to Snowflake automation testing shows that pattern.

The SaaS dashboard scenarios that actually break
Once the happy path works, real coverage is just more English. Here are the dashboard scenarios worth adding, each takes about two minutes to write:
Filter changes the data, not just the view
- Note the value in a KPI widget, then apply a region or date filter
- Verify the widget value and the chart both change
- Verify the request behind the widget returned data for the new filter and not the old one
Role-based views
- Sign in as a read-only viewer and open the dashboard
- Verify the admin-only export and settings controls are not visible
- Sign in as an admin and verify those same controls are available
Empty and error states
- Open the dashboard for a brand-new tenant with no data yet
- Verify a friendly empty state appears instead of a blank chart or a broken widget
- Verify a clear message appears when a widget's data source fails to load
Export and drill-down
- Export the current view to CSV and verify the file downloads with the filtered rows
- Click a chart segment and verify it drills into the matching detail table
- Verify the drill-down totals reconcile with the summary widget above them
Run all of them across Chrome, Safari, Firefox, and real mobile devices from the same plain-English steps, with no per-browser rewrites.
Putting it on autopilot
Dashboard tests are most valuable when they run without you:
- Schedule the suite nightly, so a data-pipeline change overnight cannot quietly leave every chart showing yesterday's numbers
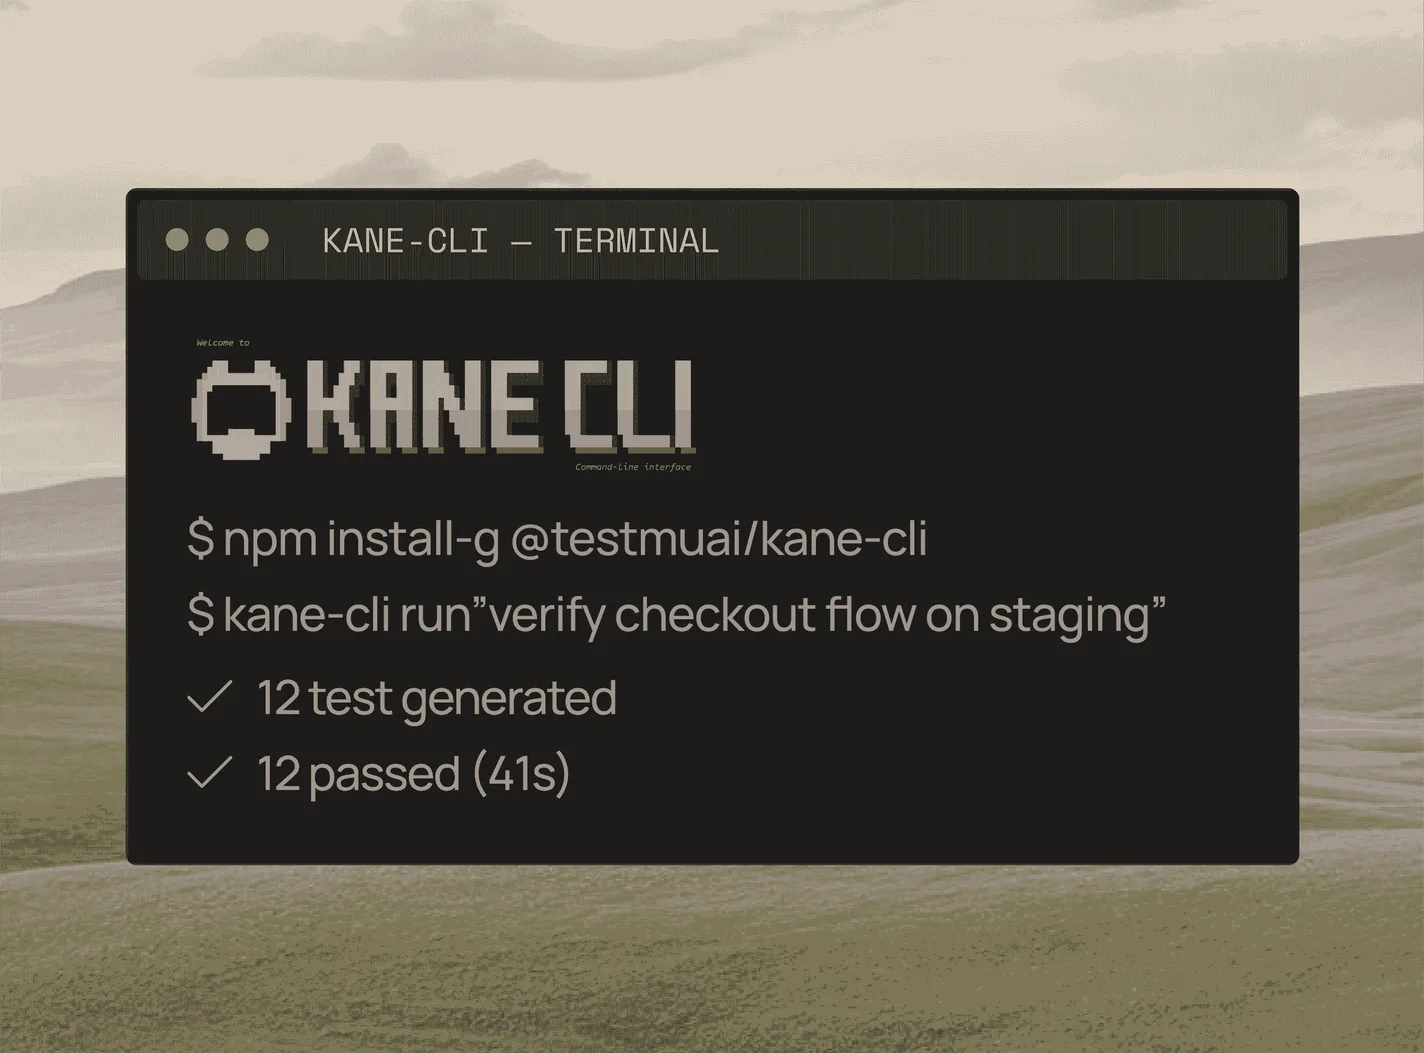
- Trigger on deploy via CI, where Kane CLI runs the same tests from your pipeline and returns a clean exit code your build can gate on
- Alert on failure in Slack, with a full replay of exactly what the AI saw when the step failed: screenshots, video, and the reason in plain English
When a test fails, you do not get a stack-trace exception at line 47. You get a plain-English reason for the exact step that failed. Anyone on the team can read it, and anyone can fix the test, because the test is just English.
Try it on your own dashboard in 10 minutes
- Sign up for KaneAI free, with no credit card
- Paste your dashboard URL
- Write your first test in plain English, apply a filter and check a widget, or let KaneAI suggest one from your screen
- Run it and watch your dashboard get tested end to end
Your dashboard is too important to check by hand and too dynamic for brittle scripts. Test it in the language you already speak. Once the dashboard is covered, read how to test the flows around it: subscription flows that gate access to it, and the multi-step forms your users fill in to create the data it displays. For the wider stack that covers every quality layer around them, compare the leading SaaS testing tools.

Note: Test your SaaS dashboard without writing a line of code. Start with KaneAI free.
Author

Abhishek Mishra
Blogs: 16

Abhishek Mishra is a Technical Product Manager at TestMu AI, where he owns Test Manager, the test management product. He has over 8 years of experience in product management and market analysis, spanning AI-native software testing, product strategy, and analytics. On TestMu AI, he authored guides on test management and test case management. Previously, he served as the Product Lead at IndiaClan and co-founded Gartley618 Technologies, a firm focused on quantitative trading and blockchain. He holds a B.Tech degree.
Reviewer

Himanshu Sheth
Reviewer
Himanshu Sheth is the Director of Marketing (Technical Content) at TestMu AI, with over 8 years of hands-on experience in Selenium, Cypress, and other test automation frameworks. He has authored more than 130 technical blogs for TestMu AI, covering software testing, automation strategy, and CI/CD. At TestMu AI, he leads the technical content efforts across blogs, YouTube, and social media, while closely collaborating with contributors to enhance content quality and product feedback loops. He has done his graduation with a B.E. in Computer Engineering from Mumbai University. Before TestMu AI, Himanshu led engineering teams in embedded software domains at companies like Samsung Research, Motorola, and NXP Semiconductors. He is a core member of DZone and has been a speaker at several unconferences focused on technical writing and software quality.


SaaS Dashboard Testing FAQs
Did you find this page helpful?
More Related Blogs

TestMu AI forEnterprise
Get access to solutions built on Enterprise
grade security, privacy, & compliance
- Advanced access controls
- Advanced data retention rules
- Advanced Local Testing
- Premium Support options
- Early access to beta features
- Private Slack Channel
- Unlimited Manual Accessibility DevTools Tests