

Power Your Software Testing with AI Agents and Cloud
The Native AI-Agentic Cloud Platform to Supercharge Quality Engineering. Test Intelligently and Ship Faster.


- TestMu AI (Formerly LambdaTest)
- /
- Blog
- /
- 11 Best SaaS Testing Tools, Tested and Reviewed [October 2026]
11 Best SaaS Testing Tools, Tested and Reviewed [October 2026]
Compare the 11 best SaaS testing tools, tested and scored for functional, visual, API, load, security, and monitoring coverage, with real test results.
Last Updated on:
SaaS testing tools have to keep pace with releases that reach every customer at once, so the right stack depends on which layer breaks most often: the UI, the API, performance under load, or security. I scored 11 tools against the same criteria and ran a few of them hands-on, including a k6 load test where every request succeeded and the latency threshold still caught a slowdown.
Best SaaS Testing Tools Shortlist
- TestMu AI (Formerly LambdaTest) - best for running existing test suites across 3,000+ browser and OS combinations and 10,000+ real devices
- Ghost Inspector - best for recorded browser tests without code
- Playwright Visual Comparisons - best for free visual regression beside your test code
- Postman - best for API development and contract checks
- SoapUI - best for SOAP services alongside REST and GraphQL
- Apache JMeter - best for protocol-level load testing
- Grafana k6 - best for load tests kept as code
- ZAP by Checkmarx - best for automated vulnerability scanning
- New Relic - best for production observability
- Datadog Synthetic Monitoring - best for scheduled checks on live user flows
- Kiwi TCMS - best for self-hosted test management
Our Review Standards
I considered 18 tools and ranked the 11 here, scoring each on the same six criteria. Every vendor claim was checked on the vendor's own site in September 2026, and every hands-on result on this page comes from a run I did myself. TestMu AI is our own product and is held to the same rubric, limitations included, and nothing on this list is paid placement.
The tools I did not run hands-on are scored on their documentation alone. Our editorial process explains how reviews are researched and verified.
11 Best SaaS Testing Tools, Compared
| Tool | Quality layer | Runs in CI | Free tier | Pricing |
|---|---|---|---|---|
| TestMu AI (Formerly LambdaTest) | Functional, visual, load, real devices | Yes - 120+ CI/CD integrations | Yes - 100 lifetime automation minutes | By parallel tests |
| Ghost Inspector | Functional | Yes - official CI plugins | Free trial | Subscription by test runs |
| Playwright Visual Comparisons | Visual | Yes | Free and open source | Free and open source |
| Postman | API | Yes - Postman CLI and Newman | Yes - free plan for individuals | Free plan, then paid plans |
| SoapUI | API | Yes - command-line testrunner | Free and open source | Open source; ReadyAPI is paid |
| Apache JMeter | Performance | Yes - CLI mode | Free and open source | Free and open source |
| Grafana k6 | Performance | Yes - thresholds fail the build | Open source; free cloud tier | Usage-based cloud |
| ZAP by Checkmarx | Security | Yes - Docker scans, GitHub Actions | Free and open source | Free and open source |
| New Relic | Monitoring | Via synthetic monitors | Yes - perpetual free tier | Usage-based |
| Datadog Synthetic Monitoring | Monitoring | Yes - GitHub Actions, GitLab, Jenkins | Free trial | Billed per test run |
| Kiwi TCMS | Test management | Yes - automation plugins and API | Free to self-host | Paid support subscriptions |
What Are SaaS Testing Tools?
SaaS testing tools check that software people use over the internet keeps working for every customer at once, and that it stays fast and secure. Most tools cover one part of that job, such as the interface, the APIs, speed under load, security, or live monitoring, so teams usually use a few together.
They matter more for SaaS testing than for installed software because:
- Every release goes out to all your customers at once, so one bug reaches everyone.
- Customers share the same servers, so load and security tests need a separate environment that cannot disturb them.
- It relies on outside services like logins, payments, and webhooks, which change on their own schedule.
There is more of it to test every year. BetterCloud's 2026 State of SaaS report finds businesses now deploying an average of 27 AI-powered SaaS applications, each one a product someone has to test.
I Tested 11 SaaS Testing Tools
Every tool was scored 0 to 5 on the six things below, using its own documentation rather than its marketing page. The hands-on results are in test data and full scores below the list.
- Layer coverage - how completely it covers its quality layer, whether functional, visual, API, load, security, monitoring, or test management.
- How you run tests - live sessions, automated runs, scheduled checks, or a mix.
- Fits your stack - whether your existing tests, scripts, and pipelines work with it unchanged.
- Debugging - what every run captures on its own, such as logs, video, image diffs, or traces.
- Upkeep - how much work the tests need as the product changes.
- Time to first result - how long from install or signup to a result that tells you something.
1. TestMu AI (Formerly LambdaTest): Best for Running Existing Suites Across Browsers and Devices
My score: 28/30 on the six criteria. Full breakdown in the scores table below.
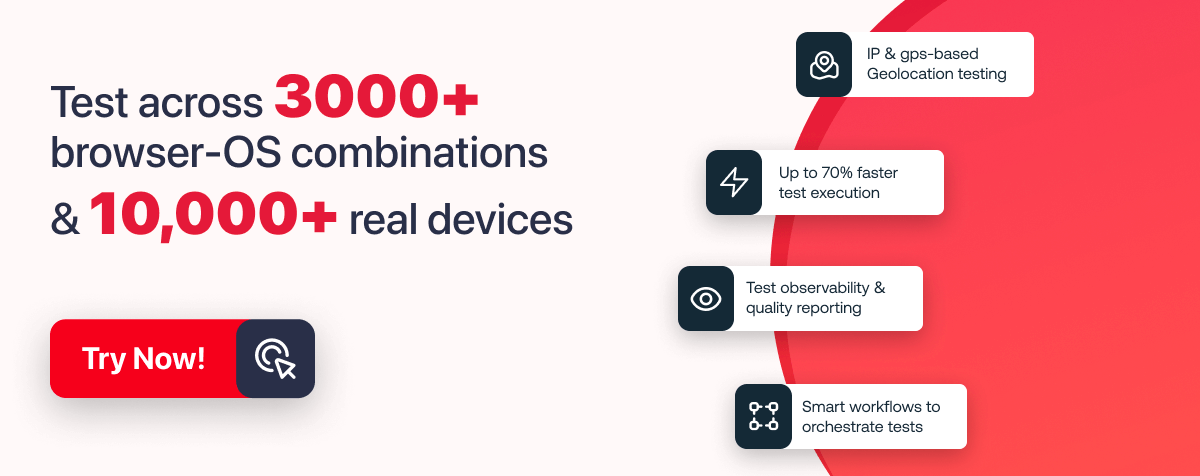
TestMu AI's test automation cloud runs existing Selenium, Cypress, Playwright, and Puppeteer suites across 3,000+ browser and OS combinations, with 10,000+ real Android and iOS devices for the mobile side of a SaaS product.
Every session records video, console logs, and network logs with no extra setup, so a failure on one browser comes with its evidence attached. For a staging tenant that is not publicly reachable, LT Tunnel routes cloud browsers to it over an encrypted connection.
Key features
- 3,000+ browser and OS combinations plus 10,000+ real Android and iOS devices on one grid.
- Runs existing Selenium, Cypress, Playwright, and Puppeteer suites with no rewrite.
- Video, console logs, network logs, and screenshots captured on every run.
- SmartWait and Auto Healing for timing and locator flakiness, plus agentic root cause analysis.
- HyperExecute orchestration for up to 70% faster runs, and KaneAI for writing tests in natural language.
Layer coverage
Functional, cross-browser, and real devices. Verified on Chrome, Edge, Firefox, and WebKit in the test data below. The same platform adds visual regression through SmartUI, JMeter and Gatling load runs through HyperExecute, and test management.
Gartner rating
4.6 out of 5 from 420 ratings on Gartner Peer Insights.
Integrations
Native integration with 120+ CI/CD and DevOps tools, so the same suite that runs locally runs in your pipeline.
Pros and cons
| Pros | Cons |
|---|---|
| Runs existing suites unchanged; evidence captured on every run; browsers and real devices on one grid; encrypted tunnel for private staging. | The product range is wide, so new teams take a little time to pick where to start. |
Pricing
Free plan with 100 lifetime minutes of web and mobile automation on 2 parallel sessions, then paid plans priced by parallel test count, plus enterprise terms. Last verified: September 2026.
Verdict: My pick for the functional layer when you already have a suite and need it running across browsers and devices tomorrow. Browser-by-browser depth is covered in the cross browser testing tools roundup.

Note: Run your existing Selenium, Cypress, and Playwright tests across 3,000+ browser and OS combinations with logs and video on every run. Try TestMu AI free
2. Ghost Inspector: Best for Recorded Browser Tests Without Code
My score: 21/30 on the six criteria. Full breakdown in the scores table below.
Ghost Inspector is a no-code browser testing platform. You record a signup or checkout flow from a browser extension and replay it on a schedule, which gives a team without automation engineers its first regression suite.
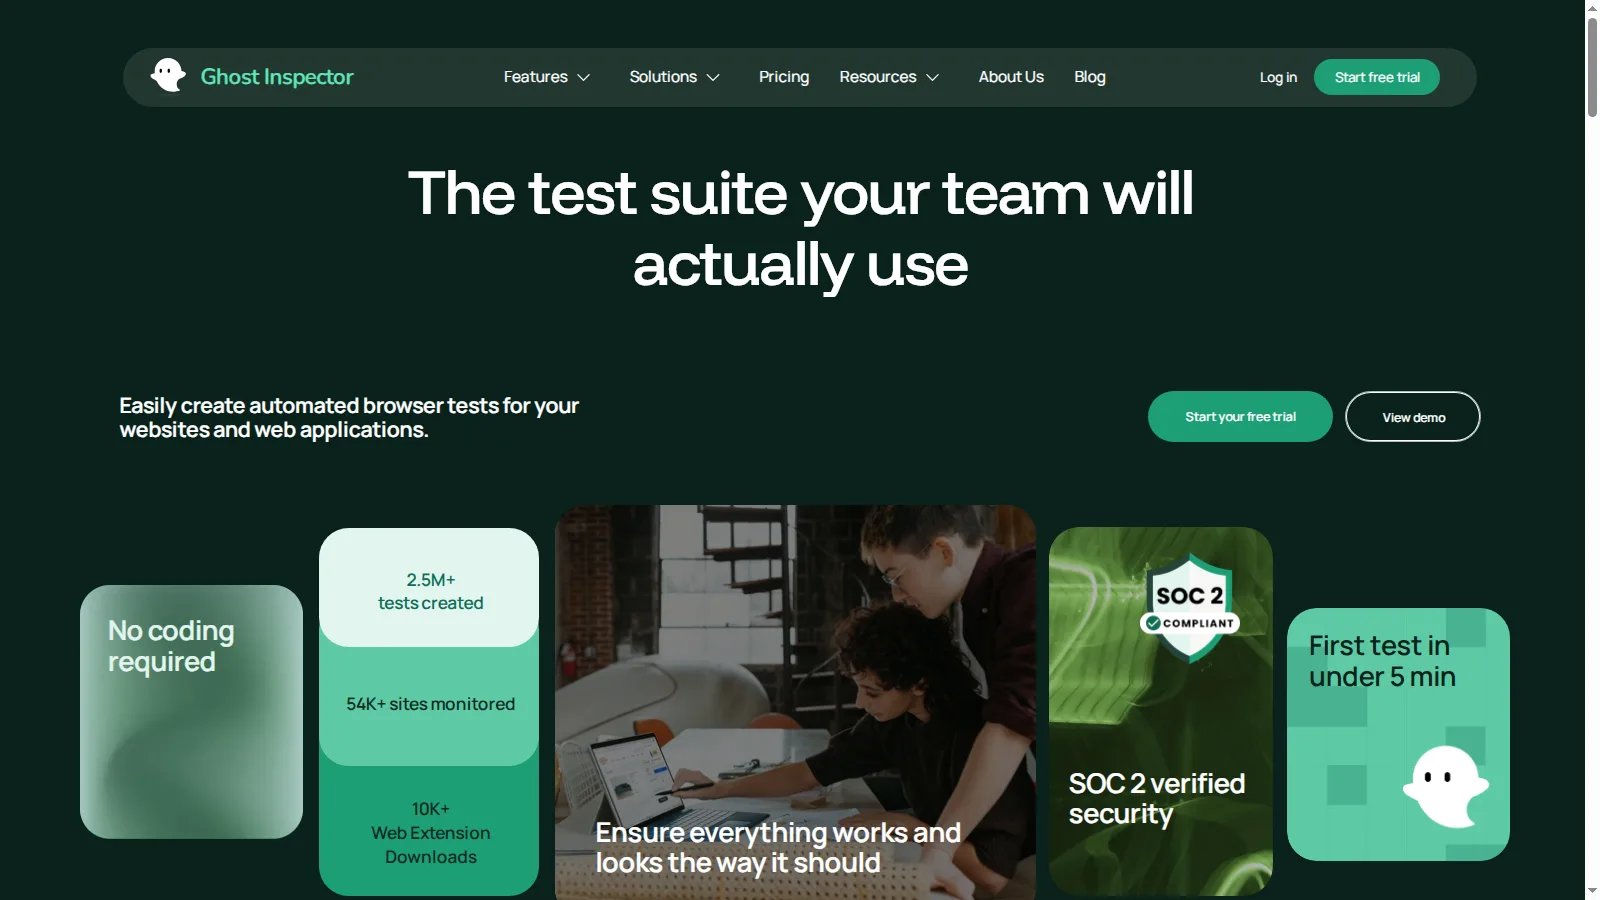
Engineers are not locked out. JavaScript execution, data-driven tests, and version control sit behind the codeless editor for flows that recording cannot handle.
Key features
- Web test recorder and codeless test editor.
- Visual testing and accessibility testing on recorded flows.
- Email testing and API steps for flows that cross into an inbox or service.
- Scheduling across browsers, screen sizes, and geolocations.
- SSO and SCIM provisioning for enterprise accounts.
Layer coverage
Functional, with visual and accessibility checks on the same recorded flows. No load or security testing.
Integrations
Integration tutorials cover AWS CodePipeline, Azure DevOps, Bamboo Server, Bitbucket Pipelines, Buildkite, CircleCI, Docker, GitHub Actions, GitLab, Jenkins, and TeamCity, with Jira Cloud in beta.
Pros and cons
| Pros | Cons |
|---|---|
| Fastest route from nothing to a scheduled regression suite; JavaScript available when recording is not enough; long CI integration list. | Browser flows only, so APIs under load and security need other tools; plans scale with test run volume, so heavy scheduling raises cost. |
Pricing
Subscription tiers sized by test runs, with a free trial and a discount for annual billing. Check the vendor's site for current figures. Last verified: September 2026.
Verdict: The quickest start for teams without automation engineers who need scheduled checks on signup and checkout flows.
3. Playwright Visual Comparisons: Best for Free Visual Regression Beside Your Test Code
My score: 24/30 on the six criteria. Full breakdown in the scores table below.
A functional suite can pass while a CSS change breaks a pricing card, so the visual layer needs its own check. Playwright's toHaveScreenshot() assertion stores an approved image beside the test and fails the run when the page drifts.
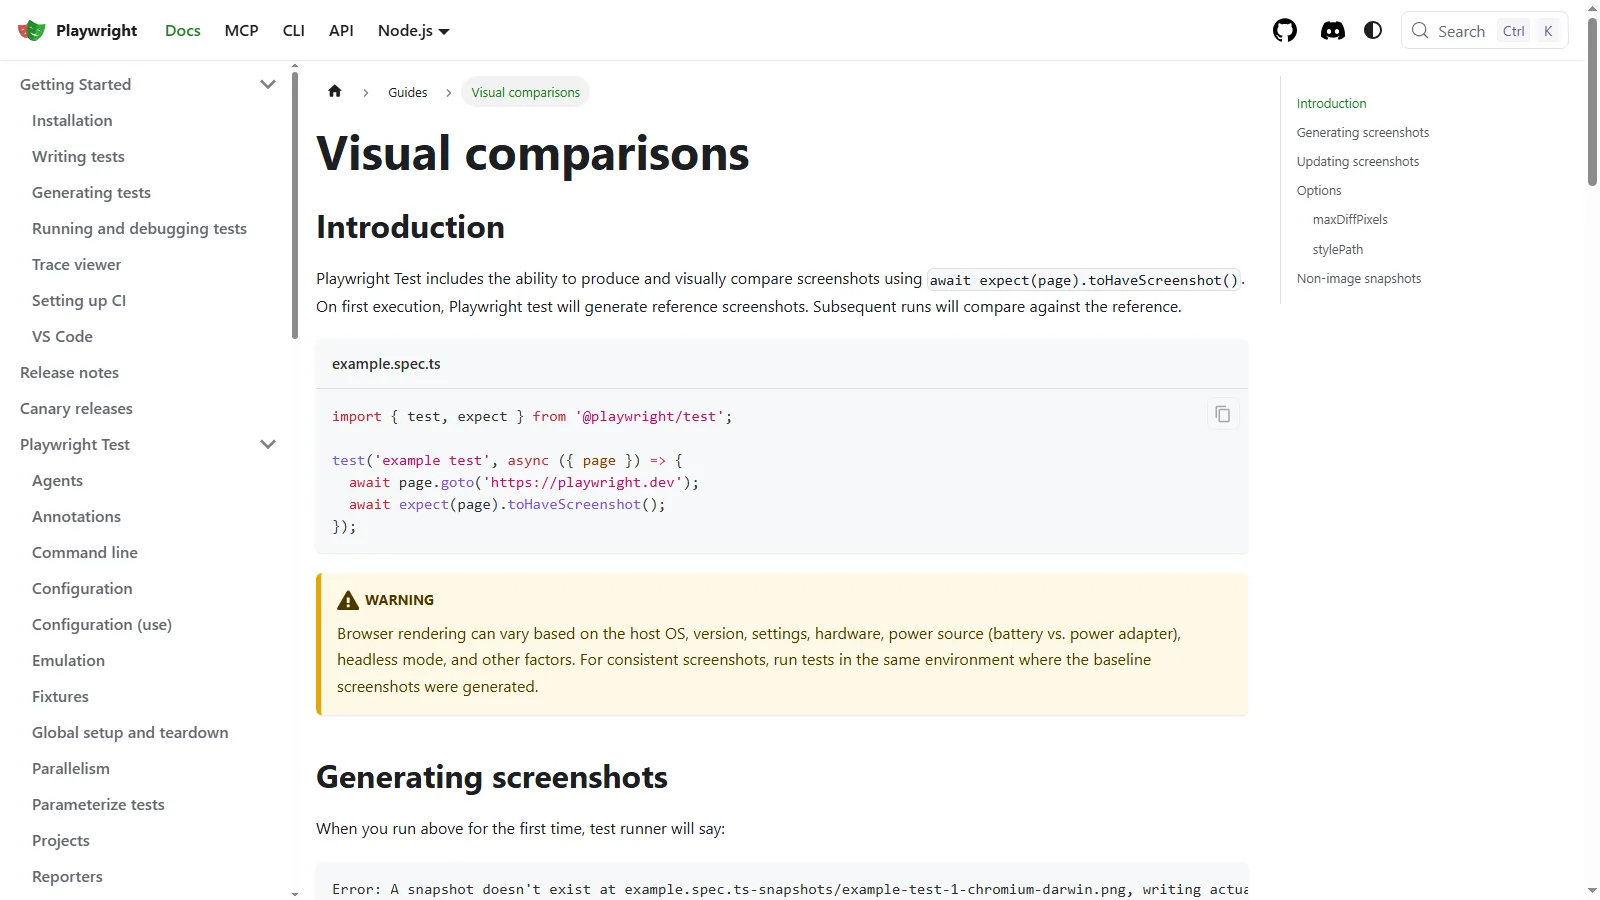
I seeded a 4px padding change on a billing card, and the comparison failed while the unchanged page passed twice. The diff images are in the test data below.
The limit is the environment. Playwright's own docs warn that rendering varies by OS, browser version, and hardware, so a baseline only holds where it was generated. TestMu AI's SmartUI visual testing targets that problem with anti-aliasing adjustment and Smart Ignore for dynamic regions, which its documentation credits with reducing false positives by up to 95%.
Key features
- toHaveScreenshot() for full pages or single elements.
- maxDiffPixels and threshold options to tolerate small rendering differences.
- stylePath to hide dynamic regions such as timestamps before comparing.
- Expected, actual, and diff images written on every failure.
- Baselines committed to version control and reviewed in the same pull request.
Layer coverage
Visual regression in Chromium, Firefox, and WebKit builds, with a separate baseline per browser and platform.
Integrations
Documented CI setups for GitHub Actions, Azure Pipelines, CircleCI, Jenkins, GitLab CI, Bitbucket Pipelines, and Google Cloud Build.
Pros and cons
| Pros | Cons |
|---|---|
| No licence cost; diffs reviewed with the code change; evidence images on every failure. | No hosted review dashboard or approval workflow; baselines break when the OS or browser version changes. |
Pricing
Open source and free. Costs come from the CI machines you run it on. Last verified: September 2026.

Verdict: The right first visual check for a SaaS team already on Playwright. Move to a managed engine once cross-browser rendering noise starts failing honest runs.
4. Postman: Best for API Development and Contract Checks
My score: 25/30 on the six criteria. Full breakdown in the scores table below.
Postman covers the API layer your UI tests never see, and most SaaS products are API-driven underneath.

I ran a two-request collection through Newman, Postman's open-source command-line runner, and all 7 assertions passed. After I renamed one expected field to mimic a contract change, 1 of 7 failed and Newman exited with code 1, which is what blocks a pipeline.
Key features
- API client with saved collections, specs, and mock servers.
- Collection Runner and performance testing runs.
- Scheduled runs and monitors for APIs in production.
- Postman CLI and Newman for running collections in CI/CD.
- JavaScript pre-request and test scripts for chaining calls and assertions.
Layer coverage
API functional and contract testing, with basic performance runs. No browser testing or security scanning.
Gartner rating
4.5 out of 5 from 793 ratings in API Management on Gartner Peer Insights.
Integrations
Collections run in any CI through the Postman CLI or Newman, with documented guides for scheduled runs, monitors, and CI/CD pipelines, plus Native Git.
Pros and cons
| Pros | Cons |
|---|---|
| Low barrier to a first API test; scripted assertions; free plan for individuals; clear exit codes in CI. | Team-scale collection runs and collaboration sit on paid plans; large Flows are hard to review in pull requests. |
Pricing
Free plan for individuals, then Solo, Team, and Enterprise plans, with Team billed per user. Check the vendor's site for current figures. Last verified: September 2026.
Verdict: The default API client for most teams. Move contract checks into code once collections need review in pull requests; more options are in the API testing tools roundup.
5. SoapUI: Best for SOAP Services Alongside REST and GraphQL
My score: 17/30 on the six criteria. Full breakdown in the scores table below.
SoapUI is the open-source edition of a long-standing API testing tool, covering REST, SOAP, and GraphQL. It earns a place when a SaaS product still talks to SOAP services, often in banking or ERP integrations.
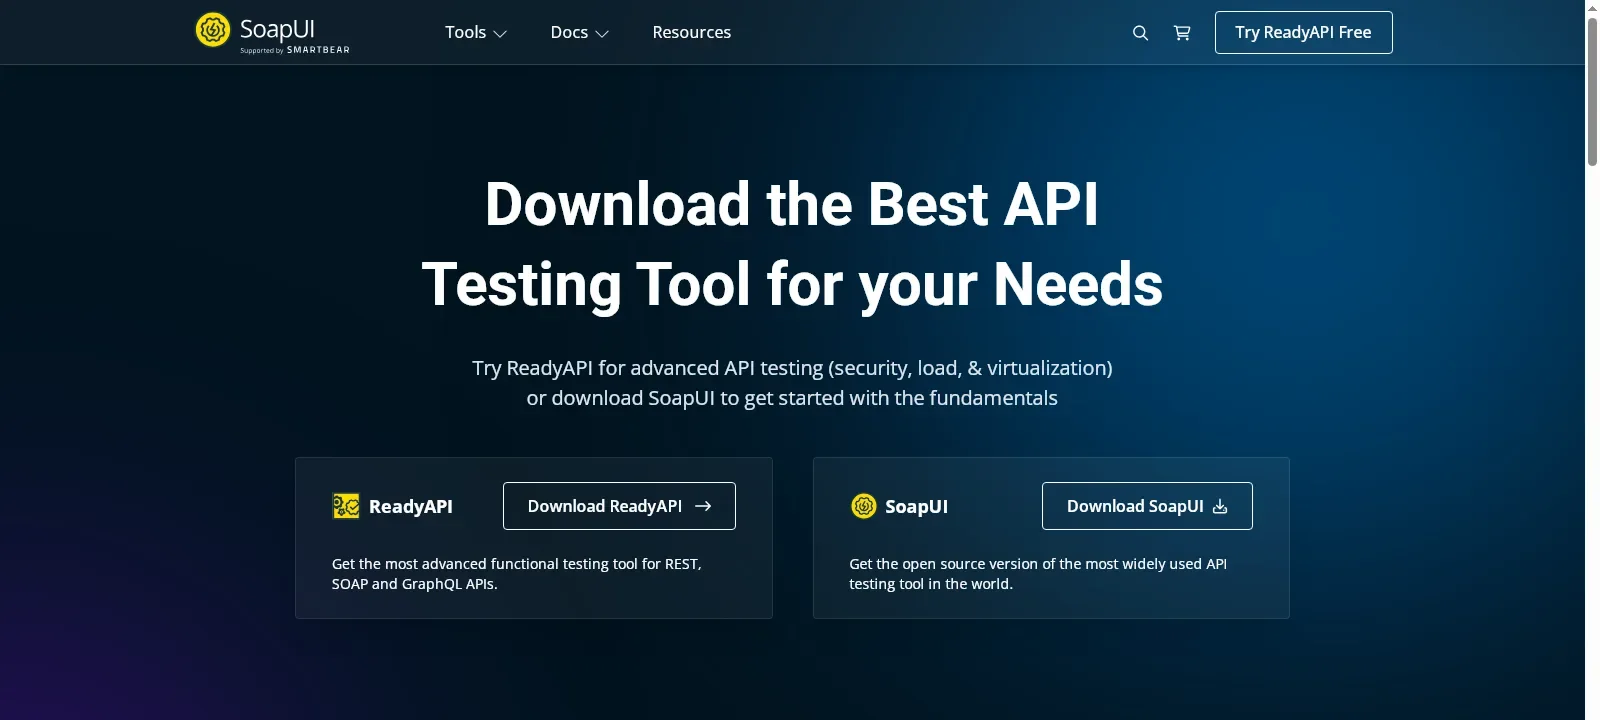
The commercial ReadyAPI adds advanced security, load, and virtualization, so the open-source edition is best kept for functional checks.
Key features
- Functional tests for REST, SOAP, and GraphQL APIs in one project.
- testrunner command-line execution for functional, load, and security tests.
- Docker execution for running suites in containers.
- JUnit integration and a Maven plugin for build pipelines.
Layer coverage
API functional testing across REST, SOAP, and GraphQL, with basic load and security tests from the same project.
Integrations
Command-line testrunner scripts, Docker, JUnit reports, and a Maven plugin, which between them cover most CI servers.
Pros and cons
| Pros | Cons |
|---|---|
| One tool for SOAP and REST; free and open source; runs headless from the command line. | Advanced security, load, and virtualization sit in paid ReadyAPI; REST-only teams usually pick a lighter client. |
Pricing
Free and open source. ReadyAPI is the commercial edition. Last verified: September 2026.
Verdict: A solid fit where SOAP services or an approved-tools list are in play.

6. Apache JMeter: Best for Protocol-Level Load Testing
My score: 20/30 on the six criteria. Full breakdown in the scores table below.
Apache JMeter is an open-source Java application for load testing functional behavior and measuring performance. It reaches well past HTTP, covering SOAP and REST, FTP, JDBC, LDAP, JMS, mail, and TCP. Releases are infrequent, with 5.6.3 current since January 2024, though the project still commits fixes between them.
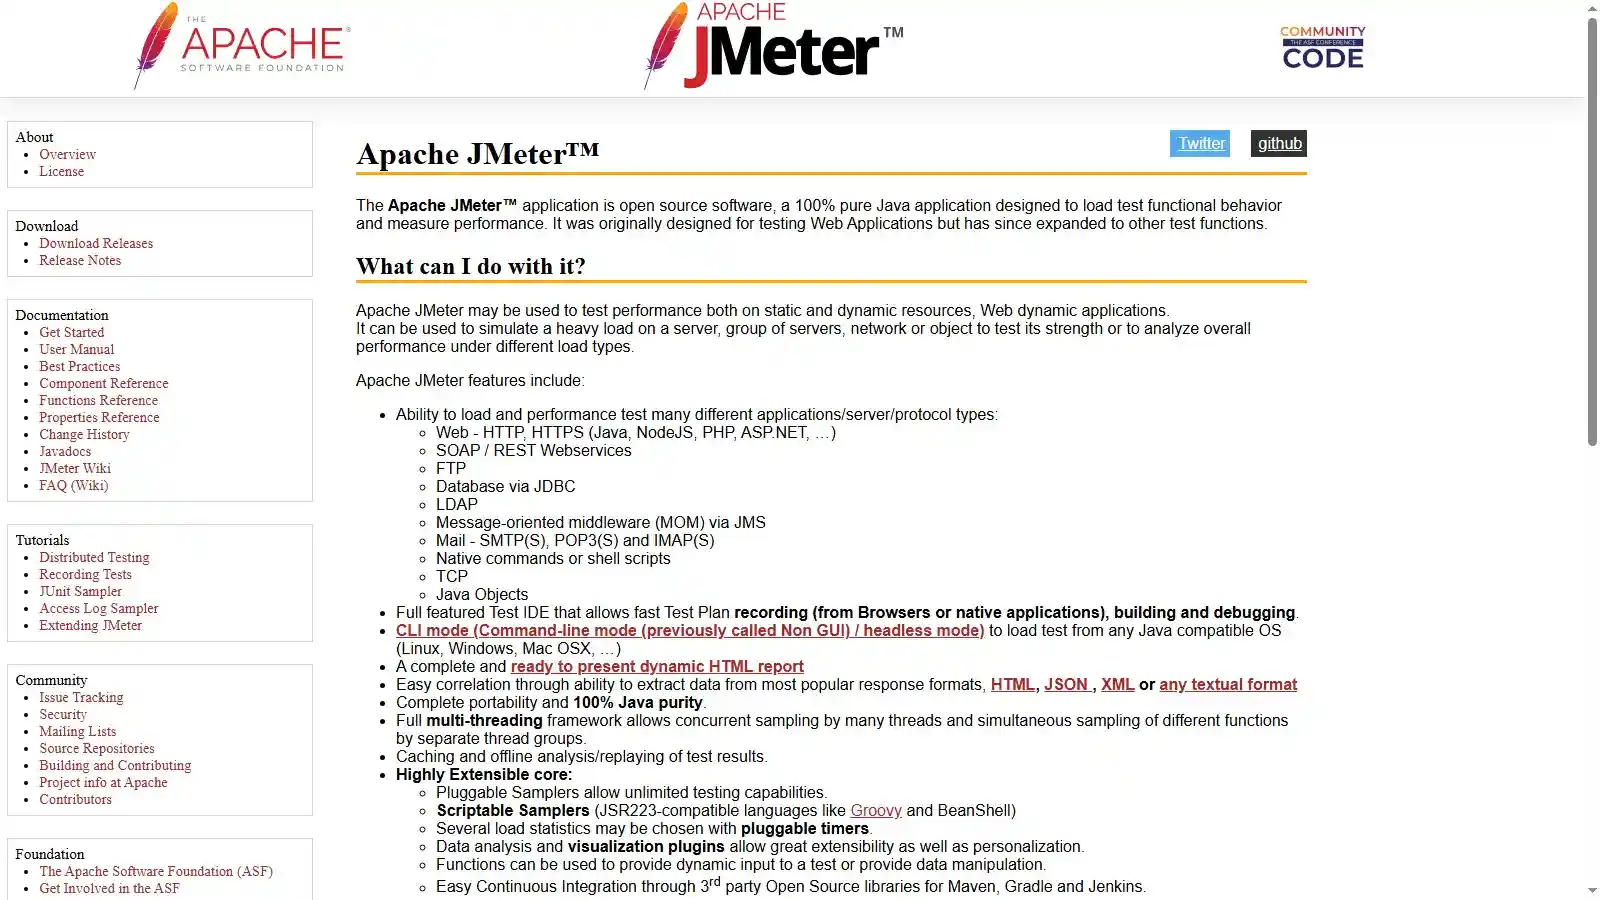
Existing .jmx plans do not need a rewrite to scale out. TestMu AI's HyperExecute runs JMeter and Gatling plans natively and provisions the load generators for you.
Key features
- Test IDE for recording, building, and debugging test plans.
- CLI mode for headless load tests on any Java-compatible OS.
- A ready-to-present dynamic HTML report.
- Correlation that extracts data from HTML, JSON, and XML responses.
- Pluggable samplers for extending it to new protocols.
Layer coverage
Performance across many protocols. It measures servers and APIs, not browser rendering.
Integrations
Continuous integration through third-party open-source libraries for Maven, Gradle, and Jenkins, plus CLI runs in any pipeline.
Pros and cons
| Pros | Cons |
|---|---|
| Widest protocol coverage in this list; free and extensible; mature HTML reporting. | The interface feels dated to some testers; test plans take longer to write and review as a team than code-first scripts. |
Pricing
Free and open source under the Apache License. Costs come from the load generator machines. Last verified: September 2026.
Verdict: Pick it for mixed-protocol load or existing .jmx plans. New HTTP-only suites are faster to write in k6.
7. Grafana k6: Best for Load Tests Kept as Code
My score: 26/30 on the six criteria. Full breakdown in the scores table below.
Grafana k6 writes load tests in JavaScript and runs them locally, in CI, or from Grafana Cloud k6's 21 load zones.
This was the most useful run in my test. With a 250 ms delay added to the endpoint, every status check still passed and the p95 threshold flagged the slowdown, exiting with code 99, which is exactly what a latency gate is for.
Key features
- Load tests written in JavaScript and kept in version control.
- Thresholds that fail the run with a non-zero exit code.
- Checks for per-request assertions.
- Results written to CSV or JSON, or streamed to observability tools.
- A built-in web dashboard for watching a run live.
Layer coverage
Performance for HTTP and API endpoints, verified with the two runs in the test data below.
Integrations
Real-time outputs to Amazon CloudWatch, Apache Kafka, Datadog, Dynatrace, Elasticsearch, Grafana Cloud, InfluxDB, Netdata, New Relic, OpenTelemetry, Prometheus remote write, StatsD, and TimescaleDB.
Pros and cons
| Pros | Cons |
|---|---|
| Tests live beside the code; thresholds gate CI directly; single binary, first result in minutes. | Requires coding, so non-developers need another tool; longer retention and cloud execution sit on paid Grafana Cloud tiers. |
Pricing
Open source under AGPL-3.0. Grafana Cloud k6 has an always-free tier with limited usage, then usage-based paid tiers. Last verified: September 2026.
Verdict: The best default for new API load tests if your team writes JavaScript.
8. ZAP by Checkmarx: Best for Automated Vulnerability Scanning
My score: 21/30 on the six criteria. Full breakdown in the scores table below.
The scanner many teams still call OWASP ZAP is now published as ZAP by Checkmarx. It remains free, open source, and an independent project.
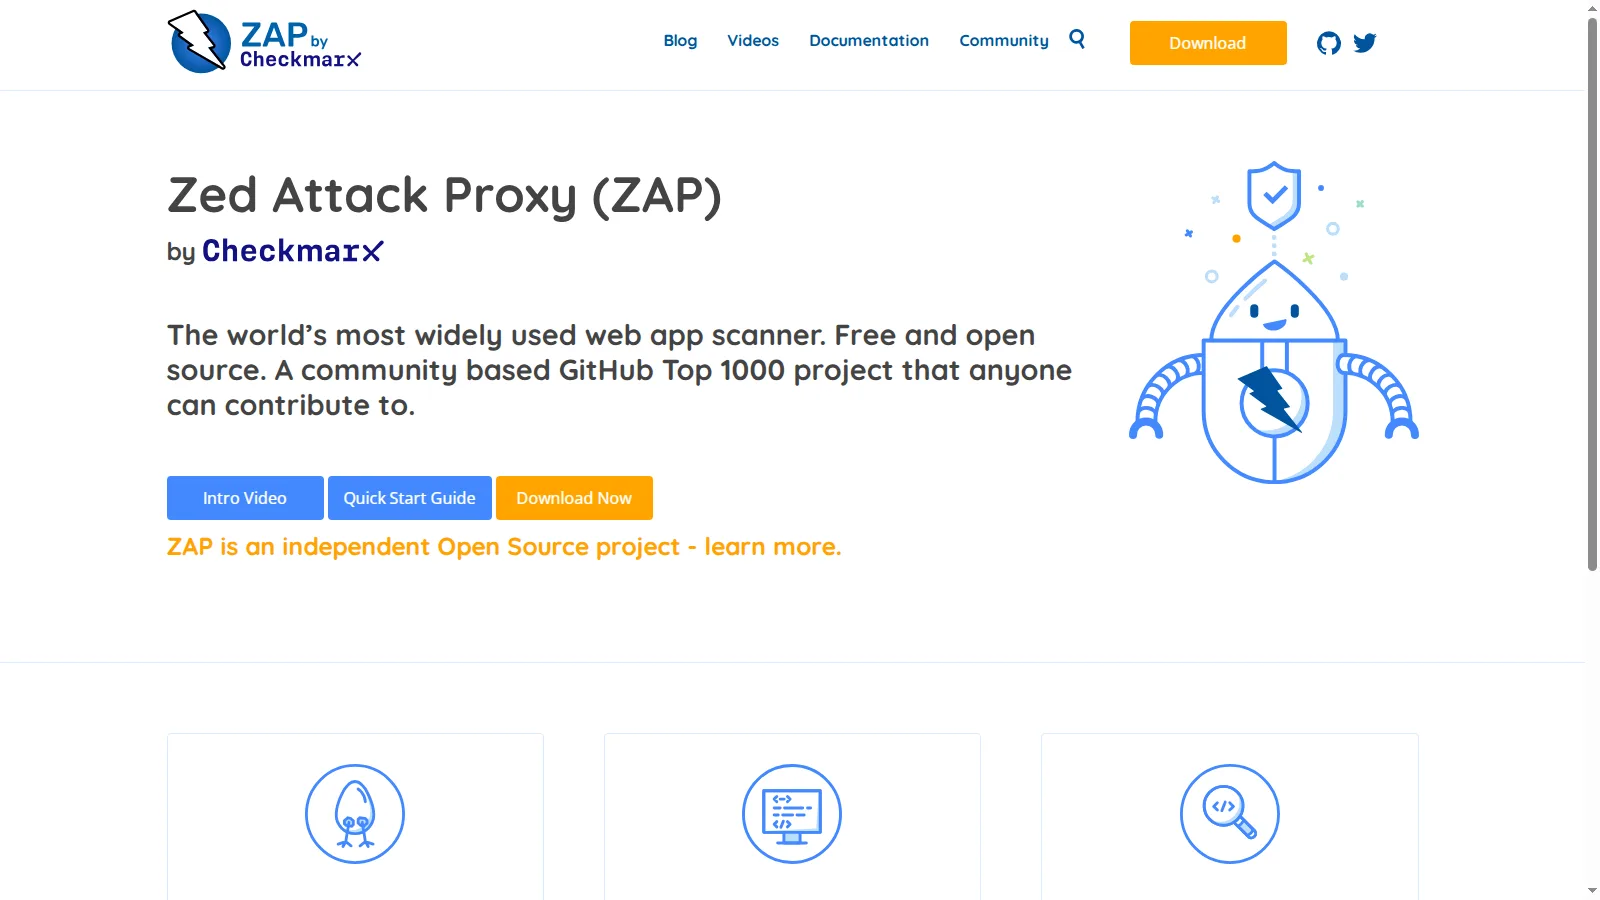
For a SaaS team, automation is the useful part. Packaged Docker scans and GitHub Actions put a baseline scan in the same pipeline as your tests.
Key features
- ZAPit for a quick reconnaissance scan of a URL.
- Packaged Docker scans for pipeline automation.
- GitHub Actions on the GitHub Marketplace.
- An Automation Framework for non-trivial scan plans.
- A full API in daemon mode.
Layer coverage
Web application security scanning. It does not test functionality or performance.
Integrations
Docker packaged scans, GitHub Actions, the Automation Framework, and the daemon-mode API cover pipelines from a single scan to full control.
Pros and cons
| Pros | Cons |
|---|---|
| Free and open source under Apache-2.0; automation paths from one command to full API control; independent project. | A scanner covers common vulnerability classes, so tenant-isolation rules still need your own test cases; active scans need an environment you can safely attack. |
Pricing
Free and open source under Apache-2.0. Last verified: September 2026.
Verdict: The free default for security scans in the pipeline. Keep explicit cross-tenant test cases alongside it.
9. New Relic: Best for Production Observability
My score: 23/30 on the six criteria. Full breakdown in the scores table below.
New Relic watches how the application behaves after release, the layer of SaaS testing that never stops. Distributed tracing follows a request across microservices to find the hop that slowed down.
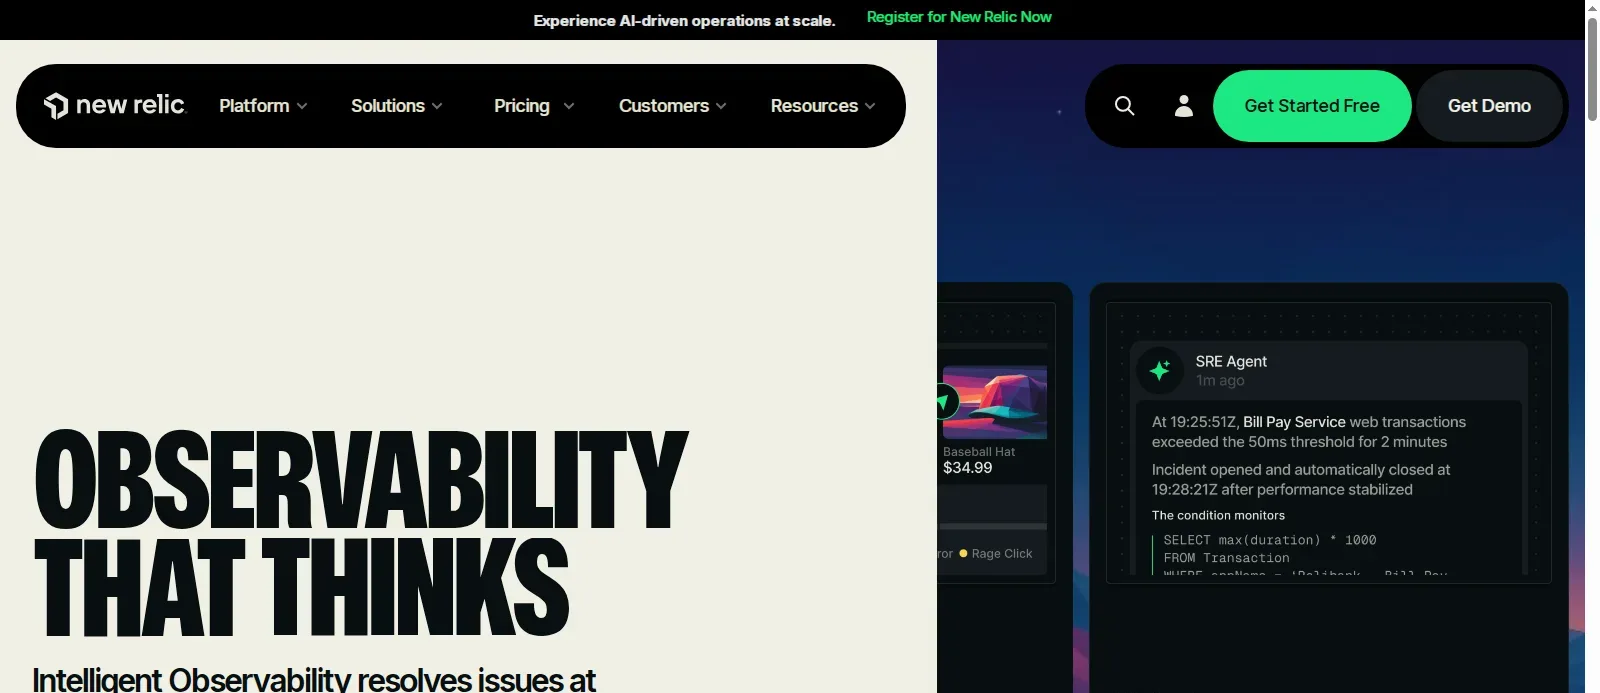
Its synthetic monitoring adds codeless step monitors for user journeys. The docs recommend running each monitor from at least three locations to avoid false positives.
Key features
- Codeless step monitors and scripted monitors for synthetic checks.
- Private locations for monitoring apps inside your network.
- Distributed tracing across microservices.
- 50+ observability capabilities on one platform.
Layer coverage
Production monitoring across application, infrastructure, and synthetic signals. It watches releases after they ship.
Gartner rating
4.6 out of 5 from 1,492 ratings in Observability Platforms on Gartner Peer Insights.
Integrations
An integrations ecosystem covers the application, infrastructure, and cloud layers, and synthetic monitors can run from private locations.
Pros and cons
| Pros | Cons |
|---|---|
| Generous perpetual free tier; traces and synthetics on one platform; unlimited free basic users. | Watches production instead of gating a release; the Standard edition limits full platform users to five. |
Pricing
A perpetual free tier with 100 GB of data ingest per month and one free full platform user, then usage-based editions, per New Relic pricing. Last verified: September 2026.
Verdict: A strong choice when you want observability and synthetic checks on one bill, starting free.
10. Datadog Synthetic Monitoring: Best for Scheduled Checks on Live User Flows
My score: 23/30 on the six criteria. Full breakdown in the scores table below.
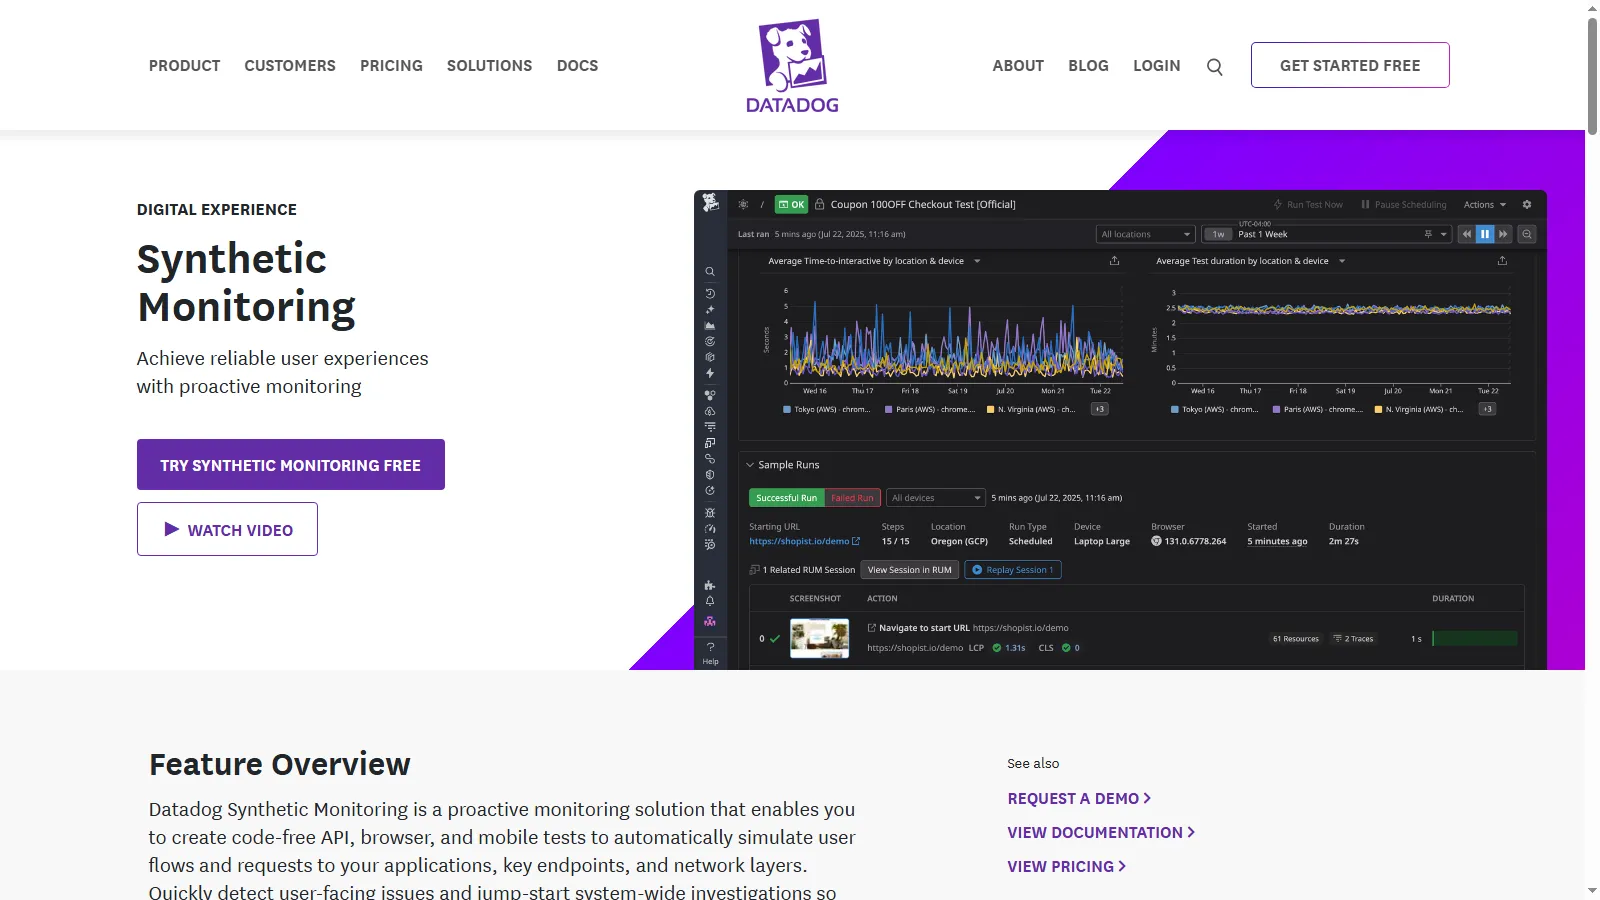
Datadog Synthetic Monitoring runs API, browser, and mobile app tests on a schedule from managed or private locations. A broken signup flow or slow endpoint gets caught between deploys, before a customer reports it.
Key features
- API tests across HTTP, gRPC, SSL, DNS, WebSocket, TCP, UDP, and ICMP.
- Browser tests and mobile app tests for end-to-end user flows.
- Private locations for apps that are not publicly reachable.
- Continuous Testing that runs synthetic tests inside CI.
- Documented setups for testing through a proxy, firewall, or VPN.
Layer coverage
Synthetic monitoring for APIs, browsers, and mobile apps, in production and in CI.
Gartner rating
4.6 out of 5 from 1,053 ratings for Datadog in Observability Platforms on Gartner Peer Insights.
Integrations
Continuous Testing plugs into Azure DevOps, CircleCI, GitHub Actions, GitLab, Jenkins, and Bitrise.
Pros and cons
| Pros | Cons |
|---|---|
| Broadest API protocol list here; browser and mobile app tests on one platform; CI plugins for the major providers. | Billed per test run, so frequent schedules add up. |
Pricing
Billed per test run for API, browser, and mobile app tests, with a free trial. Check the vendor's site for current figures. Last verified: September 2026.
Verdict: Worth it when production checks tied to your existing Datadog telemetry matter more than per-run cost.
11. Kiwi TCMS: Best for Self-Hosted Test Management
My score: 14/30 on the six criteria. Full breakdown in the scores table below.
Once a SaaS team runs four or five tools, the question becomes what was tested last release. Kiwi TCMS holds manual and automated results together and runs on your own infrastructure under GPL-2.0.
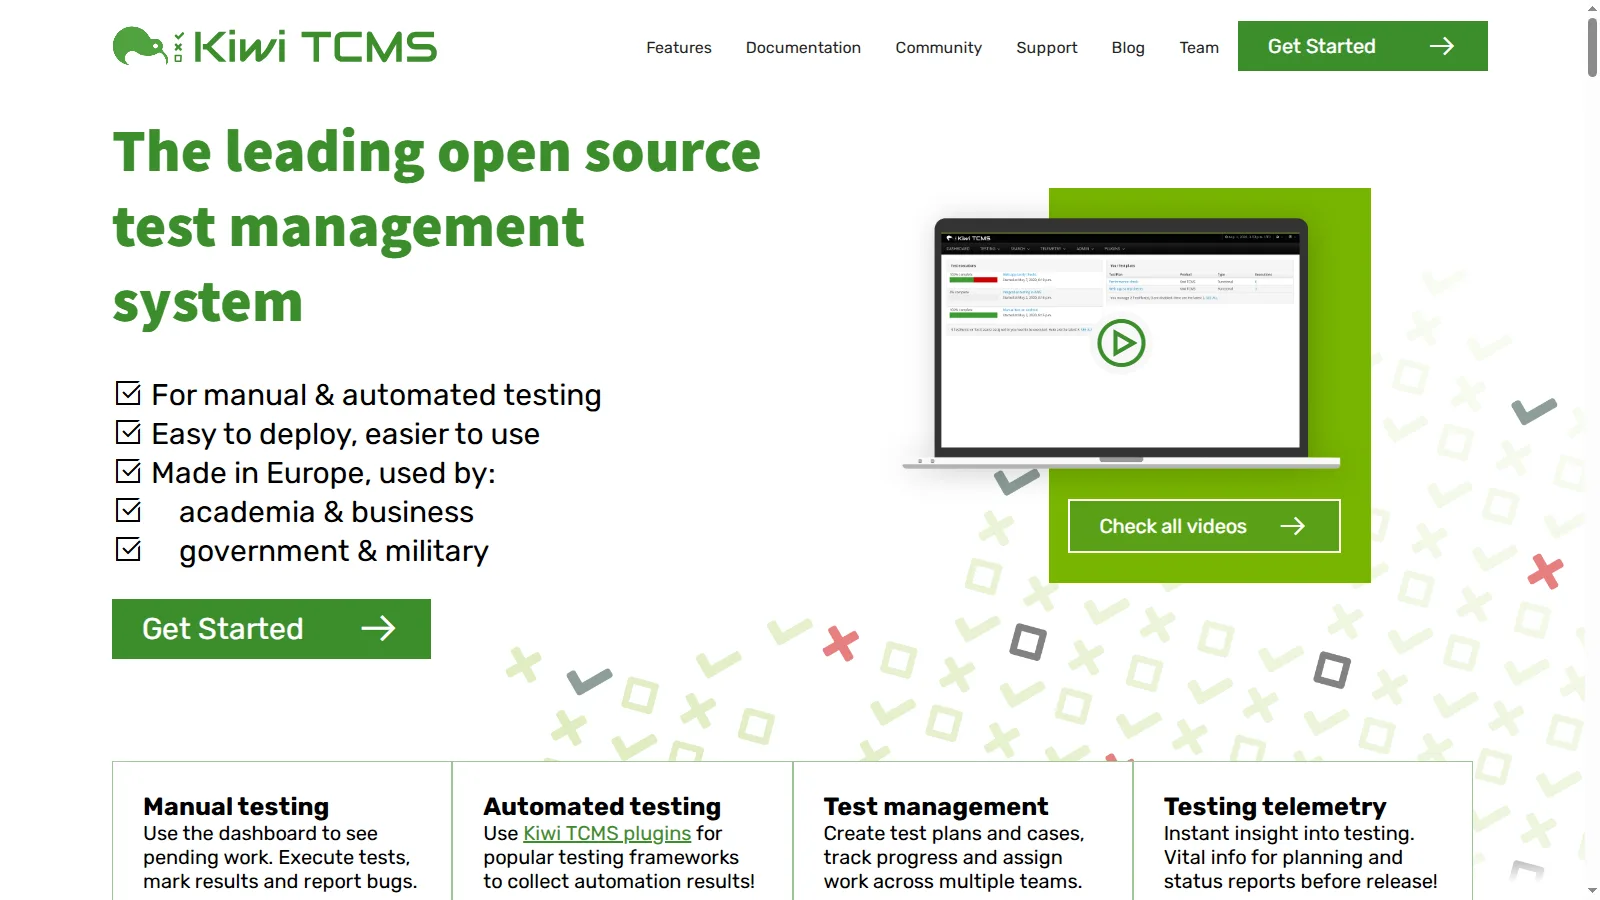
Self-hosting means someone owns upgrades, backups, and access control. Teams that would rather not can use TestMu AI's test management platform, which generates test cases from natural language and traces each requirement to its tests, runs, and defects.
Key features
- Test plans, test cases, and execution tracking for manual and automated testing.
- Automation plugins for JUnit 5, junit.xml, PHPUnit, pytest, Robot Framework, TAP, and TestNG.
- One-click bug reports and automatic bug updates in connected trackers.
- An API and a plugin system for custom integrations.
- Deployment as a Docker container on x86_64 or aarch64.
Layer coverage
Test management and reporting. It records results from other tools and does not run tests itself.
Integrations
Bug tracker integrations include Azure Boards, Bitbucket Issues, Bugzilla, GitHub Issues, GitLab Issues, Jira, Mantis BT, OpenProject, Redmine, and Trac.
Pros and cons
| Pros | Cons |
|---|---|
| Free to self-host; the longest bug tracker list here; plugins for common test frameworks. | You own upgrades, backups, and access control; paid support is a separate subscription. |
Pricing
Free to self-host under GPL-2.0, with paid support subscriptions for teams that do not want to run it themselves. Last verified: September 2026.
Verdict: The best free option when test data has to stay on your own infrastructure.
Test Data and Full Scores
I ran a few of the tools hands-on on 17 September 2026, each against a real check or a seeded failure:
| Layer | Tool | What I ran | Result |
|---|---|---|---|
| Functional | TestMu AI | Wrong-password login on Chrome 153, Edge 153, Firefox 155, and WebKit 26.4 | Passed on all four: each browser showed the expected error |
| API | Postman (Newman) | 7 assertions, then a renamed field | 7 of 7 passed, then 1 of 7 failed, exit code 1 |
| Visual | Playwright | Baseline, unchanged page, then 4px padding | Passed twice, then 3,140 pixels differed, exit code 1 |
| Load | Grafana k6 | 20 virtual users at 20 ms, then at 250 ms | p95 37.31 ms passed, then 270.33 ms failed, exit code 99 |
Every seeded failure returned a non-zero exit code, which is what lets a CI job block the deploy. The key lines from each run:
# Functional: wrong-password login correctly rejected (pass) on the TestMu AI grid
Chrome 153    session_1789641909955_fy6sv3           Warning: No match for E-Mail Address and/or Password.
Edge 153      session_1789641928616_gsk9p0           Warning: No match for E-Mail Address and/or Password.
Firefox 155   8b2bb2ea-2283-42ad-b9f0-cb41ffd59229   Warning: No match for E-Mail Address and/or Password.
WebKit 26.4   session_1789642006276_tot61t           Warning: No match for E-Mail Address and/or Password.

# API: Newman 6.2.2, one expected field renamed
assertions   executed 7   failed 1                                   exit code 1

# Visual: Playwright 1.63.0, 4px of padding added to a button
3140 pixels (ratio 0.04 of all image pixels) are different            exit code 1

# Load: Grafana k6 2.2.0, endpoint slowed from 20 ms to 250 ms
p(95)=270.33ms   threshold p(95)<200 crossed   checks 1540 out of 1540   exit code 99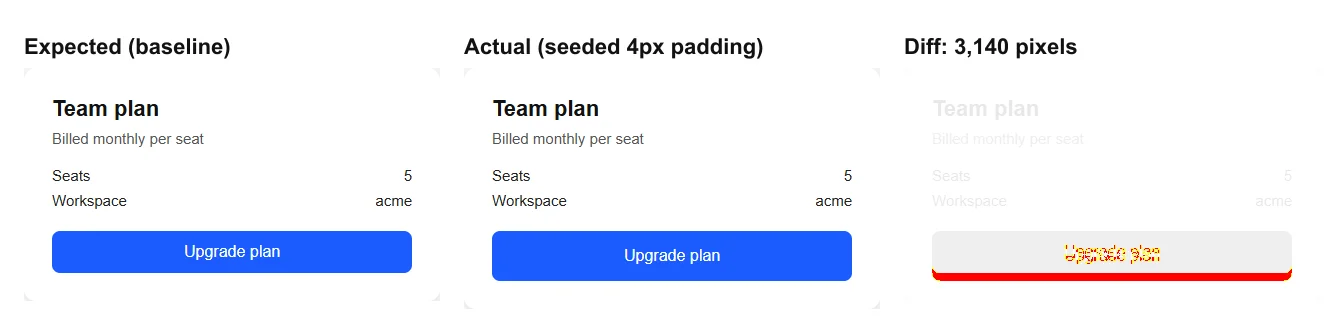
The scores
Sorted by total out of 30. The numbered sections above group tools by layer, so this table is the like-for-like ranking.
| Tool | Coverage | Execution | Stack fit | Debugging | Upkeep | Setup | Total |
|---|---|---|---|---|---|---|---|
| TestMu AI (Formerly LambdaTest) | 5 | 5 | 5 | 5 | 4 | 4 | 28 |
| Grafana k6 | 4 | 4 | 5 | 4 | 4 | 5 | 26 |
| Postman | 4 | 5 | 4 | 4 | 3 | 5 | 25 |
| Playwright Visual Comparisons | 3 | 3 | 5 | 5 | 3 | 5 | 24 |
| Datadog Synthetic Monitoring | 5 | 4 | 4 | 4 | 3 | 3 | 23 |
| New Relic | 4 | 3 | 4 | 5 | 4 | 3 | 23 |
| ZAP by Checkmarx | 4 | 4 | 4 | 3 | 3 | 3 | 21 |
| Ghost Inspector | 3 | 4 | 2 | 3 | 4 | 5 | 21 |
| Apache JMeter | 5 | 4 | 4 | 3 | 2 | 2 | 20 |
| SoapUI | 4 | 3 | 3 | 2 | 2 | 3 | 17 |
| Kiwi TCMS | 3 | 1 | 4 | 1 | 3 | 2 | 14 |
Kiwi TCMS scores lowest because it records results instead of running tests, so two of the criteria barely apply to it.
Free and Open Source SaaS Testing Tools
Free tools are free at different layers, and the layer decides how far you get before you pay.
| Tool | What free covers | Where you start paying |
|---|---|---|
| Playwright | Visual comparisons and the full test runner | CI machines and a hosted review workflow |
| Apache JMeter | The full load engine, CLI mode, and HTML reports | Load generator machines for large tests |
| Grafana k6 | The open-source engine for local and CI runs | Grafana Cloud k6 beyond the free tier's limited usage |
| ZAP by Checkmarx | Scanning, Docker scans, GitHub Actions, and the API | Never for the software; you supply the environment |
| SoapUI | Functional REST, SOAP, and GraphQL testing | ReadyAPI for advanced security, load, and virtualization |
| Kiwi TCMS | The complete self-hosted system | Paid support subscriptions |
| Postman and New Relic | Individual use, and New Relic's 100 GB monthly ingest | Team collaboration, more users, and more data |
| TestMu AI (Formerly LambdaTest) | 100 lifetime automation minutes on 2 parallel sessions | Sustained CI usage, priced by parallel tests |
The catch is that an open-source licence buys the engine, not the environment. k6 and JMeter cost nothing, but a realistic load test needs generator machines, and ZAP's active scans need an environment you can safely attack.
A workable free-first stack is Playwright for functional and visual checks, Newman and k6 in CI for contracts and latency, and ZAP's packaged scan in the same pipeline.
How SaaS Testing Tools Are Priced
Paid tools charge in five different ways, and the model matters more than the entry price once a suite runs on every merge.
| Pricing model | How it is charged | Tools in this list |
|---|---|---|
| Open source | Free software; you pay for the machines it runs on | Playwright, Apache JMeter, Grafana k6, ZAP by Checkmarx, SoapUI, Kiwi TCMS |
| Per user | A seat fee for each team member | Postman Team plan |
| Per parallel test | Priced by how many tests can run at the same time | TestMu AI |
| Usage-based | Charged by consumption, such as data ingested or cloud test usage | New Relic, Grafana Cloud k6 |
| Per test run | Each executed test counts toward the plan or bill | Datadog Synthetic Monitoring, Ghost Inspector |
Per-run and usage-based pricing grow with schedule frequency, so estimate how often each check runs before comparing plans.
Seven Other SaaS Testing Tools I Considered
These cleared a first look but not the six criteria, usually because they duplicate a pick above or failed a maintenance check. Each claim comes from the vendor's own live page, checked while writing.
- BackstopJS - visual regression testing for CSS changes. Cut because the code has not shipped a release since September 2024 and Playwright now covers the same job with its built-in comparisons.
- Lost Pixel - an open-source visual regression platform for Storybook, Next.js, and Playwright. Cut because the team announced it is joining Figma and sunsetting the product.
- Gatling - load testing with an open-source Community Edition and an Enterprise edition. A close alternative to JMeter, and HyperExecute runs Gatling plans natively too.
- Locust - open-source load testing where user behavior is plain Python code, distributed across machines. The better pick than k6 for Python-first teams.
- Bruno - an open-source, Git-native API client that stores collections as code. Worth a look if Postman's collection format or pricing is the problem.
- Checkly - monitoring as code, with checks in TypeScript and Playwright suites run as production monitors. It overlaps Datadog Synthetic Monitoring for teams that want monitors in the repository.
- Burp Suite Community Edition - PortSwigger's free manual toolkit for web security testing. The automated Burp Scanner sits in paid editions, which is why ZAP made the list instead.
Note: Check the mobile side of your SaaS product on 10,000+ real Android and iOS devices, with logs and video on every session. Explore the real device cloud
How Do You Choose Between These Tools?
Match the tool to your situation first. The table maps common SaaS team situations to where to start.
| Your situation | Start with | Why |
|---|---|---|
| You want browsers, real devices, and several test types on one platform | TestMu AI | Runs existing Selenium, Cypress, and Playwright suites unchanged across 3,000+ browser and OS combinations, and adds real devices, visual testing, and load runs |
| Nobody on the team writes automation code | Ghost Inspector | Records flows from a browser extension and replays them on a schedule |
| CSS regressions keep reaching production | Playwright visual comparisons | Free screenshot diffs reviewed with the code change |
| API contracts break between services | Postman | Assertions in CI fail the build when a field changes |
| Your integrations still use SOAP | SoapUI | REST, SOAP, and GraphQL in one open-source tool |
| You need mixed-protocol load or already have .jmx plans | Apache JMeter | Widest protocol coverage, and existing plans scale on HyperExecute |
| Releases slow down under load | Grafana k6 | Latency thresholds fail the pipeline even when every request succeeds |
| Security review wants a scan on every build | ZAP by Checkmarx | Free packaged scans and GitHub Actions |
| Customers find outages before you do | Datadog Synthetic Monitoring or New Relic | Scheduled checks on live user flows from multiple locations |
| Test data cannot leave your network | Kiwi TCMS | Free, self-hosted test management |
TestMu AI covers several of these rows from one platform: cross-browser and real-device runs, visual testing through SmartUI, JMeter and Gatling plans through HyperExecute, and natural-language test authoring with KaneAI.
If your open question is where to run the tests rather than which tool to buy, see our guide to cloud testing tools.
Data residency overrides the table. In finance, healthcare, or government, confirm self-hosting or private locations before comparing features.
And if your SaaS product runs on Salesforce, the criteria change; the best Salesforce test automation tools roundup covers that stack.
Features to Look For in a SaaS Testing Tool
- CI quality gates - a failed test returns a non-zero exit code, so the pipeline blocks the deploy, as Newman, Playwright, and k6 all did in the test data above.
- Coverage where your users are - real browsers and devices for the functional layer, chosen from your own product analytics.
- API contract checks - assertions on fields and types, so a renamed field fails the build before the UI breaks.
- Latency thresholds - load tests that fail when p95 response time crosses a limit, even if every request succeeds.
- Evidence on failure - video, logs, diff images, or traces captured automatically, so a failure is quick to diagnose.
- Environment reach - tunnels or private locations for staging environments that are not publicly reachable.
Conclusion
Start by adding one p95 latency threshold to the pipeline that already runs your functional tests this week. As the k6 run showed, a latency threshold catches a slowdown while every request is still succeeding.
If the functional layer is your gap, point your existing suite at TestMu AI using the getting started guide, and move JMeter or Gatling plans to HyperExecute once load tests outgrow one machine.
Author

Nazneen Ahmad
Blogs: 39


Nazneen Ahmad is a freelance Technical Content SEO Writer with over 6 years of experience in crafting high ranking content on software testing, web development, and medical case studies. She has written 60+ technical blogs, including 50+ top-ranking articles focused on software testing and web development. Certified in Automation Basic and Advanced Training - XO 10, she blends subject knowledge with SEO strategies to create user focused, authoritative content. Over time, she has shifted from quick, keyword-heavy drafts to producing content that prioritizes user intent, readability, and topical authority to deliver lasting value.
Reviewer

Anurag Sharma
Reviewer
Anurag Sharma is Senior Vice President of Engineering at TestMu AI (formerly LambdaTest), leading platform and product engineering across the testing cloud. He improved the streaming technologies behind live and screenshot testing, built the components that run the automation and manual test grids, and created an SSH-based Tunnel over a TCP proxy to test locally hosted and firewall-protected websites. He also built a microservice that scales virtual machines across bare-metal servers on demand using server health stats and weighted round robin. He brings over 12 years of experience across Golang, Node.js, Python, Java, Redis, Kafka, and MySQL, with earlier work engineering decision-support systems for Indian Railways.


SaaS Testing Tools FAQs
Did you find this page helpful?
More Related Blogs
TestMu AI forEnterprise
Get access to solutions built on Enterprise
grade security, privacy, & compliance
- Advanced access controls
- Advanced data retention rules
- Advanced Local Testing
- Premium Support options
- Early access to beta features
- Private Slack Channel
- Unlimited Manual Accessibility DevTools Tests