

Power Your Software Testing with AI Agents and Cloud
The Native AI-Agentic Cloud Platform to Supercharge Quality Engineering. Test Intelligently and Ship Faster.


- TestMu AI (Formerly LambdaTest)
- /
- Blog
- /
- How To Debug Protractor Tests for Selenium Test Automation?
How To Debug Protractor Tests for Selenium Test Automation?
Learn TypeScript for test automation: benefits, frameworks (Playwright, Cypress, Jest), tsconfig setup, and how to debug legacy Protractor tests in Selenium.
Last Updated on:
End to end testing of web applications is pivotal to ensure it’s quality. This is why you need to make sure that all the issues and bugs are addressed. When you encounter issues while testing, the best approach is step by step debugging the code. Debugging can be a great way to ensure that your Selenium automation tests run as intended and there are no false positives or negatives.
In this Protractor tutorial, I’ll get you started on how to debug Protractor tests, which is one of the most popular JavaScript testing frameworks. If you want to learn more about how to write test scripts in Protractor, you can refer to our previous article on cross browser testing with protractor.
⚠ Editorial note: Protractor is deprecated. The Angular team ended Protractor development at the end of 2023, and it is no longer recommended for new projects. Modern JavaScript and TypeScript test automation has moved to Playwright, Cypress, and Jest. The sections below cover TypeScript for test automation first; the Protractor debugging walkthrough that follows remains useful if you maintain an existing Protractor suite.
TypeScript for Test Automation: What It Is and Why Use It
TypeScript is a strongly typed superset of JavaScript that compiles (transpiles) down to plain JavaScript. Everything valid in JavaScript is valid in TypeScript, but you gain an optional static type system on top. For test automation, that type system is the whole point.
Automation engineers are migrating to TypeScript because it moves error detection from runtime to development time. In untyped JavaScript, a mistyped page-object method or a wrong argument only surfaces when the test runs, often as a confusing failure deep in a suite. In TypeScript, the compiler and your IDE flag it as you type, before you ever run the test. For large, long-lived automation suites, catching these compile-time errors early is a major reliability and maintenance win.
Key Benefits of TypeScript in QA: Type Safety and Autocompletion
The value of TypeScript in QA comes down to a few concrete, day-to-day benefits:
- Static typing: Types on page objects, fixtures, and helpers mean the compiler rejects mismatched or missing values before execution, preventing a whole class of flaky, hard-to-trace failures.
- IDE autocompletion (IntelliSense): Editors like VS Code know the shape of your framework and your own code, so methods, locators, and parameters autocomplete. You write tests faster and with fewer typos.
- Early error detection on the CLI: The TypeScript compiler surfaces compile-time errors in your terminal and CI, so broken tests are caught in the pipeline rather than after a long run.
- Safer refactoring: Rename a method or change a signature and the compiler shows every call site that needs updating, which keeps large suites maintainable.
Test Automation Frameworks That Support TypeScript
The reason TypeScript is now the default for JavaScript-based automation is that the modern frameworks support it natively, no bolt-on required. This is also why the ecosystem moved away from legacy tools like Protractor.
- Playwright: Ships with first-class TypeScript support and type definitions out of the box, making it the most common modern choice for end-to-end testing.
- Cypress: Supports TypeScript with minimal configuration, giving typed commands and custom-command definitions.
- Jest: Works with TypeScript via ts-jest or Babel, ideal for unit and component tests with type checking.
Protractor, by contrast, reached end-of-development in 2023. If you are choosing a framework today, Playwright or Cypress with TypeScript is the modern path.
How to Configure TypeScript for Testing (tsconfig.json)
TypeScript is configured through a tsconfig.json file at the root of your project. It tells the compiler how to type-check and transpile your tests. A minimal setup for a test automation project looks like this:
{
  "compilerOptions": {
    "target": "ES2019",
    "module": "commonjs",
    "strict": true,
    "esModuleInterop": true,
    "moduleResolution": "node",
    "baseUrl": ".",
    "paths": {
      "@pages/*": ["src/pages/*"]
    },
    "types": ["node"]
  },
  "include": ["tests/**/*.ts", "src/**/*.ts"]
}- strict: Turns on the full set of type checks, the single most valuable option for catching bugs early.
- moduleResolution: Controls how imports are resolved; "node" matches how Node.js and most frameworks resolve modules.
- paths / baseUrl: Path mapping lets you import page objects as @pages/LoginPage instead of long relative paths.
- include: Tells the compiler which test and source files to type-check and compile.
Most runners (Playwright, Jest via ts-jest, ts-node) compile TypeScript for you, but you can also compile manually with npx tsc to type-check without running the tests.
Can We Use TypeScript in Selenium?
Yes. Selenium WebDriver has official JavaScript bindings (selenium-webdriver on npm) that ship with TypeScript type definitions, so you can write Selenium tests in TypeScript directly. You install the bindings and the Node types, write your tests in .ts files, and run them with a TypeScript-aware runner or after compiling with tsc.
This bridges the gap for teams with an existing Selenium footprint: you keep Selenium's mature, W3C-standard WebDriver protocol and cross-browser reach while gaining TypeScript's type safety and autocompletion. Pair it with a test runner like Jest or Mocha for structure, and you have a modern, typed Selenium suite, without depending on the deprecated Protractor wrapper. You can run those TypeScript Selenium tests at scale across real browsers on TestMu AI's cloud automation testing grid.
Overview
To debug Protractor tests for Selenium test automation, use browser.pause() for interactive terminal analysis or browser.debugger() for step-by-step variable inspection. These methods halt test execution to help you identify and resolve common configuration, dependency, and browser compatibility failures directly from your terminal.
Common Issues When Debugging Protractor Tests
- Cross-browser dependencies: Protractor testing requires managing multiple WebDrivers across different operating systems and browsers, which complicates cross-browser testing and setup.
- Sequential test dependencies: Selenium test automation scenarios follow a sequence where the output of previous test cases serves as the input for subsequent ones, creating complex test flows.
- Unreadable error messages: Long, complex error messages encountered during automation tests can be difficult to comprehend, making it hard to identify the root causes of failures.
- Error source ambiguity: Testers often find it difficult to distinguish whether test failures are related to browser compatibility issues or the test scenario processes themselves.
Types of Failures in Protractor Tests
- Expectation Failure: This failure occurs during Protractor test execution when the expected test results do not match the actual outcomes of the Selenium automation script.
- WebDriver Failure: This failure is triggered when a requested command cannot be executed because elements, attributes, or requested browser addresses are missing from the page.
- Unexpected WebDriver Failure: This failure happens due to sudden browser crashes, operating system failures, or driver update errors that interrupt the WebDriver execution.
- Angular Failure: This failure occurs when the Protractor framework cannot find required Angular libraries, or when the useAllAngular2AppRoots attribute is missing from the configurations.
- Timeout Failure: This failure happens when a Protractor test suite gets stuck in a loop and fails to return data within the designated execution time limit.
How To Debug Protractor Tests in Selenium
- browser.pause(): This method halts Protractor test execution, allowing you to enter interactive repl mode and send WebDriver commands directly to the browser.
- browser.debugger(): This method inserts a breakpoint into your Protractor test code, enabling you to inspect variables and runtime behaviors during execution.
- browser.takeScreenshot(): This method captures the visual state of the browser at failure points to help identify environment-specific or UI-related issues.
- TestMu AI: Running your Protractor tests on the TestMu AI cloud automation testing grid enhances testing efficiency, scalability, and cross-browser reliability.
What Are The Problems To Debug Protractor tests?
While testing a web application, you’ll often encounter bugs in your code. The quality of certain modules might not be apt or there are browser compatibility testing issues. These bugs are caught while you debug your Protractor tests. You might face a few problems along the way, these are as follow :
- Testing of a web application is tricky due to its dependency on the entire system .
- You’ll require a different WebDrivers for various operating systems and browsers for performing cross browser testing.
- The Selenium test automation scenarios follow a sequence of actions and the output of the current test cases serves as the input of the further test cases and hence there is a dependency.
- The long error messages encountered while performing automation tests might be tough to comprehend.
- It becomes difficult to distinguish between errors and issues which are either related to browsers or test scenario processes.

Austin Siewert
Co-Founder, Steadfast Systems
Discovered @TestMu AI yesterday. Best browser testing tool I've found for my use case. Great pricing model for the limited testing I do 👏
2M+ Devs and QAs rely on TestMu AI
Deliver immersive digital experiences with Next-Generation Mobile Apps and Cross Browser Testing Cloud

You can take this certification as proof of expertise in the field of test automation with JavaScript to empower yourself and boost your career.
Here’s a short glimpse of the Selenium JavaScript 101 certification from TestMu AI:

What Are The Types Of Failures You Need To Debug In Protractor Tests?
There are major types of failure scenarios that are encountered while performing Protractor testing. Below are some of the main reasons for failure:
- Expectation Failure
- WebDriver Failure
- WebDriver Unexpected Failure
- Protractor Angular Failure
- Protractor Timeout Failure
Here I’ll further explain these failures in this Protractor tutorial.
Expectation Failure
This is one of frequently occurring and the most common failures encountered when the normal flow execution of the test fails. This results in an expectation failure.
WebDriver Failure
If we encounter a scenario where an element or attribute is not found or even when there is an uncertainty in the address requested by the browser. This results in a Web Driver failure error as the requested command is not executed by the web driver.
WebDriver Unexpected Failure
If there occurs a scenario where the web driver update is failed, and it results in a sudden browser crash or OS-related failure. This state is known as web driver unexpected failure.
Protractor Angular Failure
The scenario where the Protractor framework is unable to find the required Angular libraries in the module is referred to as Protractor Angular Failure. This type of failure also occurs when the useAllAngular2AppRoots attribute is missing from the configurations and it also causes the test process to expect multiple elements but only processing with the single root element.
Protractor Timeout Failure
When the test suite gets stuck in a loop for a long period of time and as a result, the data is not returned in the speculated time. This type of failure is known as Protractor Timeout Failure.

How To Debug Protractor Tests In Selenium?
Protractor extends the functionality of node debugger used by most of the node js applications to debug Protractor tests. This provides us the flexibility to debug protractor tests by adding additional statements required in the debugging mode from the terminal.
You can debug Protractor tests works is by utilizing the following methods stated in this Protractor tutorial:
- Pause Method
- Debugger Method
- Screen Shot Method
Pause Method To Debug Protractor Tests
The pause method provides the easiest and the most popular ways to debug the protractor tests for Selenium test automation. This can be done by appending the browser.pause() the method at the place where we want to pause our tests and check for errors.
As an example of this Protractor Tutorial, I’ll use the script shown below.
test_debug.js
In the script test_debug.js, I have specified a test scenario where we locate an element in the web application using the locator by.binding() with (‘myTestString’) but the launched URL i.e. (https://google.com) in the browser does not have the element with the specified locator.
// test_debug.js //
// describing our Selenium test automation scenario for protractor framework //
describe(' Sample Protractor Test Suite for debugging example ',function(){
// information about the test case //
   it('An Example to perform Debug during Testing',function(){
// launching the url in browser	 //
      browser.get("http://www.google.com");
      element(by.model('testName')).sendKeys('Test Automation');
         // It performs the check whether the element exist or not //
         var myText = element(by.binding('myTestString')).getText();
         expect('Welcome to '+myText+'!').toEqual('Welcome to Test Automation!')
   });
});
When the script shown above in this Protractor tutorial is executed, this will result in a failure with NoSuchElementError. Hence, in order to find the root cause of the issue, it is necessary to debug the script diligently.
Now, I’ll show you how to use the browser.pause() method to debug this failure for Protractor testing. Before proceeding with the changes, I’ll make necessary changes for the configuration in the test_config.js file as shown below:
test_config.js
This is the configuration file used by protractor for managing any config parameter used globally within the web application.
// test_config.js //
// The test_config.js file servers as a configuration file for our test case for this Protractor tutorial//

// setting required config parameters //
exports.config = {
   directConnect: true,

   // Desired Capabilities that are passed as an argument to the web driver instance.
   capabilities: {
      'browserName': 'chrome'  // name of the browser used to test //
   },

   // Flavour of the framework to be used for our test case //
   framework: 'jasmine',

   // The patterns which are relative to the current working directory when

protractor methods are invoked //

   specs: ['test_debug.js'],
// overriding default value of allScriptsTimeout parameter //
      allScriptsTimeout: 999999,
      jasmineNodeOpts: {
// overriding default value of defaultTimeoutInterval parameter //
      defaultTimeoutInterval: 999999
   },
   onPrepare: function () {
      browser.manage().window().maximize();
      browser.manage().timeouts().implicitlyWait(5000);
   }
};
Please note that we have increased the timeout in the above config file for the parameters all Scripts Timeout and default timeout interval to 999999. By default, the timeout interval set is 11 sec and 30 secs respectively.
Now, for debugging the above Selenium test automatio script I’ll need to update the test_debug.js file to add browser.pause() in the place where we would like to pause our test for debugging i.e. after loading the URL. The updated script looks as below:
// test_debug.js //
// describing our test scenario for protractor framework //
describe(' Sample Protractor Test Suite for debugging example ',function(){
// information about the test case
   it('An Example to perform Debug during Testing',function(){
// launching the url in browser //
      browser.get("http://www.google.com");
      browser.pause();
      element(by.model('testName')).sendKeys('Test Automation');
         // It performs the check whether the element exist or not //
         var myText = element(by.binding('myTestString')).getText();
         expect('Welcome to '+myText+'!').toEqual('Welcome to Test Automation!')
   });
});
To script is executed with the below command which will also start the debugger.
$ protractor test_config.js
Here in the output:
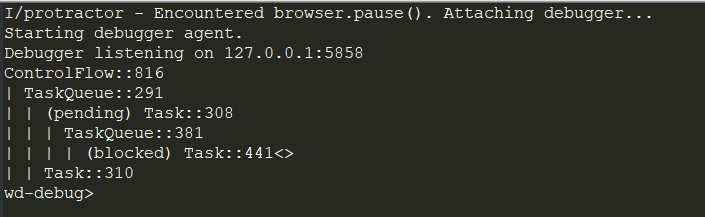
When the above code is executed and the pause command is hit, we can see it pauses the code at that point and the debugger is started after launching the URL in the browser.
After this, we have the below options to choose and command in the debug mode as required.
C: Press the C key and hit enter to move forward in the execution i.e. the next immediate step in the flow is executed by the protractor. If the C is not pressed the test will not move forward halt due to timeout. Also, we can continue using C until a failing statement is encountered.
repl: Using repl command in the terminal allows us to enter the interactive mode which is required in order to send out web driver commands to the browser and executes the protractor statements at run time. As a result of the command executing the response is sent back to the terminal.
For example : The issue in the statement that is causing the error in our script is the element (by.binding(‘’myTestString’)).getText(). Therefore, I’ll use the repl to enter the interactive mode and use the correct locator. You can refer to this article on locators in Protractor to know more about how to use locators with Selenium Protractor.

Ctrl + C : In order to exit the test from the pause state you need to type Ctrl + C to resume the test.

Note: Try LT Debug Chrome Extension for debugging websites!
Debugger Method To Debug Protractor Tests
The usage of the debugger method to debug the test cases in Protractor is very simple and similar to the one we used with the pause method. You just need to place it at the proper point where we want to add a breakpoint in the code. It can be achieved by using the browser.debugger() as a replacement for browser.pause() in the Selenium test automation script. In order to debug the code, it makes use of the node debugger.
// test_debug.js //
// describing our Selenium test automation scenario for protractor framework //
describe(' Sample Protractor Test Suite for debugging example ',function(){
// information about the test case
   it('An Example to perform Debug during Testing',function(){
// launching the url in browser //
      browser.get("http://www.google.com");
      browser.debugger();
      element(by.model('testName')).sendKeys('Test Automation');
         // It performs the check whether the element exist or not //
         var myText = element(by.binding('myTestString')).getText();
         expect('Welcome to '+myText+'!').toEqual('Welcome to Test Automation!')
   });
});
The protractor testing script is executed with the debug option as shown in the below command. This command will also start the debugger.
$ protractor debug test_config.js
While using the debug method, we can also choose to type C command in the terminal similar to the one used in the pause method for continuing forward in the test code. But unlike the pause method, it can only be used once in case of the debugger method.
Screenshot Method To Debug Protractor Tests
Another exciting way of debugging a test script is by taking a screenshot. We can enable the WebDriver to take a screenshot with browser.takeScreenshot(). This provides a great way to debug tests mainly on the integration servers that continuously execute the tests. This will result in generating a screenshot in PNG format with base 64 encoded.
test_debug.js
// test_debug.js //
// the variable declared at the beginning of the test script:
var myscript = require('fs');

// function that defines how to write screenshot to a file
function writeScreenShot(data, filename) {
    var mystream = myscript.createWriteStream(filename);

    mystream.write(new Buffer(data, 'base64'));
    mystream.end();
}


// describing our test scenario for protractor framework //
describe(' Sample Protractor Test Suite for debugging example ',function(){
// information about the test case
   it('An Example to perform Debug during Testing',function(){
// launching the url in browser //
    browser.get("http://www.google.com");
    browser.takeScreenshot().then(function (png) {
    writeScreenShot(png, 'exception.png');
});
      element(by.model('testName')).sendKeys('Test Automation');
         // It performs the check whether the element exist or not //
         var myText = element(by.binding('myTestString')).getText();
         expect('Welcome to '+myText+'!').toEqual('Welcome to Test Automation!')
   });
});
Complete Guide To Handle Multiple Windows With Selenium & Protractor
Debug Protractor Tests On Online Selenium Grid Platform
In order to scale your testing efforts and test on multiple browsers and OS you can use a cloud Selenium Grid to perform cross browser testing. You can execute the same test script to debug Protractor tests in the cloud Selenium grid with minimal configuration changes that are required to build the driver and connect to the TestMu AI hub. Below is the updated script with the required changes for testing with cloud Selenium Grid for this Protractor tutorial.
test_config.js
// test_config.js //
// The test_config.js file servers as a configuration file for out test case //

LT_USERNAME = process.env.LT_USERNAME || "irohitgoyal"; // Lambda Test User name
LT_ACCESS_KEY = process.env.LT_ACCESS_KEY || "123456789"; // Lambda Test Access key

exports.capabilities = {
  'build': ' Automation Selenium Webdriver Test Script ', // Build Name to be display in the test logs
  'name': ' Protractor Selenium Debugging Test on Chrome',  // The name of the test to distinguish amongst test cases //
  'platform':'Windows 10', //  Name of the Operating System
  'browserName': 'chrome', // Name of the browser
  'version': '79.0', // browser version to be used
  'visual': false,  // flag to check whether to take step by step screenshot
  'network':false,  // flag to check whether to capture network logs
  'console':false, // flag to check whether to capture console logs.
  'tunnel': false // flag to check if it is required to run the localhost through the tunnel
  };

// setting required config parameters //
exports.config = {
   directConnect: true,

   // Desired Capabilities that are passed as an argument to the web driver instance.
   capabilities: {
      'browserName': 'chrome'  // name of the browser used to test //
   },

   // Flavour of the framework to be used for our test case //
   framework: 'jasmine',

   // The patterns which are relative to the current working directory when

protractor methods are invoked //

   specs: ['test_debug.js'],
// overriding default value of allScriptsTimeout parameter //
      allScriptsTimeout: 999999,
      jasmineNodeOpts: {
// overriding default value of defaultTimeoutInterval parameter //
      defaultTimeoutInterval: 999999
   },
   onPrepare: function () {
      browser.manage().window().maximize();
      browser.manage().timeouts().implicitlyWait(5000);
   }
};
test_debug.js
// test_config.js //
// The test_config.js file servers as a configuration file for out test case //

LT_USERNAME = process.env.LT_USERNAME || "irohitgoyal"; // Lambda Test User name
LT_ACCESS_KEY = process.env.LT_ACCESS_KEY || "123456789"; // Lambda Test Access key

exports.capabilities = {
  'build': ' Automation Selenium Webdriver Test Script ', // Build Name to be display in the test logs
  'name': ' Protractor Selenium Debugging Test on Chrome',  // The name of the test to distinguish amongst test cases //
  'platform':'Windows 10', //  Name of the Operating System
  'browserName': 'chrome', // Name of the browser
  'version': '79.0', // browser version to be used
  'visual': false,  // flag to check whether to take step by step screenshot
  'network':false,  // flag to check whether to capture network logs
  'console':false, // flag to check whether to capture console logs.
  'tunnel': false // flag to check if it is required to run the localhost through the tunnel
  };

// setting required config parameters //
exports.config = {
   directConnect: true,

   // Desired Capabilities that are passed as an argument to the web driver instance.
   capabilities: {
      'browserName': 'chrome'  // name of the browser used to test //
   },

   // Flavour of the framework to be used for our test case //
   framework: 'jasmine',

   // The patterns which are relative to the current working directory when

protractor methods are invoked //

   specs: ['test_debug.js'],
// overriding default value of allScriptsTimeout parameter //
      allScriptsTimeout: 999999,
      jasmineNodeOpts: {
// overriding default value of defaultTimeoutInterval parameter //
      defaultTimeoutInterval: 999999
   },
   onPrepare: function () {
      browser.manage().window().maximize();
      browser.manage().timeouts().implicitlyWait(5000);
   }
};
As you can see you can perform the test script in the cloud by just adding a few lines of code that are required to connect to the TestMu AI platform. You are required to generate the desired capability matrix and through this, you can specify the environment on which you would like to execute our tests. Also, you need to add the TestMu AI username and access key which uniquely identifies with the TestMu AI platform. Here is the link to visit TestMu AI Selenium desired capabilities generator.
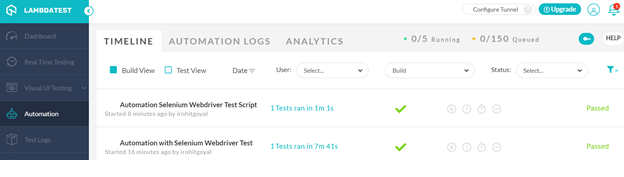
We can see that our Selenium test automation script got executed successfully on the platform and you can also execute the same set of commands that we used on the terminal while using the pause and debugger methods to debug Protractor tests. Below is the output on running the test:
Also Read: Automated Cross Browser Testing With Protractor & Selenium

Wrapping It Up!
This brings us to an end to this Protractor tutorial on how to debug Protractor tests for Selenium test automation. To sum up, I explained the challenge faced during the end to end application test. I further got into the detail of using the framework and in-built methods to debug Protractor test cases in an interactive manner. It can be put to good use especially when performing end to end testing and taking screenshots whenever required. Executing these tests on the cloud platform also has its own benefits in saving costs on the infrastructure setup and maximizing test coverage.
Do share your view on this Protractor tutorial with us in the comment section down below. Also, help us to share this article with your friends. That’s all folks! Happy Debugging!

Author

Praveen Mishra
Blogs: 23


Praveen Mishra is a community contributor with 7 years of experience in B2B SaaS, specializing in testing automation and data-driven testing strategies. He holds a Bachelor's degree in Computer Applications (Computer Science) and has written 25+ technical articles on automation testing, CI/CD, cross-browser testing, and related topics. Praveen is followed by over 10,000 professionals from the QA community, including QA engineers, tech leaders, AI enthusiasts, and DevOps professionals, on LinkedIn.
Reviewer

Navin Chandra
Reviewer
Navin Chandra is a Member of Technical Staff at TestMu AI (formerly LambdaTest), building the open-source automation that powers its Selenium and Appium cloud grid. A committer to both Selenium and Appium, he implemented WebDriver BiDi support in Selenium for real-time browser events and bidirectional control and is developing Apple's iOS RemoteXPC protocol in Appium to enable low-level wireless communication with iOS system services. He contributes to Selenium across multiple language bindings as a member of the Selenium GitHub organization. He has served as a Google Summer of Code mentee and mentor at openSUSE and an LFX mentee at CNCF's KubeArmor, and is a SUSE Certified Deployment Specialist. Navin holds a B.Tech in Computer Science.
On This Page
- TypeScript for Test Automation: What It Is and Why Use It
- Key Benefits of TypeScript in QA: Type Safety and Autocompletion
- Test Automation Frameworks That Support TypeScript
- How to Configure TypeScript for Testing (tsconfig.json)
- Can We Use TypeScript in Selenium?
- What Are The Problems To Debug Protractor tests?
- What Are The Types Of Failures You Need To Debug In Protractor Tests?
- How To Debug Protractor Tests In Selenium?
- Debug Protractor Tests On Online Selenium Grid Platform
TypeScript Test Automation & Protractor FAQs
Did you find this page helpful?
More Related Blogs
TestMu AI forEnterprise
Get access to solutions built on Enterprise
grade security, privacy, & compliance
- Advanced access controls
- Advanced data retention rules
- Advanced Local Testing
- Premium Support options
- Early access to beta features
- Private Slack Channel
- Unlimited Manual Accessibility DevTools Tests