

Next-Gen App & Browser Testing Cloud
Trusted by 2 Mn+ QAs & Devs to accelerate their release cycles


How to Inspect Elements?
To inspect elements, open your browser's developer tools by right-clicking any part of a web page and choosing Inspect (or Inspect Element), or by pressing Ctrl+Shift+I on Windows and Linux or Cmd+Option+I on macOS. The Elements panel then shows the page's live HTML and CSS, which you can read and edit locally without affecting the real website.
Inspecting web elements helps you modify a website's layout and debug issues. It lets developers, testers, and designers manipulate CSS properties like fonts, sizes, colors, and spacing to preview how a change will look before shipping it. Every major browser, including Chrome, Firefox, Edge, and Safari, ships built-in developer tools for this purpose.
What Does Inspecting an Element Mean?
Inspecting an element means opening the browser's developer tools (DevTools) to view the underlying code that renders a web page. The Elements (or Inspector) panel exposes the Document Object Model (DOM), the styles applied to each node, box-model dimensions, and event listeners. Because the browser paints the page from this code, editing it in DevTools instantly re-renders the page in front of you.
Crucially, these edits are local and temporary. Nothing you change is saved to the server or seen by other visitors, and a simple page refresh restores the original state. That makes inspect element a safe sandbox for experimenting with layouts, reproducing bugs, and grabbing selectors for automation testing.
How to Inspect Elements in Google Chrome
Chrome DevTools is the most widely used inspector. There are three ways to open it:
- Right-click anywhere on the page and select Inspect.
- Press Ctrl+Shift+I (Windows/Linux), Cmd+Option+I (macOS), or F12.
- Click the three-dot menu in the top-right corner, then choose More tools > Developer tools.
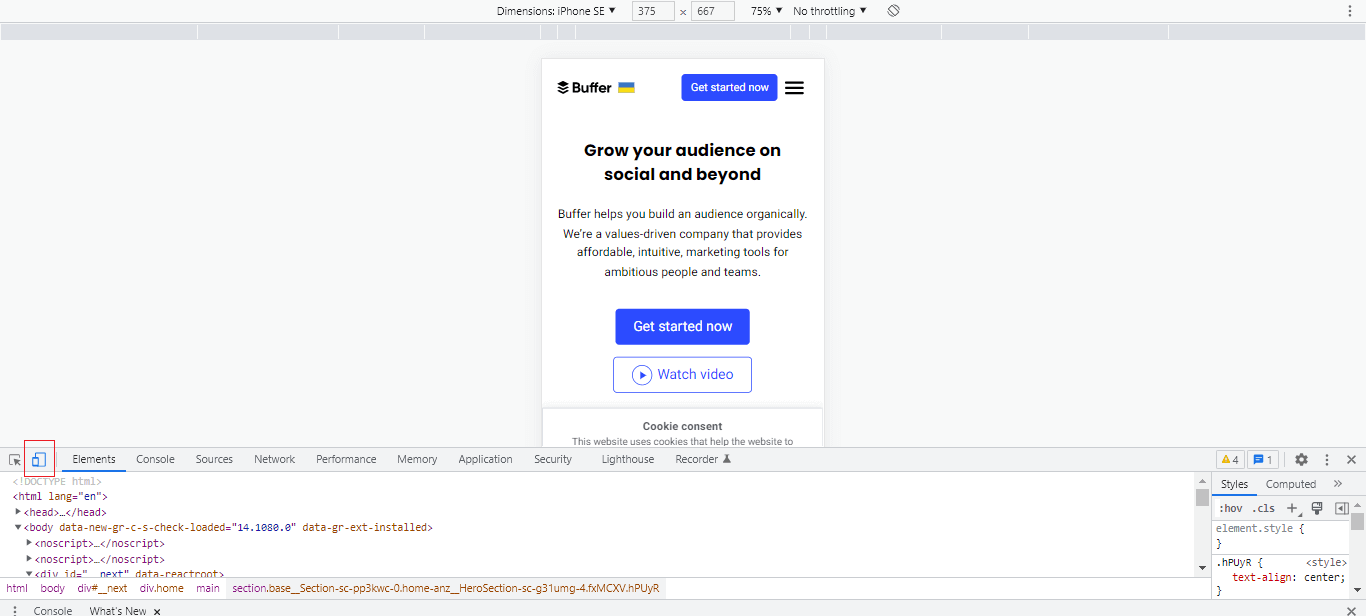
The Elements panel opens with the DOM tree on the left and the Styles pane on the right. Use the element-picker icon (top-left of DevTools, or Ctrl+Shift+C) to hover over the page and highlight the exact node you want. To test a device viewport, click the Device toolbar (toggle-device) icon and pick an Android or iOS profile.
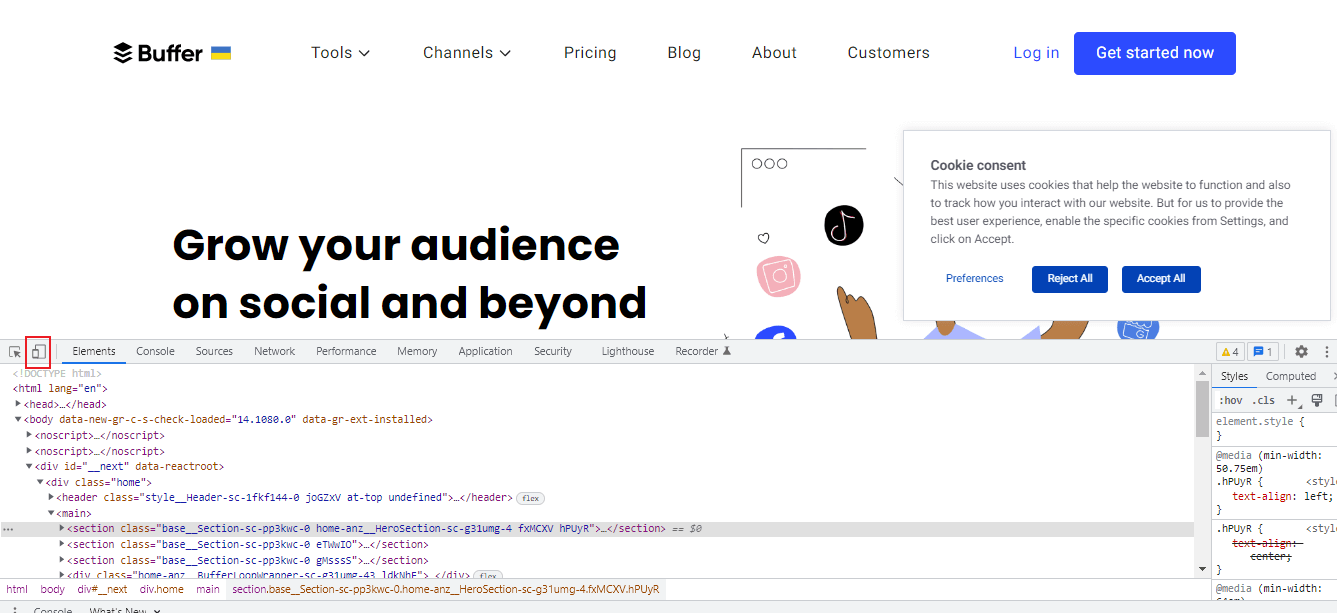
Once the device toolbar is on, select any Android or iOS device from the dropdown and start inspecting elements at that resolution.
How to Inspect Elements in Firefox, Edge, and Safari
The workflow is nearly identical across browsers, with small differences in the menu path:
- Mozilla Firefox: Right-click and choose Inspect (Q), or press Ctrl+Shift+I / Cmd+Option+I. The picker shortcut is Ctrl+Shift+C. You can also open it from the hamburger menu > More tools > Web Developer Tools.
- Microsoft Edge: Edge is Chromium-based, so it shares Chrome's shortcuts. Right-click > Inspect, or press F12 / Ctrl+Shift+I.
- Safari (macOS): First enable the Develop menu via Safari > Settings > Advanced > Show features for web developers. Then right-click and choose Inspect Element, or press Cmd+Option+I.
Because rendering differs subtly between engines (Blink, Gecko, and WebKit), it is good practice to inspect the same page across multiple browsers during cross browser testing rather than trusting a single browser.
Editing HTML and CSS Live
The real power of inspect element is live editing. Double-click any text node to change its content, or right-click a node and choose Edit as HTML to rewrite entire blocks. In the Styles pane you can toggle, edit, or add CSS declarations and watch the page reflow instantly. For example, adding this rule to a selected button node changes it on the spot:
.cta-button {
    background-color: #2f66f4;
    color: #ffffff;
    padding: 12px 24px;
    border-radius: 6px;
}
Beyond the Elements panel, the Console lets you run JavaScript against the page. A quick way to grab a node programmatically is:
// Select the first matching element and log it
const el = document.querySelector('.cta-button');
console.log(el.getBoundingClientRect());
Using Selectors for Test Automation
Inspecting elements is a core step in writing reliable automated tests. Right-click a node in the Elements panel, choose Copy, then Copy selector or Copy XPath to obtain a locator you can drop straight into a Selenium, Playwright, or Cypress script. For instance, a copied CSS selector can be used in a Selenium automation test like this:
WebElement loginBtn = driver.findElement(By.cssSelector("#login-form button.submit"));
loginBtn.click();
Prefer stable attributes such as id or data-testid over long, auto-generated XPaths, which break easily when the DOM changes. If you are new to element location strategies, the guide on locating elements on a web page is a useful companion.
Common Mistakes and Troubleshooting
- Expecting edits to persist: Inspect-element changes vanish on refresh. To keep them, copy the code into your source files or use DevTools Local Overrides.
- Missing Develop menu in Safari: Inspect Element is hidden until you enable developer features in Advanced settings.
- Copying brittle selectors: Auto-generated XPaths tied to element position break on the next layout change. Anchor tests to stable IDs or data attributes.
- Trusting device emulation: The device toolbar mimics viewport size but not real GPU, touch, or OS behavior. Validate on real hardware before release.
- Editing the wrong node: Use the element picker (Ctrl+Shift+C) instead of scrolling the DOM tree so you select exactly what you hover.
Conclusion
Inspecting elements is one of the most practical skills for anyone working with the web. With a right-click or a quick keyboard shortcut you can read a page's HTML and CSS, edit it live, debug JavaScript, and copy selectors for automation, all safely and locally. Master the workflow in Chrome first, then apply the same steps in Firefox, Edge, and Safari, and validate what you find across real browsers and devices to catch issues emulation would miss.
Frequently Asked Questions
What is the shortcut for inspect element?
Press Ctrl+Shift+I on Windows or Linux, and Cmd+Option+I on macOS, to open developer tools in Chrome, Edge, and Firefox. F12 also works on Windows. To jump straight to element-picker mode, use Ctrl+Shift+C or Cmd+Option+C.
Can you inspect elements on a mobile device?
Yes. Use the device toolbar in Chrome or Edge DevTools to emulate mobile viewports, or enable remote debugging over USB. For true accuracy, inspect elements on real Android and iOS devices in a cloud like TestMu AI instead of relying on emulation alone.
Is using inspect element safe?
Yes. Inspect element only edits the page locally in your own browser. Changes are temporary and disappear on refresh, so they never modify the live website or reach the server. It is a safe, standard tool for developers, testers, and designers.
Why is inspect element grayed out or missing in Safari?
Safari hides developer features by default. Open Safari > Settings > Advanced and enable Show features for web developers (Show Develop menu). The Develop menu and Inspect Element option then appear when you right-click a page.
What can you do after inspecting an element?
You can read and edit HTML and CSS live, test copy and layout changes, copy element selectors and XPath for automation, debug JavaScript in the Console, monitor network requests, and audit performance and accessibility, all without changing the real site.
How do I copy the XPath or CSS selector of an element?
In the Elements panel, right-click the highlighted node, choose Copy, then select Copy selector or Copy XPath. This gives you a locator you can reuse in Selenium, Playwright, or Cypress scripts to reliably target that element.
Related Questions

KaneAI - Testing Assistant
World’s first AI-Native E2E testing agent.

TestMu AI forEnterprise
Get access to solutions built on Enterprise
grade security, privacy, & compliance
- Advanced access controls
- Advanced data retention rules
- Advanced Local Testing
- Premium Support options
- Early access to beta features
- Private Slack Channel
- Unlimited Manual Accessibility DevTools Tests