

Power Your Software Testing with AI Agents and Cloud
The Native AI-Agentic Cloud Platform to Supercharge Quality Engineering. Test Intelligently and Ship Faster.


- TestMu AI (Formerly LambdaTest)
- /
- Blog
- /
- Complete Guide To Memory Leakage Testing In JavaScript
Complete Guide To Memory Leakage Testing In JavaScript
Learn how to debug memory leaks in JavaScript with Chrome DevTools heap snapshots, allocation timelines, and Mark and Sweep garbage collection basics.

Last Updated on:
Debugging memory leaks in JavaScript means finding objects and DOM nodes that stay reachable after the page no longer needs them, so the garbage collector can never free their memory.
Chrome developer tools expose these leaks directly: the Performance panel graphs heap growth during a recording, and a heap snapshot shows which JavaScript objects and DOM nodes hold memory.
This guide explains why memory leaks hurt performance, how Mark and Sweep garbage collection works, how to find leaks with Chrome's tools, and how AI agents now take heap snapshots.
Key Takeaways
- A JavaScript memory leak is memory that stays allocated after the page no longer needs it, because some reference still points to it.
- JavaScript frees memory with the Mark and Sweep algorithm: the garbage collector marks every block reachable from the root and sweeps away the rest.
- A leak survives garbage collection when code keeps an unintended reference, such as a detached DOM node still held by a JavaScript variable.
- The Chrome Task Manager, opened with Shift+Esc, shows a memory footprint that keeps rising when a page creates DOM nodes it never releases.
- The Chrome DevTools Memory panel offers heap snapshot, allocations on timeline, allocation sampling and detached elements profiles for tracing where memory goes.
- The Chrome DevTools MCP server lets a coding agent take a heap snapshot and query it for detached or oversized objects.
Introduction
Memory leakage testing in JavaScript relies on browser tools such as Chrome's heap snapshot and timeline recording to trace which DOM nodes and scripts keep consuming memory instead of returning it to the free pool. Left unchecked, these leaks are why some web pages take forever to load and can even crash the browser tab.

A JavaScript code has the same effect, the memory blocks are allocated for the various tasks, and when there is no need of them they return back to the free memory pool. When after using the allocated memory doesn’t get back to the free pool of memory, we define it as a memory leak.
Leaking Bad
Ever wonder why sometimes it takes forever loading a website, it may be because of this memory leakage issue. Memory Leakage greatly affects performance. Too much of leakage can even result in crashing. High latency will take away all your joy if you enjoy gaming. Memory leakage is a serious problem and it must be tackled similarly.
Mark and Sweep
One of the reasons why JS is loved dearly by its users is also because of the fact that it is a garbage collected language.
‘What is Garbage Collected language’ you ask?
Basically it helps you keep track of the previously allocated memory and help you keep the leakage to the minimum and it does that by the simple yet effective algorithm that is called as ‘Mark and Sweep’.
Imagine a network of memory blocks interconnected, now you go to the root and mark all the reachable(referenced) blocks from the root. When it is done, you have all the memory that is allocated to your script. Now the rest of the blocks, which can’t be reached, must not be in use by your script. So they are swept away to the OS and put in the free memory pool. The algorithm seems almost perfect but still there are many ways that leakage still can happen.
Finding Leakage in Memory
Browsers like chrome provide a variety of solutions to the memory crisis by providing specialized tools to the developers. Using Chrome task manager you can easily manage and keep track of the heap memory(allocated to JS) as well as DOM nodes.It informs you about how much memory the page is using in totality. If the Memory is increasing that means more and more DOM nodes are getting created.
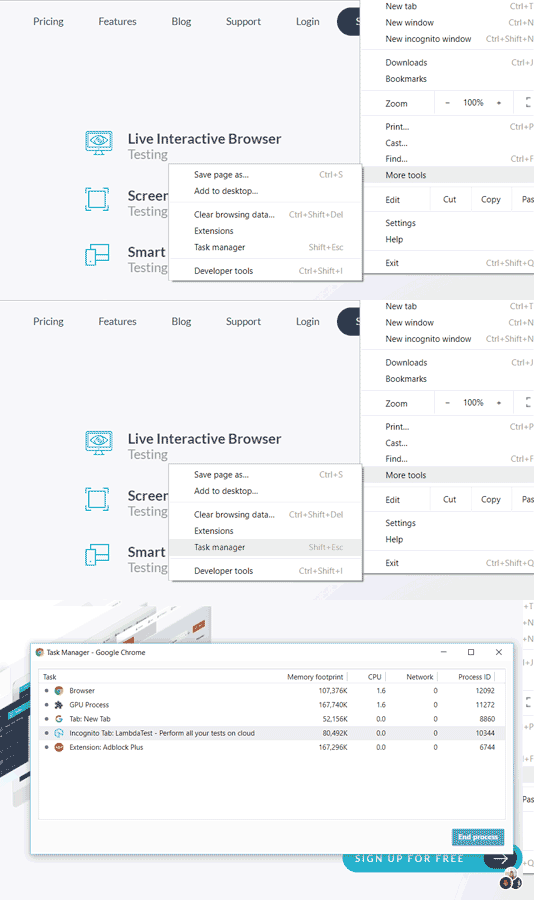
Visualize your memory leaks in the Chrome DevTools Performance panel: enable the Memory checkbox, start a recording, and click the Collect garbage button to compare memory before and after garbage collection. Heap snapshot is very effective in knowing the DOM nodes creation and keeping in check the leakages due to the faulty scripts.
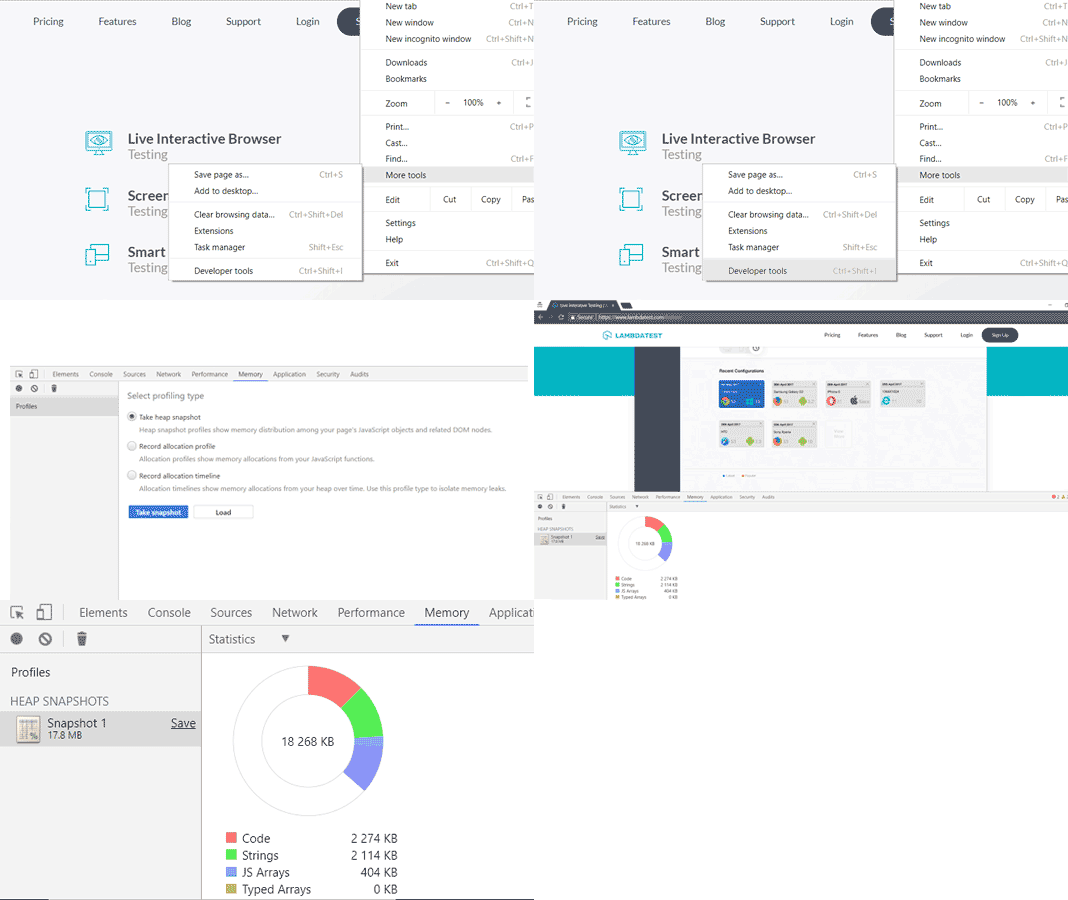
The Allocations on timeline profile in the Memory panel helps when you feel some action causes memory leakage. After clicking the record button, perform the action and then study the graph for unusual memory allocation.

The Allocation sampling profile breaks memory allocation down by JavaScript function while you perform a suspected leakage task.

The Detached elements profile lists elements that were removed from the DOM tree but are still referenced by JavaScript code. Detached DOM nodes are a common cause of memory leaks, because the garbage collector cannot free a node while any reference to it remains.

Note: Try LT Debug Chrome Extension for debugging websites!
Can AI Agents Debug JavaScript Memory Leaks?
Yes. AI agents can now capture and query heap snapshots through the Chrome DevTools MCP server, a Model Context Protocol server maintained by the Chrome DevTools team.
The server lets a coding agent such as Claude, Cursor or Copilot control and inspect a live Chrome browser. The agent can then repeat a leak-prone user flow and collect memory data without a developer clicking through DevTools.
- Heap snapshot capture: the take_heapsnapshot tool records a heap snapshot of the page the agent is testing, the same kind of snapshot the Memory panel records.
- Snapshot queries: optional memory-debugging tools filter heap objects by class name, retained size or detached state, so the agent can list detached DOM nodes without reading the whole snapshot.
- Repeatable reproduction: the server drives the page with Puppeteer browser automation, so the agent can run the same clicks many times and compare snapshots taken between runs.
- Memory-leak-debugging skill: the repository ships an agent skill that describes how to debug memory leaks with these tools.
A heap snapshot shows what memory is retained, not why the code keeps the reference. AI debugging speeds up collecting and filtering that data, but a developer still reads the retainer path and the source to confirm the root cause before shipping a fix.
Running the same agent flow after each release turns a leak check into a repeatable part of web performance testing.
Conclusion
Oscar Wilde once said “Memory is the diary that we all carry about with us”.
In the end we all want web pages to load faster, to work and perform efficiently without putting pressure on your system. To enable that we should follow good practices and follow efficient scripting. The causes of memory leakage and the coding patterns that prevent it are covered in eradicating memory leaks in JavaScript.





Memory Leaks in JavaScript FAQs
Did you find this page helpful?
More Related Blogs
TestMu AI forEnterprise
Get access to solutions built on Enterprise
grade security, privacy, & compliance
- Advanced access controls
- Advanced data retention rules
- Advanced Local Testing
- Premium Support options
- Early access to beta features
- Private Slack Channel
- Unlimited Manual Accessibility DevTools Tests