

Power Your Software Testing with AI Agents and Cloud
The Native AI-Agentic Cloud Platform to Supercharge Quality Engineering. Test Intelligently and Ship Faster.


- TestMu AI (Formerly LambdaTest)
- /
- Learning Hub
- /
- Chrome Remote Debugging for Web Development and Testing
Chrome Remote Debugging for Web Development and Testing
Learn how Chrome Remote Debugging lets developers inspect, debug, and optimize web pages on remote devices in real-time across browsers.
Last Updated on:
On This Page
- What Is Chrome Remote Debugging?
- Why Perform Chrome Remote Debugging?
- How to Debug Websites Remotely on Chrome?
- How to Perform Chrome Remote Debugging Across Various Browsers?
- What Are the Various Elements of Chrome Remote Debugging?
- Troubleshooting Challenges of Chrome Remote Debugging
- Best Practices of Chrome Remote Debugging
- Conclusion
- Citations
Chrome remote debugging provides developers with a direct way to inspect and troubleshoot web pages running on another device or environment. It becomes essential when issues cannot be reproduced on a local machine, such as bugs that appear only on mobile devices, embedded systems, or headless browsers.
By connecting Chrome’s developer tools to a remote instance, developers can view real-time logs, inspect the DOM, monitor network activity, and analyze performance exactly as it occurs on the target device. This makes Chrome remote debugging a reliable method for achieving accurate diagnosis, improving debugging efficiency, and supporting testing across a wide range of platforms and configurations.
TL;DR
- Chrome remote debugging inspects a page running on another device from desktop DevTools, over USB, Wi-Fi or a cloud connection.
- On Android, enable USB debugging and connect the phone, then open chrome://inspect to list the device and its tabs.
- Clicking Inspect on a listed tab opens a full DevTools window driving that remote page.
- Port forwarding lets the phone reach a site running on your desktop localhost, so staging builds can be debugged remotely.
- DevTools can attach to headless Chrome inside containers through the Chrome DevTools Protocol, which helps when debugging CI runs.
- TestMu AI gives the same DevTools access on real devices and browser versions a team does not own.
What Is Chrome Remote Debugging?
Chrome Remote Debugging refers to the process of debugging a web page on a remote device by connecting it to the host device, either wirelessly or through a wired connection. This connection is established using the Chrome DevTools Protocol, which exposes a WebSocket endpoint running over TCP to enable communication between the developer’s device and the remote device.
The remote device can be a mobile phone, tablet, TV, desktop, or Chromecast. This guide focuses on mobile devices due to the additional steps involved in larger devices.
Once the remote device and host device are connected, developers and testers can operate the remote device and debug it using Chrome developer tools on the host device. Through Chrome Developer Tools, developers can view the code, console logs, network parameters, and perform any action accessible through the “Inspect” tab.

Note: Run tests at scale across 3,000+ browser and OS combinations. Try TestMu AI Now!
Why Perform Chrome Remote Debugging?
Remote debugging in Chrome solves multiple problems in software development and testing lifecycles.
- Single Host Device for Everything: One host machine can connect to multiple remote devices through USB or over the network. Developers and testers can switch between devices easily and run debugging sessions more efficiently.
- Debug Mobile Issues Quickly: Remote debugging provides access to the full Chrome DevTools suite, such as DOM inspection, code editing, console logs, and network monitoring, which is not available in the mobile Chrome browser. This removes the slow, trial-and-error approach normally required on mobile devices.
- Gain a Larger Perspective: With remote debugging enabled, developers can use all DevTools panels to analyze performance, network activity, security, memory usage, and Lighthouse metrics, just as they would on desktop Chrome.
- Real Device Testing: Remote debugging makes it possible to test directly on real devices instead of relying on simulators or emulators, which often fail to accurately reproduce real device behavior.
- Focus on Hardware Issues: Since devices differ in hardware, OS versions, and browser implementations, remote debugging helps identify issues that are specific to certain device configurations.
- Debug Containerized Applications: Remote debugging can be used to connect Chrome DevTools to headless Chrome or Chromium instances running inside containers like Docker, enabling debugging in isolated environments.
- DOM Editing: Remote debugging lets developers modify DOM elements and styles directly in DevTools and see the changes reflected immediately on the remote device, removing the need for rebuilds or reinstalls for visual adjustments.
All these advantages of using remote debugging in Chrome help enhance the quality of testing significantly and enhance the testing workflow by improving visibility, accuracy, and speed during diagnosis.
How to Debug Websites Remotely on Chrome?
Developers can remotely debug websites in Chrome using three main approaches:
- Chrome DevTools (USB debugging): Enables direct connection between the remote device and host computer via USB, providing reliable access to Chrome DevTools for real-device inspection.
- Chrome DevTools (wireless debugging via port forwarding): Allows devices to connect to Chrome DevTools over Wi-Fi using a forwarded debugging port, removing the need for a physical USB cable.
- Chrome DevTools Protocol-based tools: Uses the Chrome DevTools Protocol (CDP) to automate inspection, debugging, and profiling in headless, remote, and CI environments.
Chrome DevTools (USB Debugging)
USB debugging allows developers to inspect and debug websites running on a physical Android device directly from Chrome DevTools on a host machine. This method provides real device testing and access to full DevTools functionality.
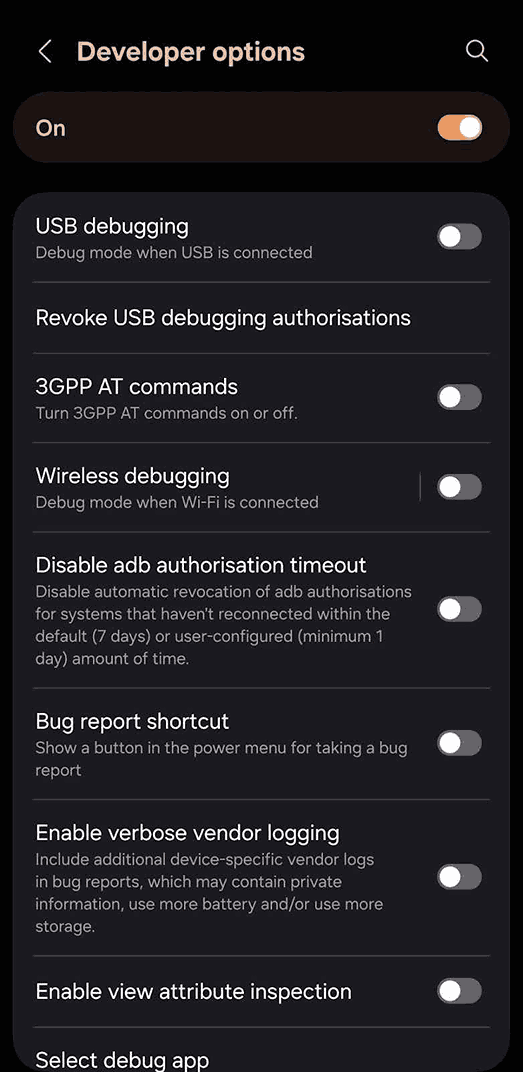
- Enable Developer Options: Enabling Developer Options provides access to advanced device configurations required for USB debugging and testing workflows.
- Activate USB Debugging: USB debugging allows the Android device to communicate with Chrome DevTools on the host system securely and reliably.
- Connect Device to Host Machine: Connect the Android device via USB to establish a stable debugging bridge between the device and your computer.
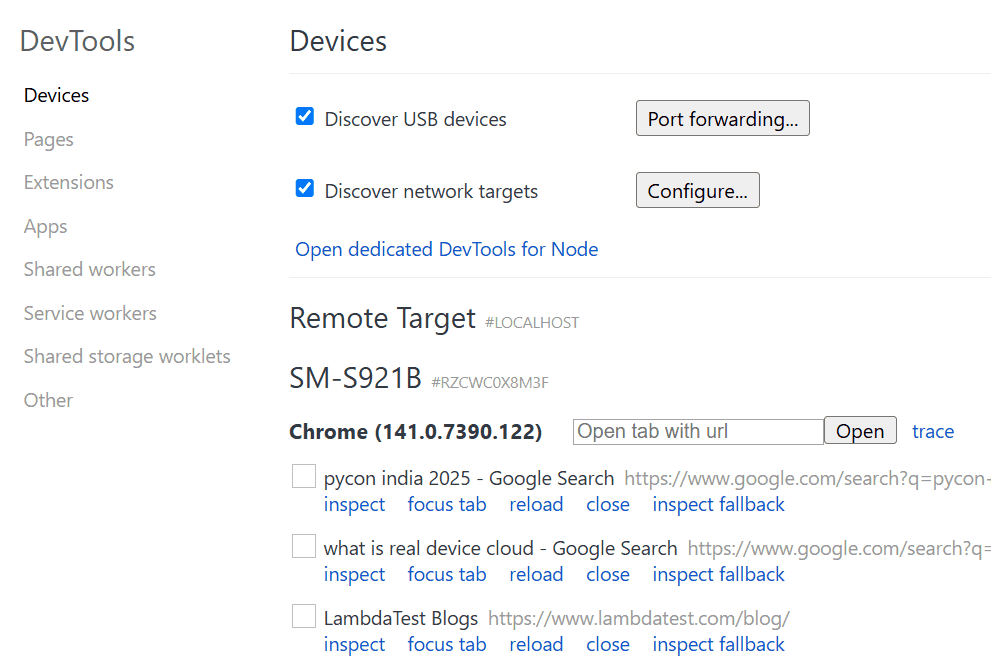
- Open chrome://inspect: Navigating to chrome://inspect displays connected devices and active browser tabs for live inspection and debugging.
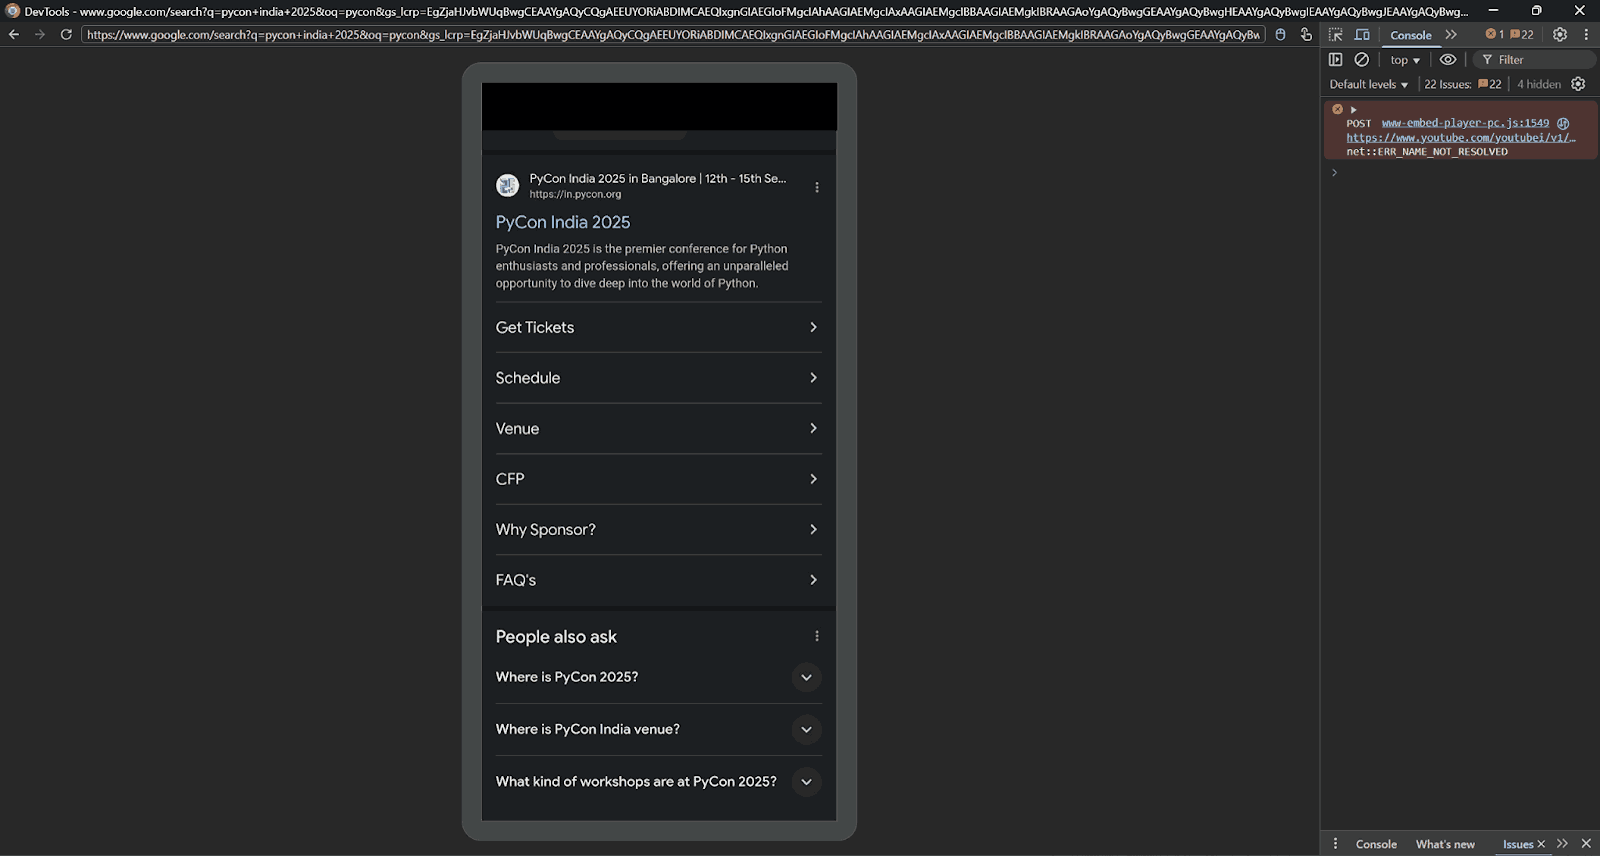
- Inspect and Mirror Remote Tabs: Selecting “Inspect” opens DevTools for that tab, enabling DOM inspection, console logging, and remote page interaction.
Chrome DevTools (Wireless Debugging via Port Forwarding)
Wireless debugging allows developers to inspect and debug a Chrome instance without using a physical USB connection. It relies on the --remote-debugging-port flag to expose a WebSocket endpoint. The host Chrome DevTools can connect to this endpoint to inspect the DOM, debug JavaScript, monitor network activity, and analyze performance.
This method is especially useful for testing isolated Chrome instances or remote servers.
- Launch Chrome with a Remote Debugging Port: This exposes a WebSocket endpoint (ws://localhost:PORT/devtools/browser/...) that DevTools can connect to.
macOS:
open -a "Google Chrome" --args --remote-debugging-port=PORTWindows:
start chrome --remote-debugging-port=PORTLinux:
google-chrome --remote-debugging-port=PORTReplace PORT with a 4-digit number (example: 9926). This opens a separate, isolated Chrome instance, which may prompt for a fresh sign-in.
Enable Port Discovery on the Host Instance:
- Open your regular Chrome (host): Launch the main Chrome browser on your host machine to begin the remote debugging setup.
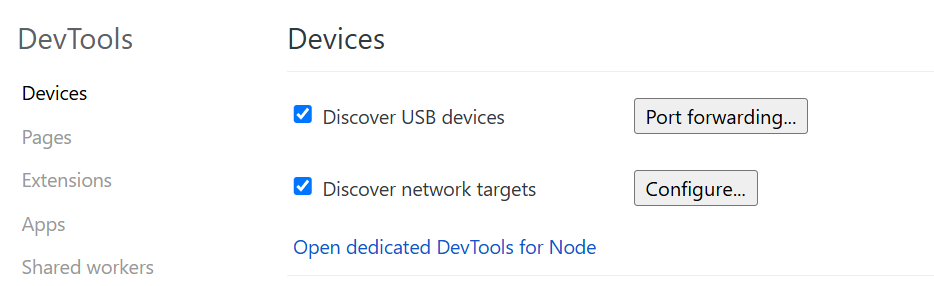
- Visit chrome://inspect: Navigate to this page to view and manage all discoverable remote debugging targets.
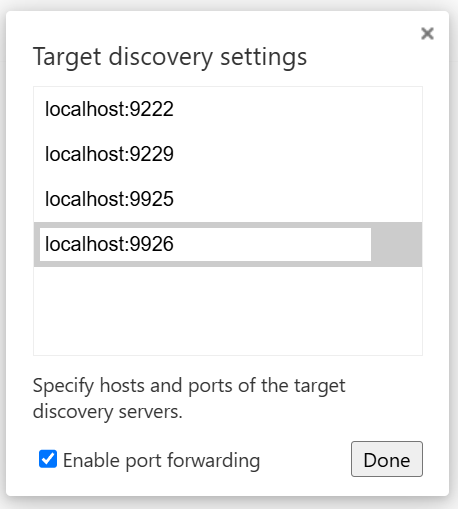
- Click Configure under Discover network targets: Open the configuration dialog to add or manage ports used for detecting remote debugging targets.
- Add localhost:PORT: Enter the remote debugging port to allow Chrome to automatically discover and list the target instance.
- Enable “Port forwarding” if required: Turn on port forwarding to route traffic from the host to the remote device or instance for seamless debugging access.
- Click Done: Save the network target and port forwarding settings to complete the configuration.
Chrome DevTools Protocol-Based Tools
The Chrome DevTools Protocol (CDP) provides a set of APIs for programmatically controlling Chrome or Chromium instances. Developers can automate debugging, testing, and monitoring without manually opening DevTools. CDP works with headless Chrome, CI/CD pipelines, and containerized environments.
- DOM Inspection: Query and modify page elements programmatically.
- Console Monitoring: Capture logs, warnings, and errors automatically.
- Network Monitoring: Track requests, responses, and headers without manual inspection.
- Performance Profiling: Capture metrics such as FPS, scripting time, or layout shifts.
- Automation Integration: Tools like PyChromeDevTools (Python) or chrome-remote-interface (Node.js) allow integration into testing pipelines.
Traditional remote debugging in Chrome setups, such as USB debugging or local port-forwarding, works well for isolated devices, but it does not scale when teams need to debug multiple browsers, versions, and operating systems. Each browser has its own rendering engine, DevTools implementation, and device constraints, making single-configuration debugging unreliable for comprehensive testing.
To overcome these limitations, teams increasingly adopt cloud-based testing platforms, which provide scalable environments for remote debugging across different browsers without requiring physical device labs or complex configuration. One such platform is TestMu AI.

How to Perform Chrome Remote Debugging Across Various Browsers?
TestMu AI enables developers to perform cross-browser remote debugging through live, interactive sessions across 3,000+ browser and OS combinations. This allows you to inspect the DOM, view console logs, capture network activity, and debug rendering issues across different Chrome versions as well as other browsers like Firefox, Edge, and Safari, directly from the cloud.
Using a scalable cloud grid ensures consistent environments, faster debugging cycles, and the ability to reproduce issues across multiple browser contexts, making it a more reliable alternative to traditional single-machine debugging.
To get started with TestMu AI Chrome remote debugging, follow the steps below:
- Sign up for a free account and log in: Create a TestMu AI account and access your personal dashboard.
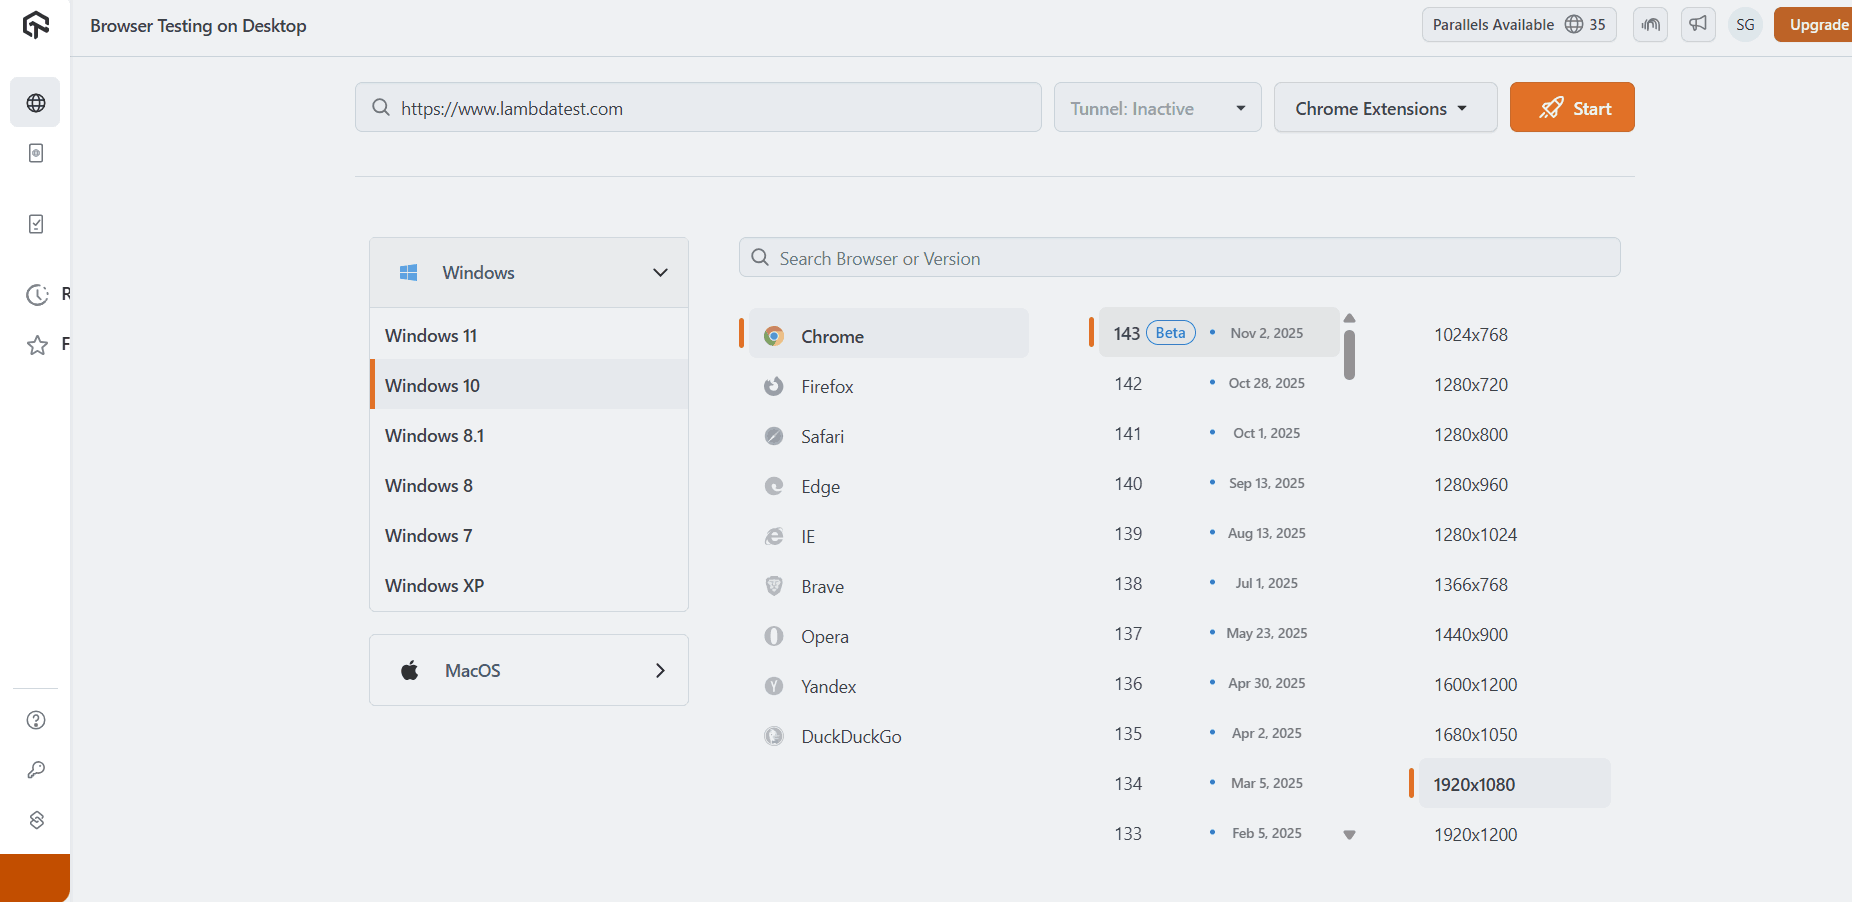
- Select Real Time > Desktop: Navigate to the Real Time testing section and enter the target web address in the address bar.
- Select the configuration and click Start: Choose the desired OS, browser, and version, then begin your real-time testing session.
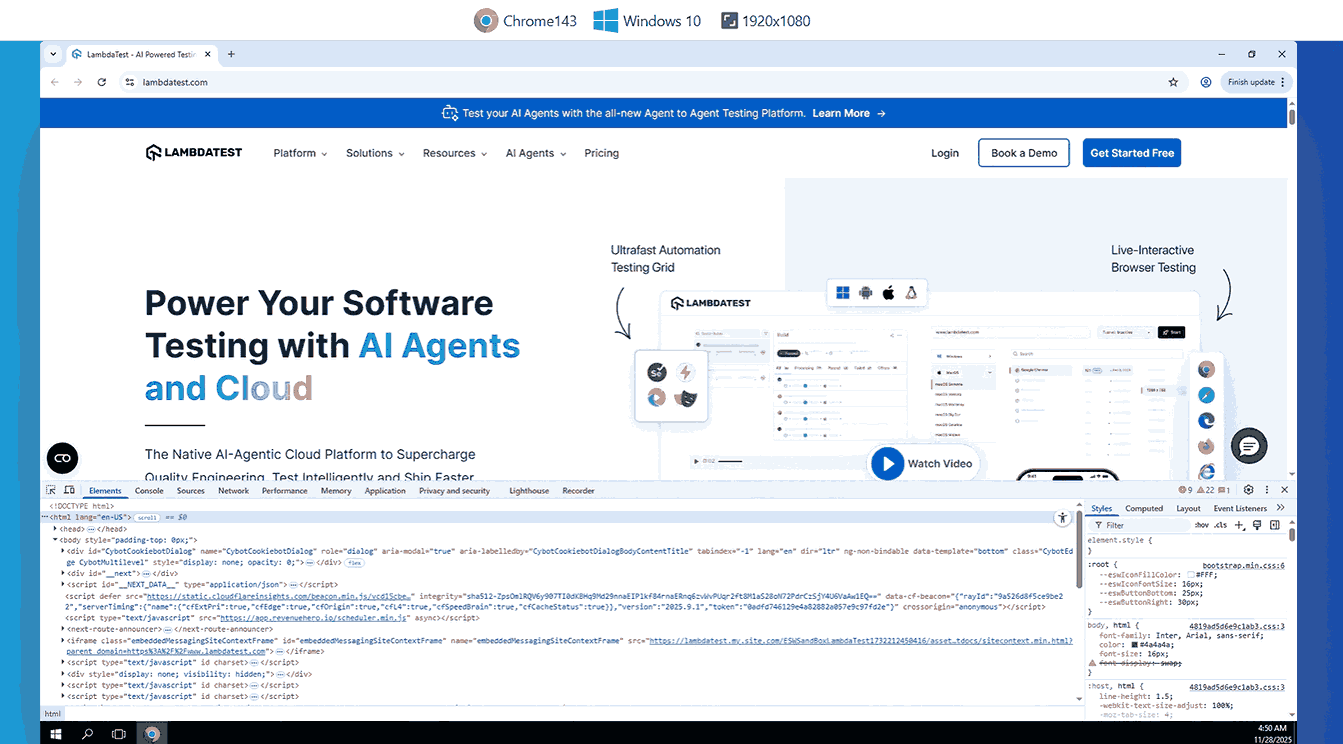
Follow this support documentation to get started with developer tools with TestMu AI.
You can also debug while performing virtual mobile testing.
- Select Real Time > Virtual Mobile (Browser Testing): Open the virtual mobile section and enter the target web address in the address bar.
- Select the Configuration and Click Start: Choose the device, OS, browser, and version to begin the virtual mobile testing session.
- Full Debugging Tools Available: The session includes specialized debugging tools, such as screenshot capturing and video recording, along with the complete Chrome DevTools interface, just like on a personal browser.
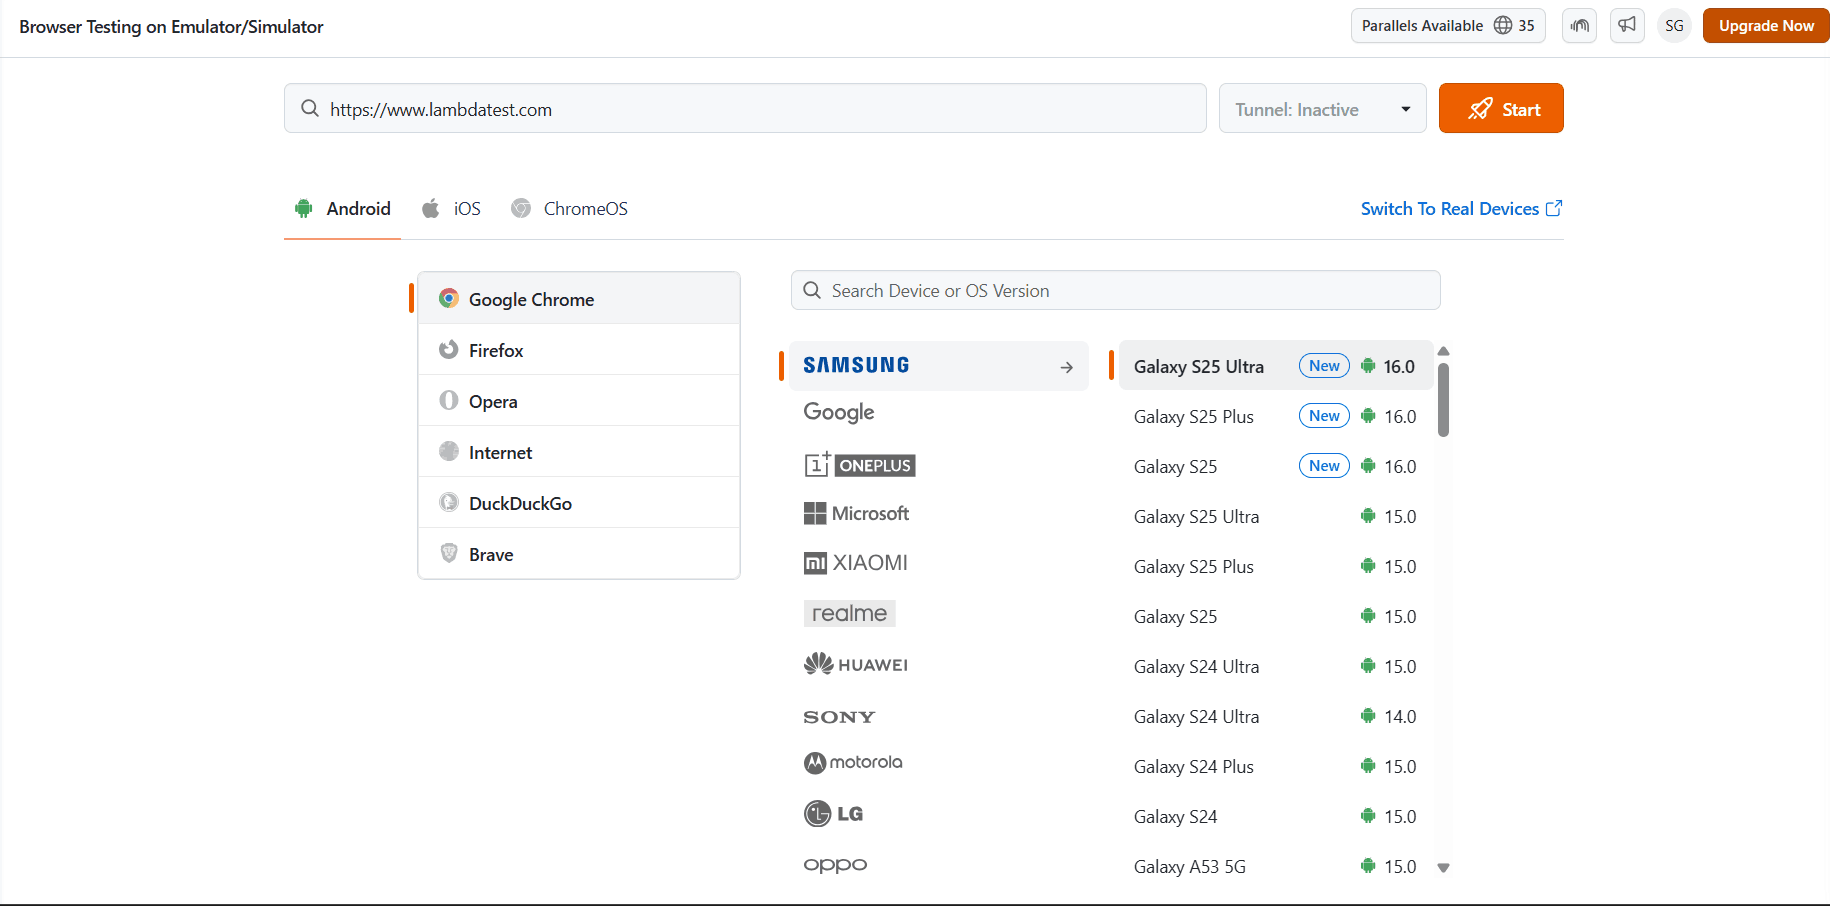
This debugging session will include specialized debugging tools (such as screenshot capturing and video recording) and the complete interface of Chrome DevTools, just like on a personal browser.
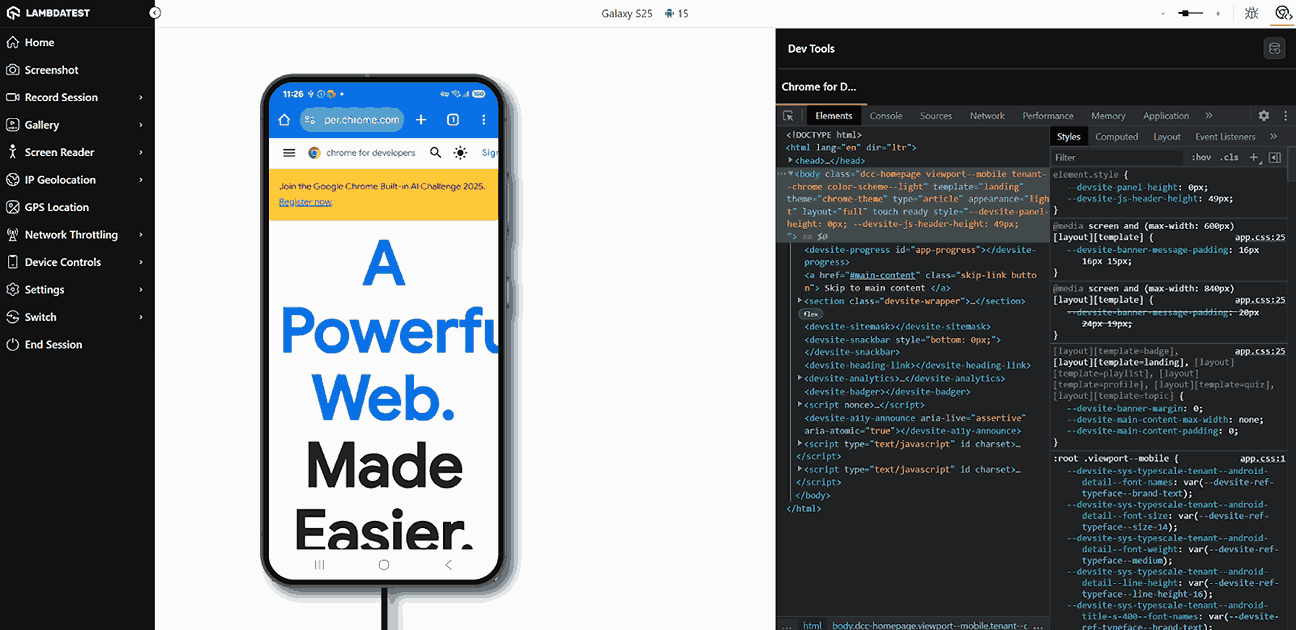
With Real Time Testing, you can inspect elements, track console logs, monitor network requests, and replicate user behavior across different browsers and OS configurations, all without maintaining physical devices or complex setups.
You can learn more about it through this guide on performing Real Time Testing with TestMu AI.
What Are the Various Elements of Chrome Remote Debugging?
Before starting the remote debugging in Chrome, it is important to get versed in the key elements of this process. These terms and process names will be referred to in further sections.
Chrome DevTools Interface and Features
Chrome Remote debugging relies primarily on Chrome DevTools to inspect and debug issues on a remote device. DevTools provide advanced tools for analyzing, inspecting, and modifying web applications.
Key panels include:
- Elements: Inspects and modifies the DOM structure, allowing developers to analyze HTML elements, adjust styles, and debug layout issues effectively.
- Console: Displays JavaScript logs and errors, enabling developers to execute commands and quickly identify runtime issues within applications.
- Performance: Captures detailed performance traces, helping developers analyze page responsiveness, interaction delays, scripting time, and rendering behavior comprehensively and accurately.
- Sources: Shows project files, enables breakpoint management, and allows step-by-step debugging to diagnose JavaScript execution flow efficiently during development.
- Application: Provides insights into storage, cache, service workers, and IndexedDB, supporting analysis of application-level states and offline capabilities thoroughly.
- Network: Monitors all network requests, helping developers inspect headers, payloads, timings, and diagnose loading issues affecting web application behavior.
- Memory: Analyzes heap snapshots and memory usage, enabling detection of leaks, excessive allocations, or inefficient object retention within applications.
- Lighthouse: Generates comprehensive audit reports covering performance, accessibility, SEO, and best practices to guide improvements across web applications effectively.
Knowing the capabilities of Chrome DevTools significantly improves the efficiency of remote debugging.
Chrome DevTools Protocol (CDP)
Chromium uses the Chrome DevTools Protocol to enable debugging and automation across all Blink-based rendering engines, including Google Chrome. CDP exposes a set of domain-specific APIs for features such as:
- Network Inspection: Provides detailed access to request and response data, enabling developers to analyze traffic flow and diagnose network-related issues efficiently.
- Memory Usage: Exposes memory metrics and heap details, helping developers detect leaks, monitor allocations, and optimize overall application memory behavior effectively.
- Console Messages: Captures console outputs and errors programmatically, allowing automated monitoring and debugging of JavaScript behavior during remote sessions.
- DOM Inspection: Allows structured access to the DOM tree, enabling developers to query, modify, and analyze page elements through protocol-driven operations.
- Performance Events: Delivers granular performance timelines, helping developers track rendering, scripting, and layout activities to optimize overall application responsiveness.
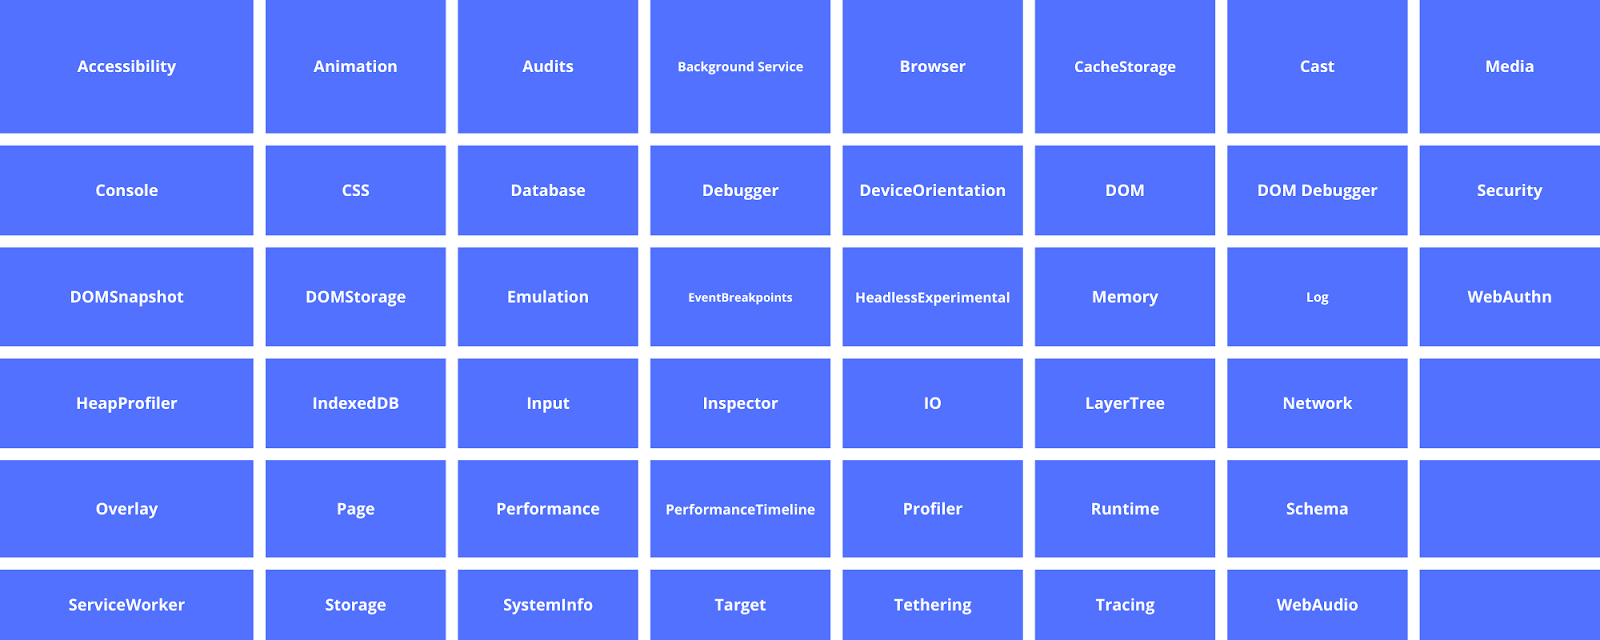
CDP is also used when interacting with Chrome in headless mode, and can be accessed through compatible libraries (e.g., PyChromeDevTools for Python).
Communication Between Devices
Certain mobile debugging features must be enabled on the Android device for remote debugging.
- Android Debug Bridge (ADB): A command-line tool used to communicate with Android devices. In remote debugging, ADB manages the USB connection, configures port forwarding, and sends debugging commands. It also supports installing Android app packages, including both traditional .apk files and modern aab file formats used for optimized app delivery.
- Port Forwarding: When debugging over USB or Wi-Fi, ADB uses TCP port forwarding. This maps a port on the host to the same port on the remote device so Chrome DevTools can communicate with the device’s WebSocket debugging endpoint.
Target Devices
A target device is the device being debugged. It may be a mobile phone, tablet, Chromebook, or any Android-based device that supports debugging and port forwarding.
One host device can connect to multiple target devices via USB or wirelessly. Knowing how to list, select, and switch between these devices is important before starting a Chrome remote debugging session.
Application Under Test (AUT)
AUT is a key element of Chrome remote debugging, as different AUTs can differ in behavior, operation, and performance, requiring developers and testers to be aware of such complications. They can vary from a mobile web app, a web app, PWAs, and hybrid applications.
Developers and testers leverage all these key elements to perform good-quality debugging sessions using Chrome remote debugging.

Troubleshooting Challenges of Chrome Remote Debugging
While remote debugging in Chrome is a straightforward process, it can become challenging in certain aspects. Knowing how to troubleshoot these challenges will help commence a debugging session quickly.
Connection Issues
The most common challenges are faced in establishing the connection between the remote and the host device. As a result, the developer might not see the device under the “Remote Target” section in chrome://inspect.
There are various ways to troubleshoot this problem:
- USB Debugging Disabled: Ensure USB debugging is enabled on the Android device to allow the host system to detect it properly.
- ADB Not Installed: Confirm ADB is installed by running adb devices. If it’s missing, install Android Platform Tools to enable proper device communication.
- Revoke Old Authorizations: Revoke USB debugging authorizations on the device to reset stale trust relationships between the device and host.
- Restart Chrome Fully: Close all Chrome processes from Task Manager to fix issues caused by hidden or stuck browser instances.
- Outdated USB Drivers: Update USB drivers on the host system to eliminate detection issues caused by incompatible or missing drivers.
- Missing Permission Prompt: Reconnect the USB cable if the “Allow USB Debugging” prompt was dismissed or did not appear.
Port Forwarding Issues
Sometimes, the devices are not detected due to problems in port forwarding.
One can troubleshoot this with various methods:
- Port Forwarding Not Enabled: Ensure “Enable Port Forwarding” is checked under chrome://inspect > Configure.
- Incorrect Port Number: Verify that the same port is configured in chrome://inspect and used in the --remote-debugging-port command.
- Firewall Blocking Ports: Check if the firewall is blocking the configured debugging port and allow it if necessary.
- Port Conflict Persists: Change the debugging port if the current port is already occupied by another application.
Empty Web Page Post Inspect
An empty web page may be seen sometimes, even if the device is visible in the “Remote Target” section along with the open tabs.
While facing this challenge, troubleshoot it with the following methods:
- Permission Restrictions: Ensure required permissions are granted on the remote device to display content correctly through DevTools.
- WebView Not Initialized: Verify that WebView is enabled and properly loaded when debugging content inside an Android WebView.
Network-Related Issues
Network-related issues may appear if the host and remote device do not know where to connect. These are easier to troubleshoot with the following methods:
- Devices Not on the Same Network: Confirm both host and remote devices are connected to the same network before attempting discovery.
- IP Mismatch in Subnet: Ensure both devices are on the same subnet and assigned IP addresses from the same router.
- VPN Interference: Disable VPN services that may override routes or prevent device discovery across the network.
- Missing Debugging Flag: Verify that the Chrome instance was launched with the correct --remote-debugging-port flag.
DevTools Issues
One of the common challenges users face while working with remote debugging in Chrome is that the Chrome DevTools does not load or attach to the remote device. One may see a blank screen in this case.
Try the following solutions in this case:
- Cached DevTools Data: Clear cache and cookies on the host device to resolve DevTools loading or blank-screen issues.
- Session Not Refreshed: Disconnect and reconnect the remote device to re-establish a fresh debugging session.
- Extensions Interfering: Disable extensions on the host device that may interfere with Chrome DevTools operations.
- Use Incognito Mode: Open DevTools in incognito mode to avoid conflicts caused by extension scripts or cached files.
Performance Issues
Issues about high lag or resource not loading on the screen can be categorized as performance-based challenges in remote debugging in Chrome.
These can be resolved as follows:
- Low Network Bandwidth: Ensure sufficient network bandwidth is available for stable remote debugging communication.
- Heavy Chrome Workload: Close additional Chrome instances consuming resources and causing lag during debugging.
- Outdated Chrome Version: Update Chrome to the latest version on both devices to prevent compatibility mismatches.
Developers face these challenges commonly in their remote debugging sessions. The troubleshooting methods defined here will suffice to counter them at any level of testing.
Best Practices of Chrome Remote Debugging
Follow these simple practices to minimize the issues and achieve maximum efficiency.
- Keep Tools Updated: Always keep all the tools being used updated to their latest versions. Frequent updates can prevent version-based issues during remote debugging.
- Use Secure Connections: Opt for secure connections through VPN, SSH tunnels, or direct SSH to close all network-related vulnerabilities.
- Use Cloud-Based Tools: Cloud-based platforms like TestMu AI provide real devices and advanced debugging tools, reducing cost and effort for the team.
- Follow Pre-Planned Standards: Use defined port ranges and network standards to avoid cross-connections when multiple remote devices are connected for wireless debugging.
- Document Everything: Record all configurations, settings, and procedures to help team members and new joiners conduct remote debugging smoothly.
- Use Network Throttling: Simulate varying network conditions to identify and troubleshoot bandwidth-related issues.
- Report All Bugs: Report bugs to the Chromium project, contributing to the open-source community and improving the software for everyone.
These practices not only help the developers in the debugging sessions but also make us good developers and testers.
Conclusion
Chrome introduced remote debugging to solve the big problem of debugging mobile web issues, as mobile devices did not come with their own web inspector. Today, it remains one of the most critical aspects of web development and testing cycles owing to the ease with which one can test remote app installations.
However, one has to deal with a little complex setup and go through multiple switches across devices, along with the purchase of physical devices, making this option impractical as of today’s standards. TestMu AI resolves all the current problems in remote debugging and streamlines the process by providing infrastructure, tools, and most of all, the devices to the users free of cost. Whatever way a developer chooses, mastering remote debugging in Chrome will provide an advantage and uplift the application quality to higher standards.
Citations
- Remote Debugging on Android with Chrome: https://developer.chrome.com/docs/devtools/remote-debugging/
- Chrome DevTools Protocol: https://chromedevtools.github.io/devtools-protocol/
- Android Debug Bridge (adb): https://developer.android.com/tools/adb
- Access Local Servers and Chrome Instances With Port Forwarding: https://developer.chrome.com/docs/devtools/remote-debugging/local-server
Author

Harish Rajora
Blogs: 100


Harish Rajora is a software developer at TestMu AI with over 6 years of hands-on experience in Python and cross-platform application development across Windows, macOS, and Linux. He has authored 800+ technical articles and worked on large-scale projects, including GenAI applications and core engineering features used by millions. Harish has led DevOps initiatives building CI/CD pipelines with Jenkins, AWS, GitLab, and GitHub, and holds an M.Tech in Software Engineering from IIIT Allahabad.
Reviewer

Japneet Singh Chawla
Reviewer
Japneet Singh Chawla is an Engineering Manager at TestMu AI (formerly LambdaTest), where he leads a team driving HyperExecute, the AI-native Test Orchestration Cloud Platform, and integrations with Cypress, Provar, Tosca, and Selenium, improving test execution efficiency and driving adoption across 500+ enterprise clients. He also spearheaded zero-downtime deployments that cut release-related downtime by 90%, and mentors new engineers into productive contributors. He brings 9+ years of experience building and scaling distributed systems, SaaS platforms, and developer tools, with deep hands-on backend engineering across Golang, Python, Node.js, Kafka, and Redis. Earlier at Sumo Logic he built award-winning developer tools, including a VS Code Parser Linter, and at Indus Valley Partners he was a founding member of the Sentiment Analyzer team, building ML-powered solutions for financial clients. Japneet holds an MCA in Computer Science from GGSIPU.


Chrome Remote Debugging FAQs
Did you find this page helpful?
More Related Learning Hubs
TestMu AI forEnterprise
Get access to solutions built on Enterprise
grade security, privacy, & compliance
- Advanced access controls
- Advanced data retention rules
- Advanced Local Testing
- Premium Support options
- Early access to beta features
- Private Slack Channel
- Unlimited Manual Accessibility DevTools Tests