

Power Your Software Testing with AI Agents and Cloud
The Native AI-Agentic Cloud Platform to Supercharge Quality Engineering. Test Intelligently and Ship Faster.


- TestMu AI (Formerly LambdaTest)
- /
- Blog
- /
- How to Use Breakpoints for Debugging in Selenium WebDriver
How to Use Breakpoints for Debugging in Selenium WebDriver
In this blog, learn how to use breakpoints to perform debugging in Selenium WebDriver.
Last Updated on:
On This Page
- What Is Debugging?
- Debugging Techniques in Selenium WebDriver
- What are Breakpoints in Selenium WebDriver?
- Debugging in Selenium WebDriver With Eclipse
- Debugging in Selenium WebDriver With IntelliJ
- Debugging in Selenium WebDriver on the Cloud
- AI Agents in Debugging
- Best Practices for Debugging in Test Automation
A breakpoint in Selenium WebDriver is a marker you set on a line of code, using Eclipse, IntelliJ, or the cloud, that pauses test execution so you can inspect why a step failed.
This works because the debugger halts precisely at that line, exposing live variable values and the call stack instead of a bare stack trace after the run finishes.
This guide covers debugging techniques in Selenium WebDriver, adding breakpoints in Eclipse and IntelliJ, debugging on the cloud, and how AI agents now speed up the process.
Key Takeaways
- A breakpoint is a marker set on a line of code that pauses Selenium WebDriver test execution for inspection.
- Eclipse and IntelliJ both let a tester toggle a breakpoint from the editor margin or the Run menu, then step through the code line by line.
- Logging frameworks such as Log4j2 and failure screenshots give a permanent record of a run, unlike a breakpoint that only helps during a live debugging session.
- AI-driven testing agents can suggest a likely root cause from a stack trace before a tester sets a single breakpoint.
- Recording a test execution session helps find the exact failing step without keeping a UI open during a full CI/CD run.
- Jumping straight to the failing breakpoint saves time compared to stepping through every line of a long automation script.
What Is Debugging?
Debugging is a process that involves a deep inspection of the source code. For example, the code execution failed, or there is a need to take a deep dive into the framework code to understand execution steps in a much better way.
In the first stage of debugging, we have to identify and understand the issue or failure in the code. This would help us perform root cause analysis, which is one of the key skills of a tester or developer. If one has identified the issue and understood its root cause, it would be easier to develop an approach to resolve the issue.
Now comes the second stage, where we have to isolate the portion of the code on which debugging has to be performed. However, debugging every line of code is only necessary if required. Therefore, we have to separate the faulty code into smaller chunks and perform debugging.
Then, by understanding the cause of the failure, a fix can be provided to the buggy code, which can be finally reviewed and merged.
Debugging Techniques in Selenium WebDriver
The following are some of the important techniques of debugging in Selenium WebDriver that can be used to debug the test scripts. If you are a novice in Selenium WebDriver, please refer to our detailed tutorial to understand what is Selenium WebDriver.
Adding Breakpoints
IDEs such as IntelliJ and Eclipse have built-in code debugging utilities. Breakpoints are one such utility that helps stop code execution. The tester needs to add a breakpoint on the respective line of code where he wants to stop the execution for further code analysis. Debugging with breakpoints helps the automation testers to fix the issue in interactive mode.
The following steps can be handy to add a breakpoint to the code:
- Set up the breakpoints on the line of the code where troubleshooting is required.
- Run the code in debug mode.
- Analyze the data in the debugger window.
- Step in/over the code in case a deep analysis of the root cause is needed.
- In case multiple breakpoints are added in the code, the option is available to resume the debugging.
- When the issue is found, stop the execution of the code in debug mode.
- Fix the error, review the code, and deploy.
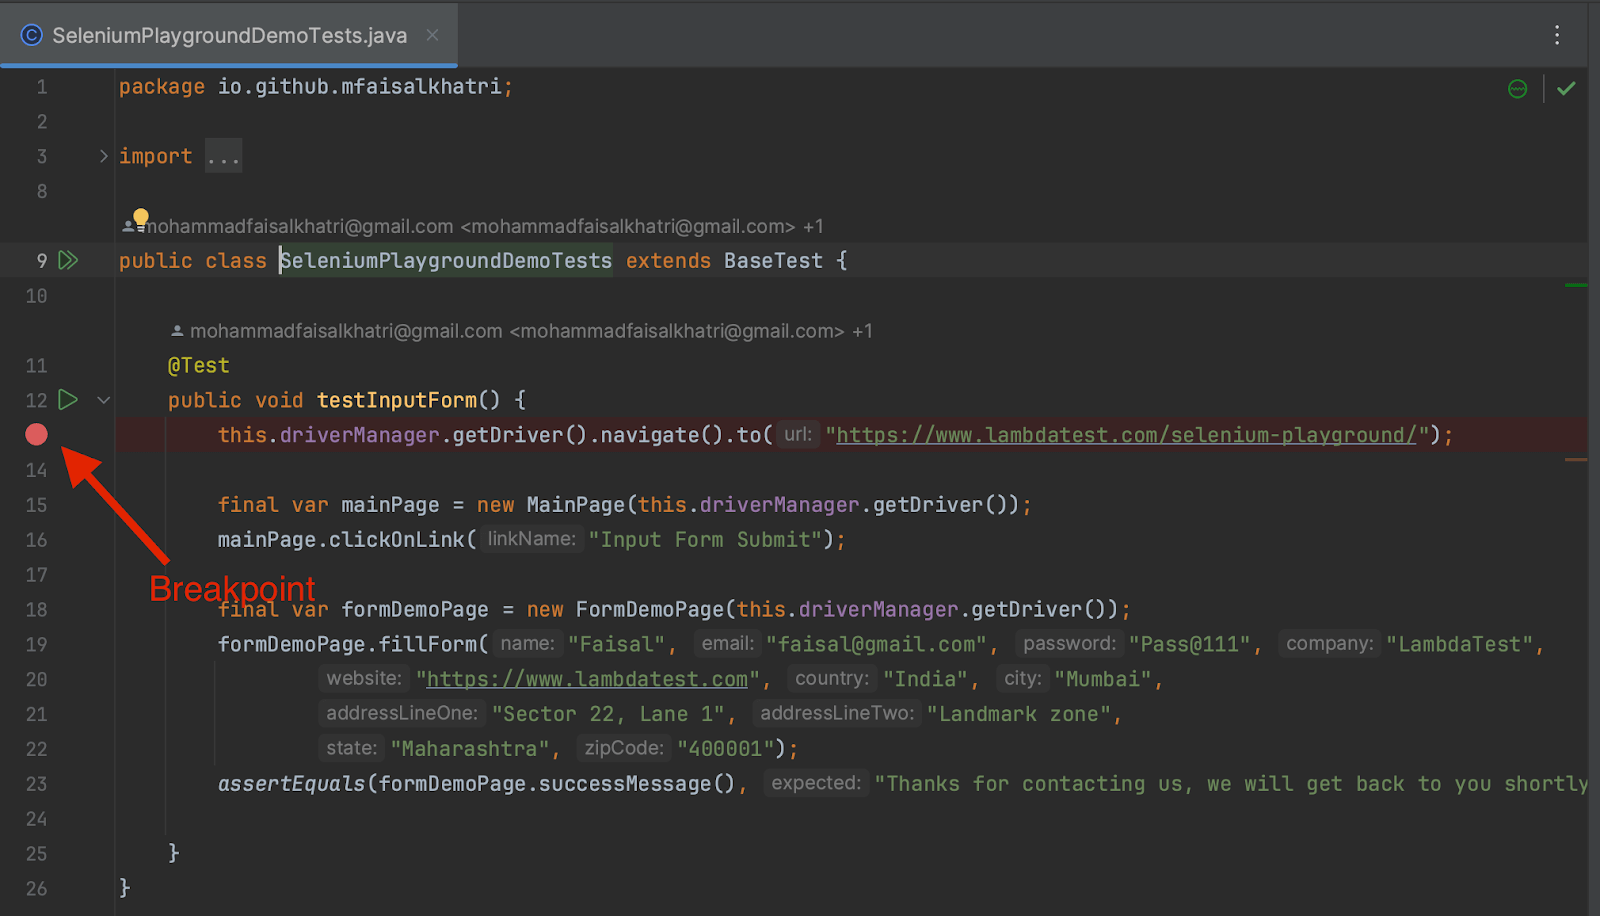
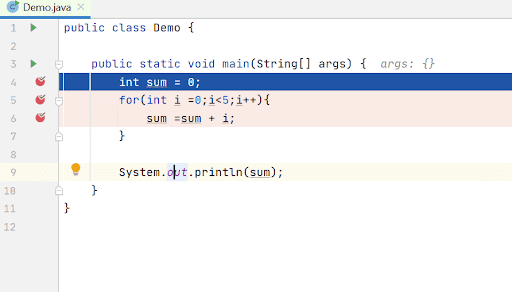
The following image shows the breakpoint in IntelliJ:
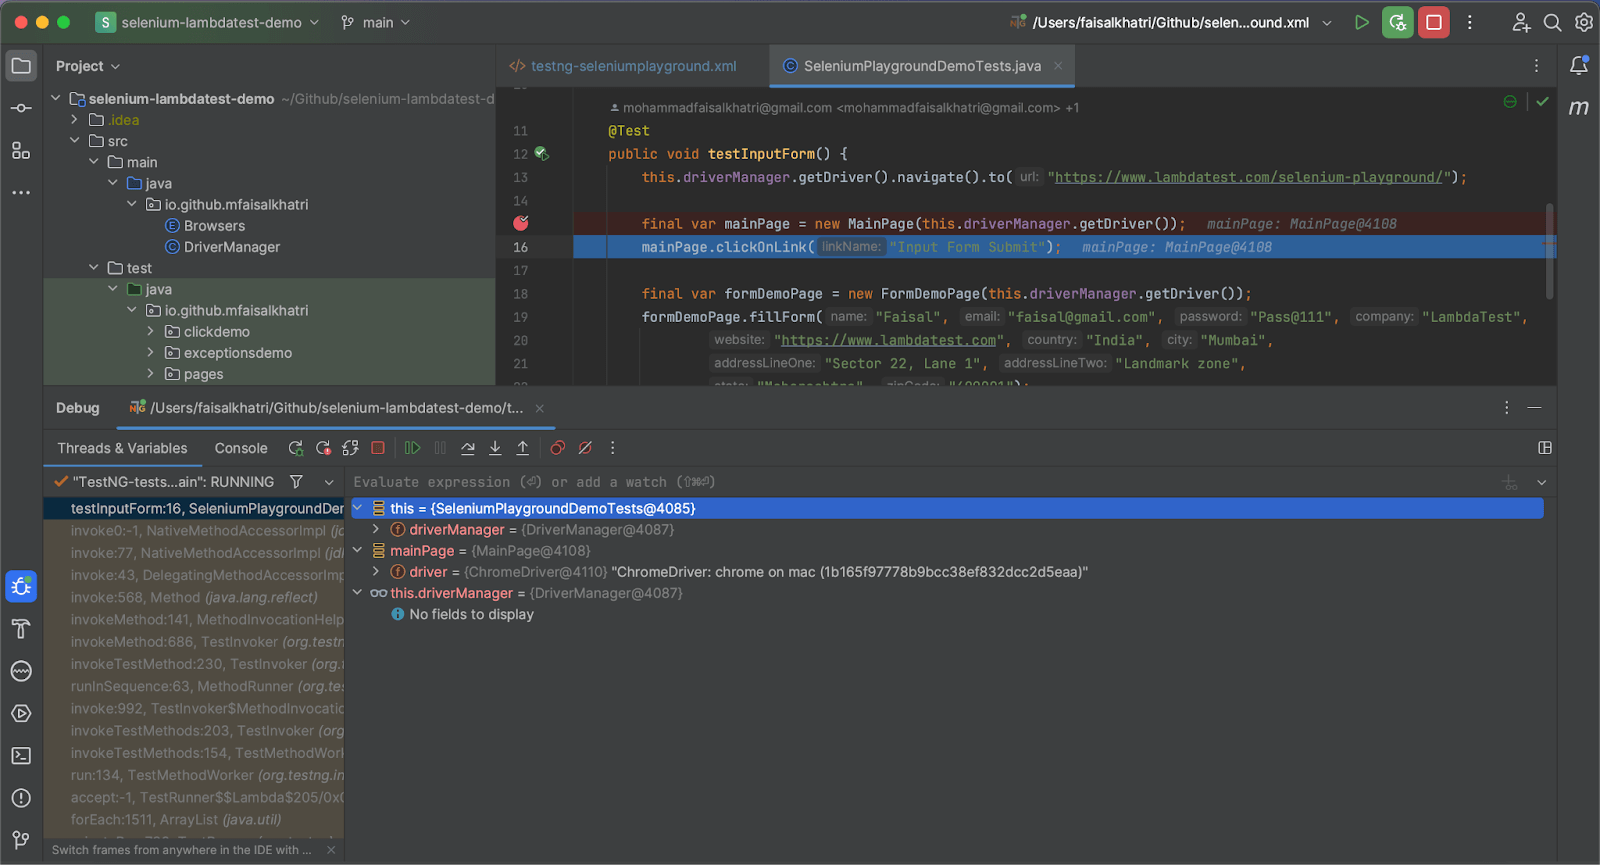
The following is the screenshot of the code execution in debugging mode.
Logging Utilities
Logging is a powerful technique for debugging. Logs capture the important data that can be used for further analysis and help troubleshoot and fix the issue in the code. It can be written and displayed on the console or in the file. It is often chosen to write the logs in the file as it comes in handy while checking the test failures and can be referred to as the root cause of the failures.
The following three steps can help in enabling logging in the code:
- Addition of the required libraries.
- Configuring the loggers.
- Adding the log statements in the appropriate lines of code.
Let’s consider the example of the Log4J2 logging framework that can be used to enable logging in the project. The following five types of severity log levels can be used in the code for logging purposes:
- DEBUG
- INFO
- WARN
- ERROR
- FATAL
These severity log levels need to be supplied in the log statements to log the details of the code execution. The following screenshot shows the log statements placed in the code.
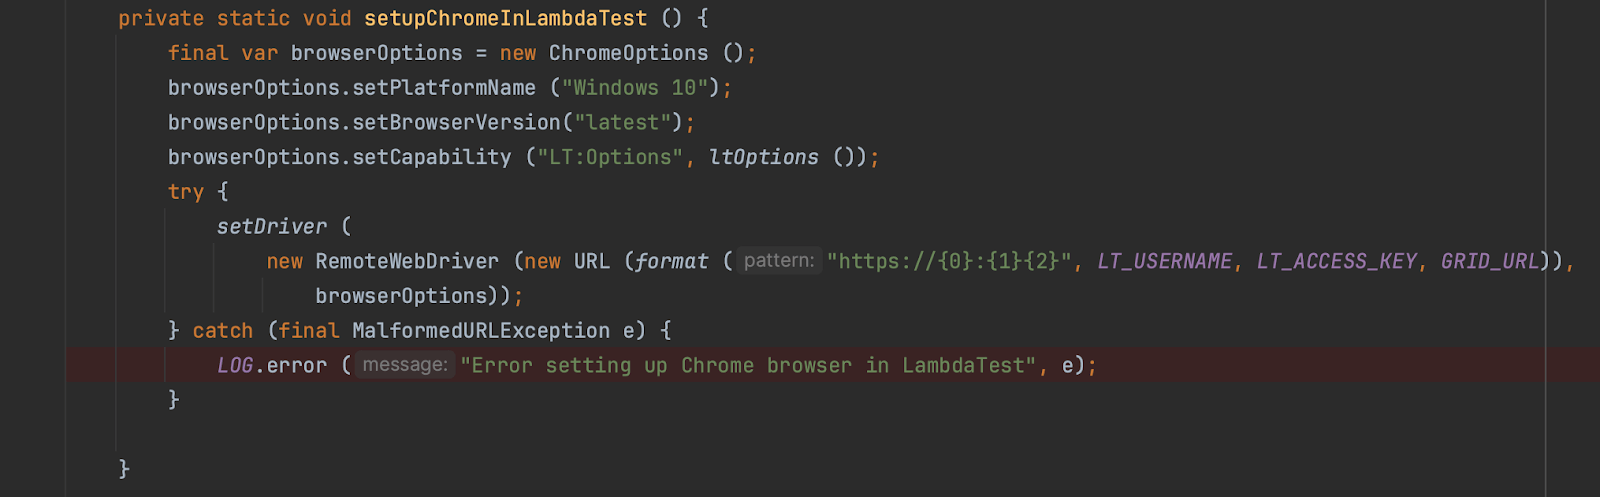
The above code will log the error details in the console when the program fails to create the Chrome driver instance.

Note: Debug Your Selenium Scripts Across 3000+ Real Browsers. Try TestMu AI Now!
Adding the capability to capture screenshots of test failures gives an added advantage for analyzing the root cause of the test failure. Typically, all the automated tests are executed using the CI/CD pipelines, and the test execution is triggered as soon as someone commits a code to the repository.
The test execution is then monitored over the pipeline by checking the logs or monitoring the red/green status. The UI usually is not available to check the current test execution. Running the tests in headless mode also has other advantages, such as fast execution, as UI is not involved.
For instance, taking screenshots in Selenium can be beneficial in case any tests fail. Selenium WebDriver provides the interface TakesScreenshot that could be utilized to capture screenshots of the web pages. The idea of capturing a screenshot helps the automation engineer identify where the test failed, whether the web page was loaded or not, or if the error is related to a particular WebElement. Is that WebElement available on the web page at the time of failure?

For more such videos, subscribe to the TestMu AI YouTube Channel for quick updates on the tutorials on Selenium testing and more.
Recording Test Sessions
Recording the test execution session is another technique that could be used for debugging test automation scripts. Consider that 50+ web automation tests are running using Selenium WebDriver, which are part of the end-to-end testing journeys of the website under test. As it would take a good amount of time to execute these tests, it would be difficult and tiring to sit back and check out every test executed and monitor the failed test cases.
In such situations, recording the test execution session can come in handy to analyze the failing test cases, which will provide insight into which step the test failed. This will help the test team further dive and find the root cause of the issue.
Selenium WebDriver does not provide direct support for recording test sessions. However, libraries like Monte Media could be integrated with the project to record the session.
Another way is to use the cloud platforms to execute the automated tests across various web browsers online. These platforms record every test execution session when required desired capabilities are supplied in the test scripts. The video recording of the tests can then be viewed on the dashboard or the build details window.
Using Print Statements
Print statements such as System.out.println() in Java can also be used as an alternative to logging while debugging. This helps the debugger know that the code was executed on the respective line of code where the breakpoint was added.
Likewise, the print statements can be used to print the value of the variable at run time during code execution, thus helping the automation test engineer analyze the code quickly.
There are multiple ways to debug the code: having a code walkthrough, getting peer support, refactoring and restructuring, etc. Debugging is often considered the easiest and most efficient way to debug the issue in the code. Several IDEs for web development provide the option of running the code and inserting breakpoints to debug the source code.
You can also enhance your debugging in Selenium WebDriver with AI-driven testing assistants like KaneAI.
KaneAI by TestMu AI is a GenAI native testing agent that streamlines test creation, debugging, and refinement through natural language. Easily integrate it into your workflow for quicker, smarter test execution, and take your quality engineering to the next level with ease using KaneAI!

What are Breakpoints in Selenium WebDriver?
The breakpoints in Selenium lets you temporarily pause (or stop) the execution of the code. A breakpoint is added before a single or multiple lines in the code. By setting or inserting a breakpoint, the code will be executed up to the breakpoint, and the execution will halt once the breakpoint is encountered.
When the test script reaches the breakpoint, it enters the debugging mode, allowing the developer to inspect the minute details of the code and step deeper into the code to debug and troubleshoot the issue.
When debugging in Selenium WebDriver, breakpoints should be inserted at appropriate places to check the required variable values (and other details) in detail. Whether using the Eclipse IDE or IntelliJ IDE, breakpoints are shown alongside the UI.
Debugging in Selenium WebDriver With Eclipse
Let’s see how to insert a breakpoint in Eclipse IDE for debugging in Selenium WebDriver.
- Perform a right-click in the left side margin and click the Toggle Breakpoint option.
- Move to the line where you need to insert the breakpoint, click the Run menu, and click the Toggle Breakpoint option.
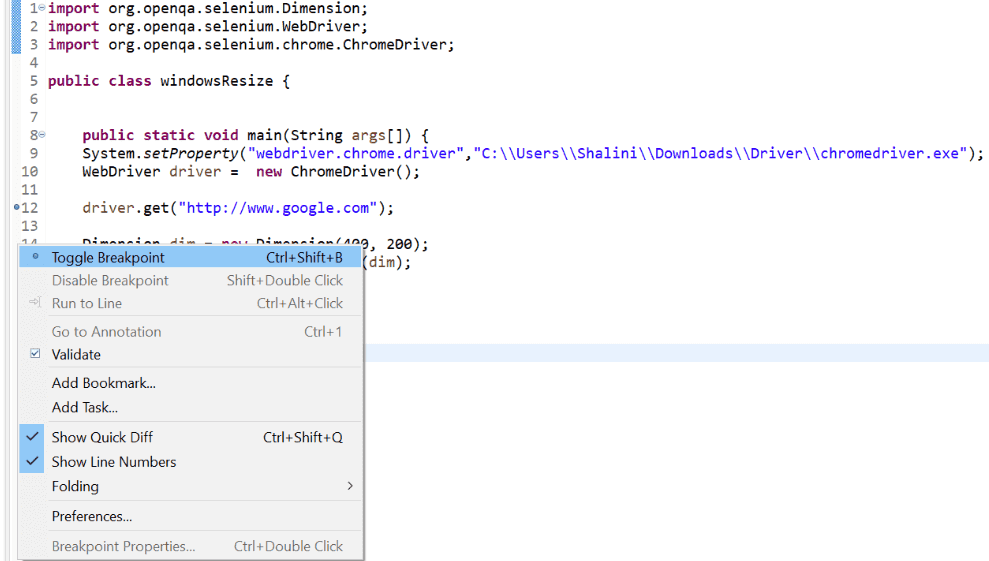
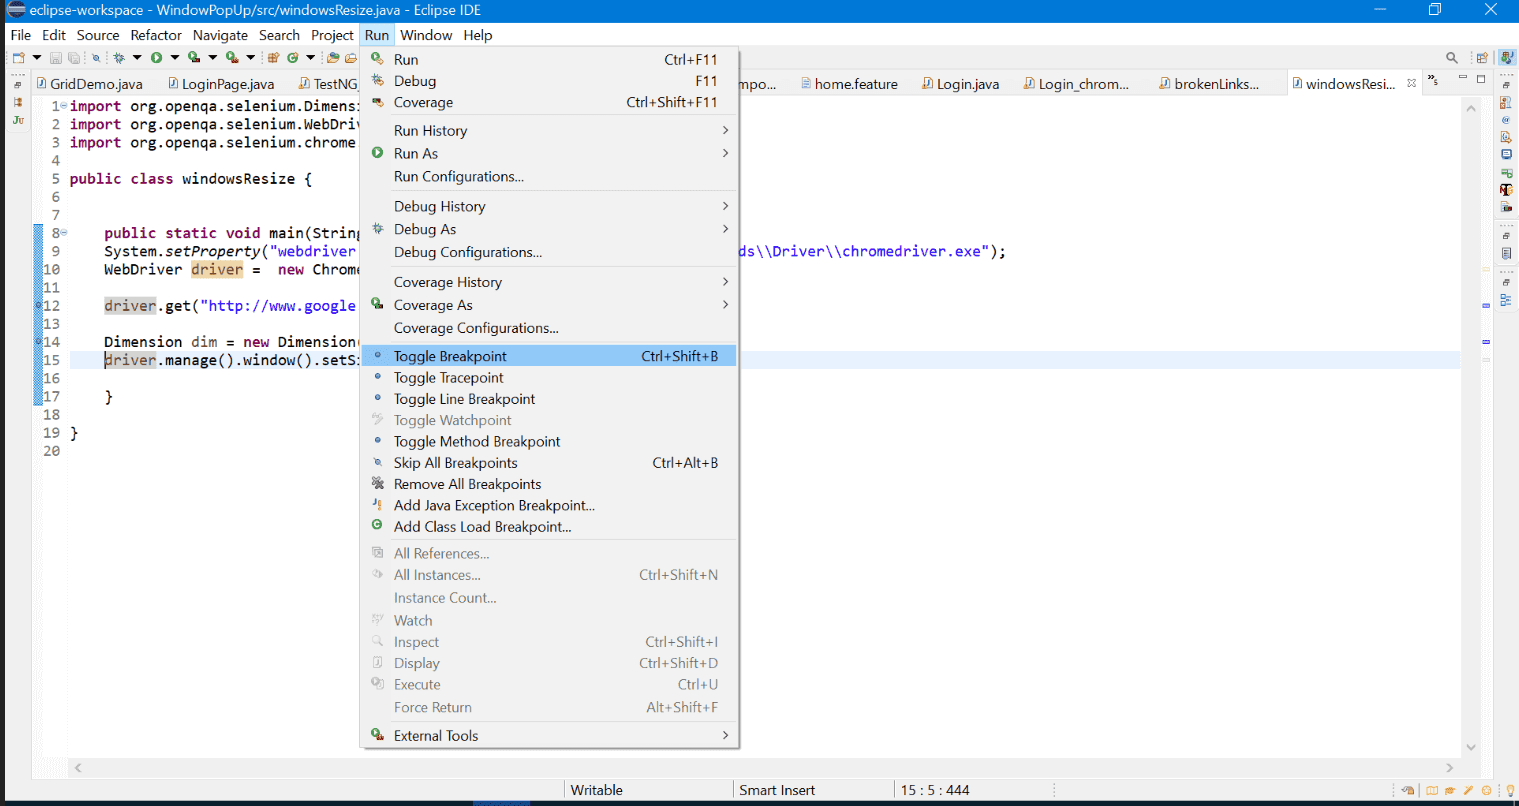
This way, you can add multiple breakpoints in your code. Once the breakpoint is added, you will see a blue circle on the left margin where you tried to insert the breakpoint.
Now that the breakpoint is added to the source code, it’s time to debug the issue.
Before running the code, we have to switch to the Debug perspective. To do this, navigate to the Windows menu → Perspective → Open Perspective.
Here, choose the Debug option.
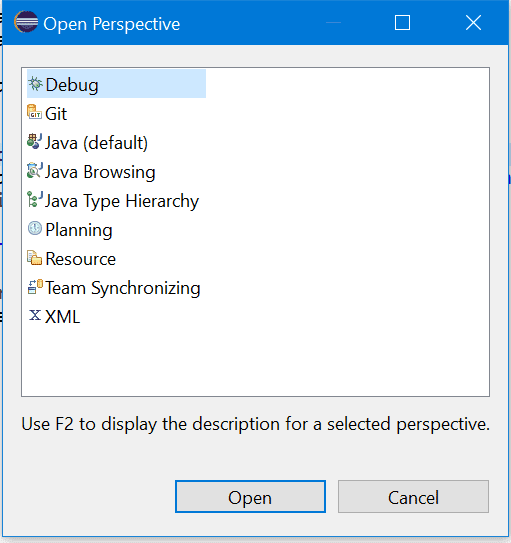
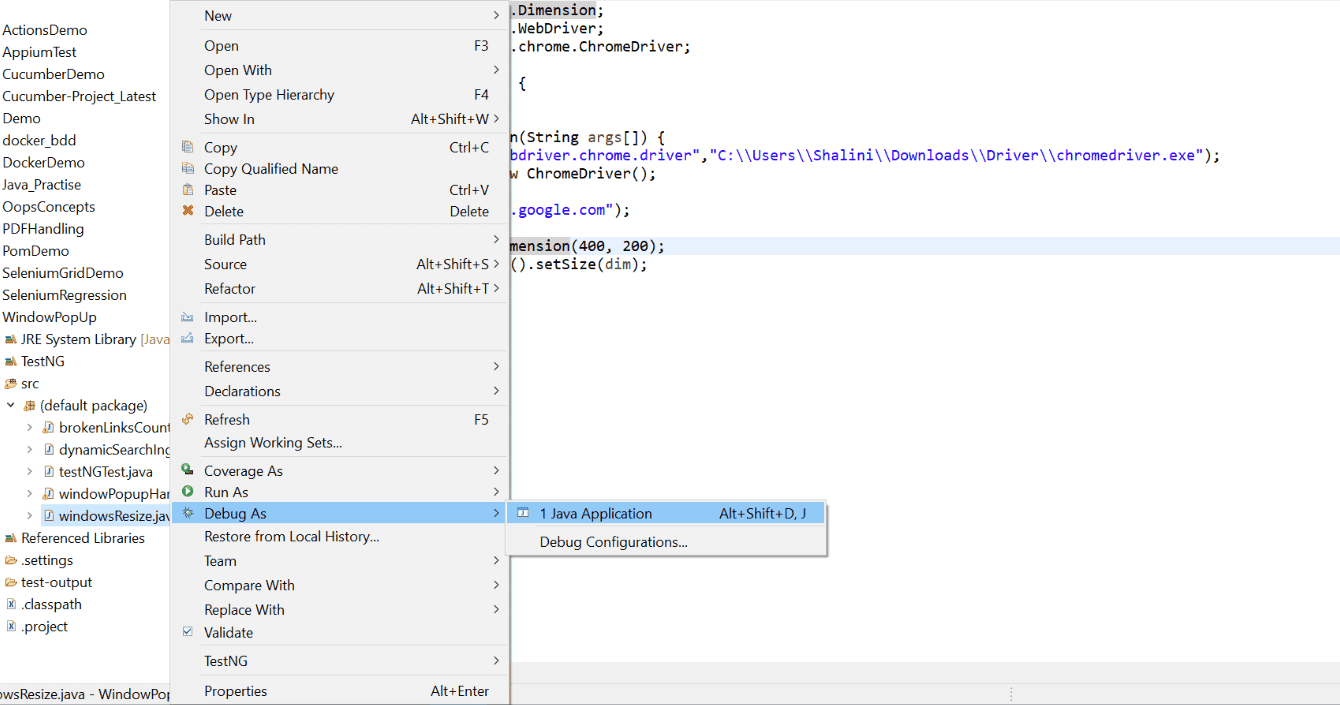
To run the code, select the Java class, which has to run in debug mode. Next, right-click on the class, move to Debug As an option, and click Java Application.
If you haven’t switched to the Debug perspective view before running the code, you will get a switch notification prompting you to switch to the Debug perspective before running the code. Click Switch.
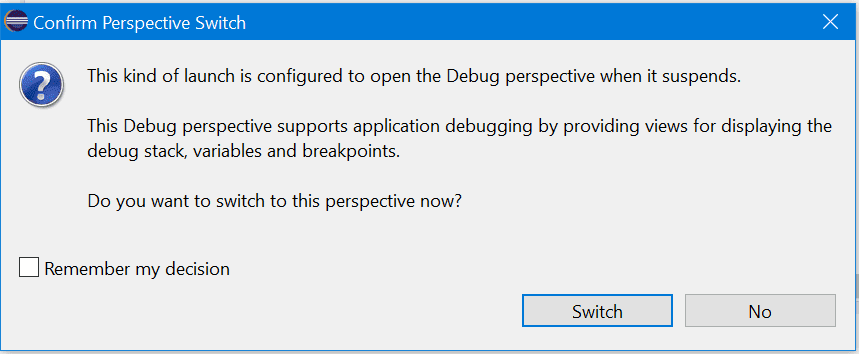
Now, the code starts running in debug mode.
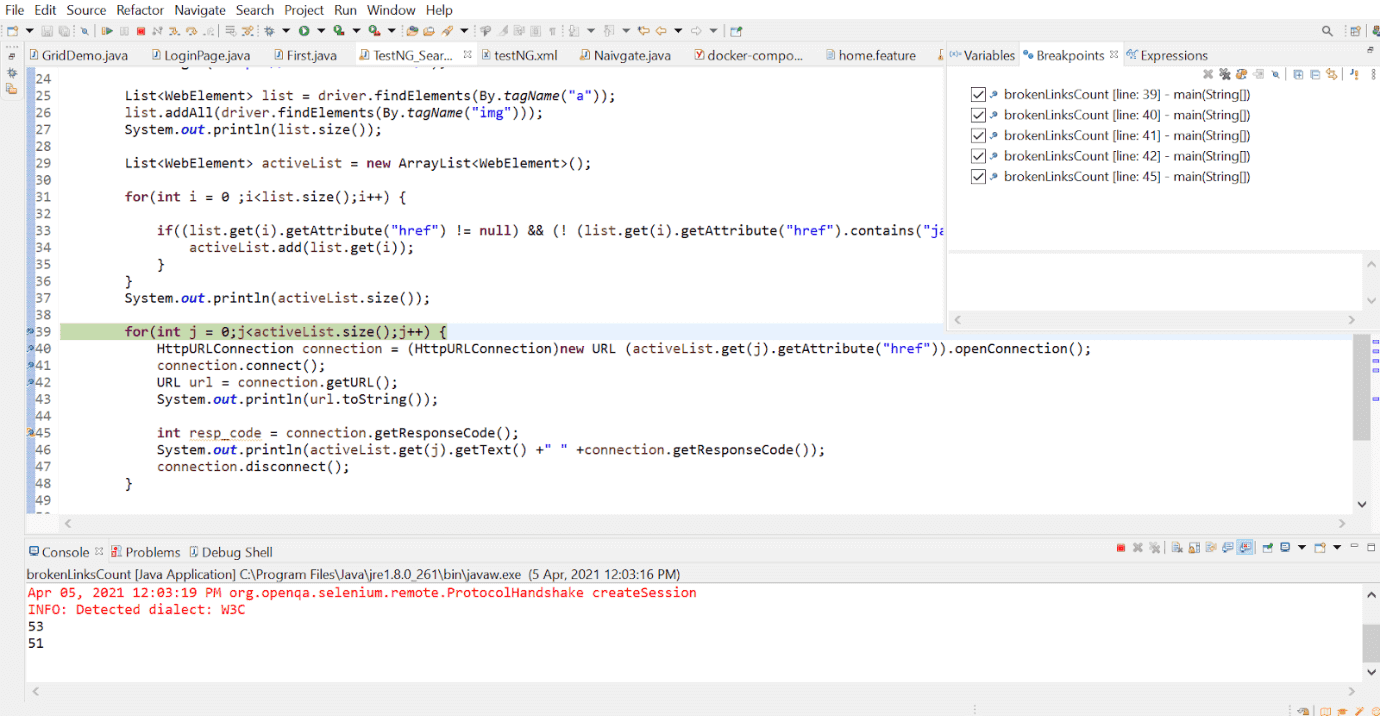
The code will be executed and stop when it reaches the line where the breakpoint has been added. For example, in my code, I have added breakpoints in lines 39, 40, 41, 42, and 45. So, while running the code, the execution stops at line 39, as it is the first breakpoint in the code, and then moves ahead one by one.
When the breakpoint has been reached, it will be highlighted, as shown in the below screenshot.
Once the execution starts, you can see a window that shows the variables, Breakpoints, and Expressions tab.
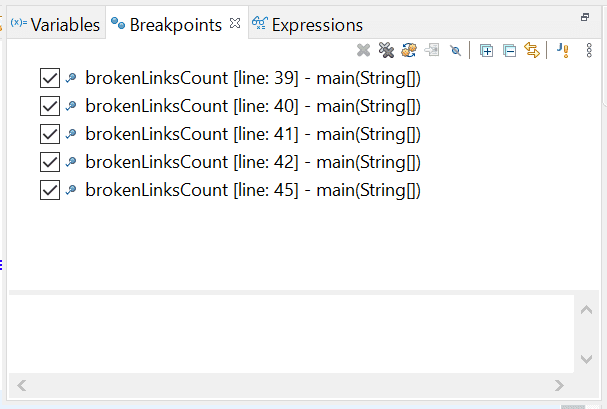
The Breakpoints tab shows the lines in which the breakpoint has been added. For example, this shows that the breakpoint has been added in lines 39, 40, 41, 42, and 45 in the Java class brokenLinksCount.
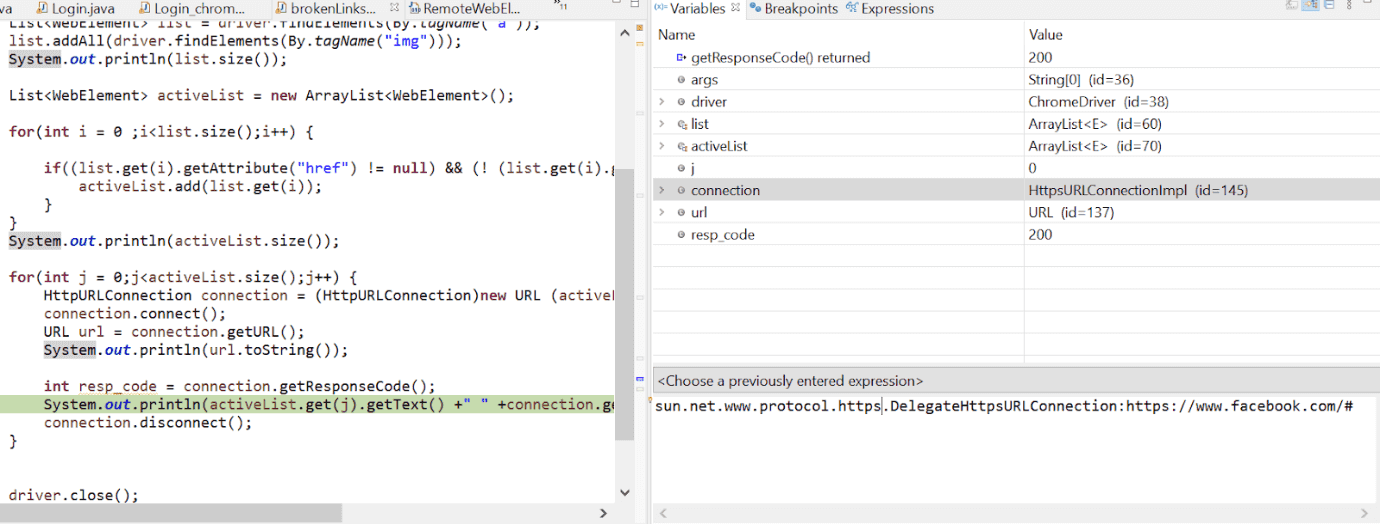
The Variables tab shows the values being assigned to the variables in the line where the breakpoint has been added.
To control the execution, we have various shortcut keys in the editor. You can see them under the Run menu.
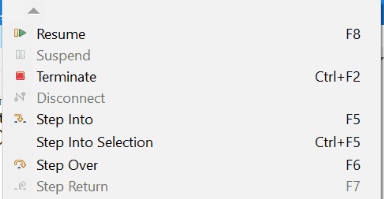
You can also view them in the submenu bar.

Let us understand their usage:
- Step Into (F5): The line where the breakpoint has been added will be executed, followed by the next lines. For example, if the breakpoint has been added to a method, the control reaches inside the method and debugs the code written within that method.
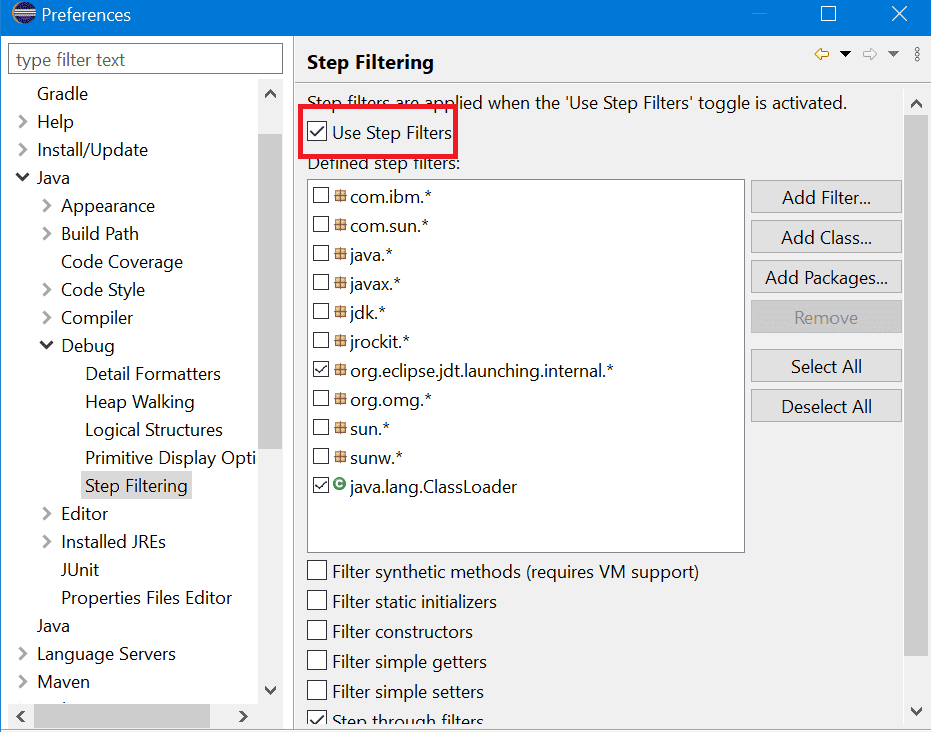
Sometimes, the control might reach deep into the libraries and JDK classes, which could be skipped by checking the Use Step Filters option.
- Step Over (F6): When the control reaches the method where the breakpoint has been added, it steps to the next line after the method without getting into the method.
- Step Return (F7): The control returns to the caller of the method once the breakpoint inserted in the method is executed.
- Resume (F8): The code is executed until the control reaches the next breakpoint.
- Terminate (Ctrl+F2): This is used to terminate the debugging or execution of the code forcibly.
- Skip All Breakpoints (Ctrl+Alt+B): This is used to skip all the breakpoints inserted in the code.
Debugging in Selenium WebDriver With IntelliJ
Let’s see how to insert a breakpoint in IntelliJ IDE for debugging in Selenium WebDriver.
- Move to the line in which the breakpoint has to be added. Then, navigate to the Run → Toggle Breakpoint → click Line Breakpoint.
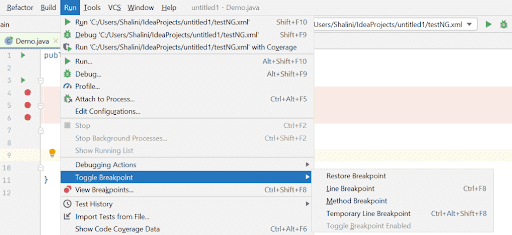
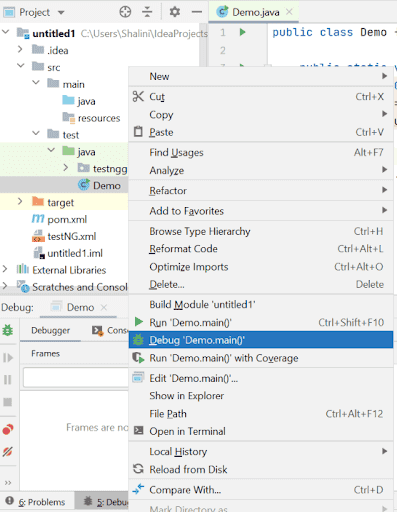
Similarly, you can add a method breakpoint to debug the methods in the framework. To debug the code, right-click on the class and select Debug.
 You can also run in the debug mode by clicking the Debug option under the Run menu.
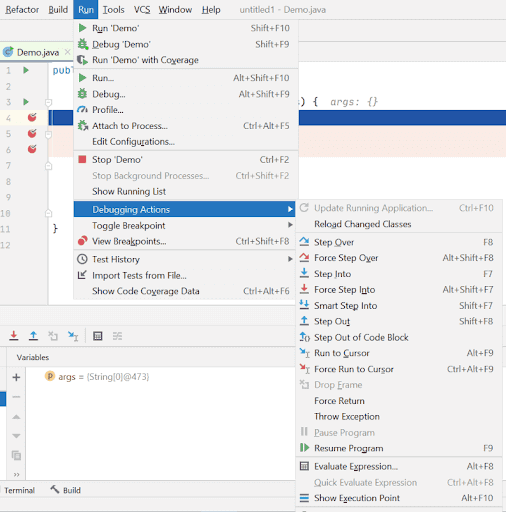
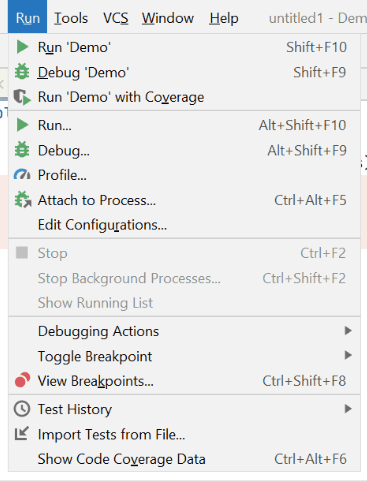 After clicking the Debug option, you will see various options to control the execution under the Run menu.
 Once it reaches the breakpoints and executes the code, you can see tick marks on the breakpoints.
 To terminate the Debug mode, click the red square icon or the Stop option under the Run menu.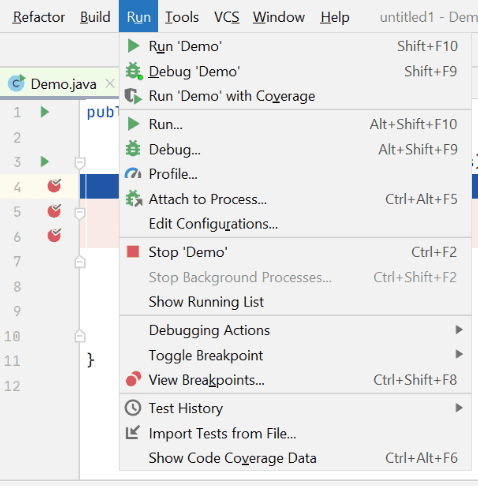
Debugging in Selenium WebDriver on the Cloud
- Navigate to the TestMu AI eCommerce Playground.
- Click on the Shop by Category menu.
- Check all the broken links in the Shop by Category menu.
- Use breakpoints to debug the test scripts and find the broken links.
public class SeleniumECommerceTests{

   private RemoteWebDriver driver;
   // ...

}
public ChromeOptions getChromeOptions() {
   final var browserOptions = new ChromeOptions();
   browserOptions.setPlatformName("Windows 10");
   browserOptions.setBrowserVersion("124");
   final HashMap<String, Object> ltOptions = new HashMap<String, Object>();
   ltOptions.put("project", "Selenium ECommerce playground website");
   ltOptions.put("build", "LambdaTest Ecommerce Website tests");
   ltOptions.put("name", "Test broken links on LambdaTest ECommerce playground website");
   ltOptions.put("w3c", true);
   ltOptions.put("visual", true);
   ltOptions.put("w3c", true);
   ltOptions.put("plugin", "java-testNG");

   browserOptions.setCapability("LT:Options", ltOptions);

   return browserOptions;
}
@BeforeTest
public void setup() {
   final String userName = System.getenv("LT_USERNAME") == null ? "LT_USERNAME" : System.getenv("LT_USERNAME");
   final String accessKey = System.getenv("LT_ACCESS_KEY") == null ? "LT_ACCESS_KEY" : System.getenv("LT_ACCESS_KEY");
   final String gridUrl = "@hub.lambdatest.com/wd/hub";

   try {
       this.driver = new RemoteWebDriver(new URL("http://" + userName + ":" + accessKey + gridUrl), getChromeOptions());

   } catch (final MalformedURLException e) {
       System.out.println("Could not start the remote session on LambdaTest cloud grid");
   }

   this.driver.manage().timeouts().implicitlyWait(Duration.ofSeconds(20));
}
@AfterTest
public void tearDown() {
   this.driver.executeScript("lambda-status=" + this.status);
   this.driver.quit();
}

@Test
public void testBrokenLinks() {

   driver.get("https://ecommerce-playground.lambdatest.io/");
   WebElement shopByCategoryMenu = driver.findElement(By.cssSelector("div.shop-by-category a"));
   shopByCategoryMenu.click();
   List<WebElement> shoppingLinks = driver.findElements(By.cssSelector("#widget-navbar-217841 ul li a"));

   for (int i = 0; i <= shoppingLinks.size(); i++) {

       try {
           HttpURLConnection connection = (HttpURLConnection) new URL(shoppingLinks.get(i).getAttribute("href")).openConnection();
           connection.connect();

           URL url = connection.getURL();
           System.out.println(url.toString());

           int responseCode = connection.getResponseCode();
           System.out.println("Response Code for :" +shoppingLinks.get(i).getText() + " is: " + responseCode);
           connection.disconnect();

       } catch (IOException e) {
           throw new RuntimeException(e);
       }
   }
   this.status = "passed";
}
How Do AI Agents Speed Up Selenium WebDriver Debugging?
AI-driven test agents now read a failed Selenium WebDriver run's stack trace and DOM state, then suggest the likely faulty line before a tester sets a single breakpoint.
- Root-cause suggestion: a GenAI testing agent parses a failed run's stack trace, screenshot, and DOM snapshot together, then points to the likely faulty line before a tester opens the debugger.
- Self-healing locators: an AI agent re-resolves a stale element locator after a DOM change, so debugging starts on the real failure instead of a no-such-element false alarm.
- Natural-language breakpoint requests: a tester can ask an agent to pause when a specific action fails, instead of hand-placing a breakpoint on the right line.
- Automated log triage: AI log analysis groups repeated Log4j2 stack traces from a large run into a handful of distinct failure patterns instead of a tester reading each one.
These agents cut the time to locate a failure, but understanding why the code behaves that way still needs a tester stepping through the breakpoint by hand.
Best Practices for Debugging in Test Automation
Wrapping Up!
Author

Faisal Khatri
Blogs: 47


Mohammad Faisal Khatri is a Software Testing Professional with 17+ years of experience in manual exploratory and automation testing. He currently works as a Senior Testing Specialist at Kafaat Business Solutions and has previously worked with Thoughtworks, HCL Technologies, and CrossAsyst Infotech. He is skilled in tools like Selenium WebDriver, Rest Assured, SuperTest, Playwright, WebDriverIO, Appium, Postman, Docker, Jenkins, GitHub Actions, TestNG, and MySQL. Faisal has led QA teams of 5+ members, managing delivery across onshore and offshore models. He holds a B.Com degree and is ISTQB Foundation Level certified. A passionate content creator, he has authored 100+ blogs on Medium, 40+ on TestMu AI, and built a community of 25K+ followers on LinkedIn. His GitHub repository “Awesome Learning” has earned 1K+ stars.


Selenium WebDriver Breakpoint Debugging FAQs
Did you find this page helpful?
More Related Blogs
TestMu AI forEnterprise
Get access to solutions built on Enterprise
grade security, privacy, & compliance
- Advanced access controls
- Advanced data retention rules
- Advanced Local Testing
- Premium Support options
- Early access to beta features
- Private Slack Channel
- Unlimited Manual Accessibility DevTools Tests