

Power Your Software Testing with AI Agents and Cloud
The Native AI-Agentic Cloud Platform to Supercharge Quality Engineering. Test Intelligently and Ship Faster.


- TestMu AI (Formerly LambdaTest)
- /
- Blog
- /
- Debugging JavaScript Using Developer Console
Debugging JavaScript Using the Browser’s Developer Console
Debug JavaScript in the browser developer console. Open DevTools, turn on Pause on Exceptions, set breakpoints, read the call stack, and use console methods.
Last Updated on:
Debugging JavaScript in the browser developer console means pausing the script where it breaks instead of guessing from console.log output. Open DevTools with F12 on Windows or Cmd+Opt+I on a Mac, switch to the Sources tab, and set a breakpoint or turn on Pause on Exceptions to stop execution at the failing line with every variable in scope still readable. This guide covers getting started, a typical exception scenario, inspecting the code, root cause analysis, breakpoints, console commands, AI debugging, and cross browser JavaScript errors.
Key Takeaways
- The browser developer console opens with F12 or Ctrl+Shift+I on Windows and Cmd+Opt+I on a Mac, and the JavaScript debugger lives under the Sources tab.
- Turning on Pause on Exceptions stops execution the moment an uncaught error is thrown, so the failing line and its variables stay readable.
- Breakpoints are set either by writing a debugger statement inline or by clicking a line number in the script debugger.
- The Call Stack tab traces a bad value back through parent functions, which is how the root cause is found rather than the symptom.
- Console methods such as console.time, console.count, console.table and console.assert answer timing, repetition and shape questions without adding breakpoints.
- Chrome DevTools MCP lets a coding agent read console messages and source-mapped stack traces from a live Chrome instance.
Let’s Get Started!
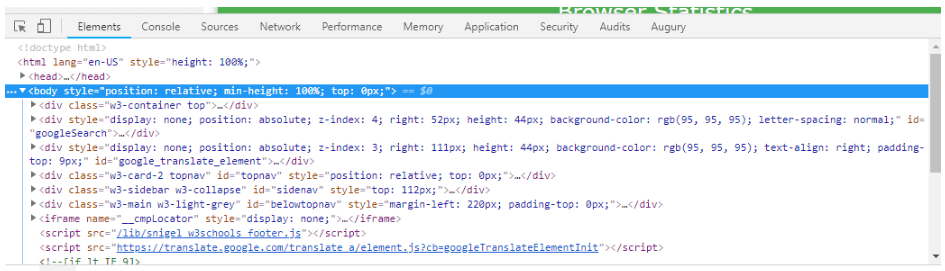
In almost all major browsers that are based on Windows platform, developer tool can be accessed by pressing F12, or Ctrl+Shift+i, or by right clicking on an element and navigating to Inspect Element. If you are using Mac, Developer tools can be accessed in browser by pressing Cmd+Opt+i. The script debugger can be located under the Sources tab. Instead of using alert popups, a developer can easily inspect the code by just using breakpoints on the script debugger.
A Typical Scenario
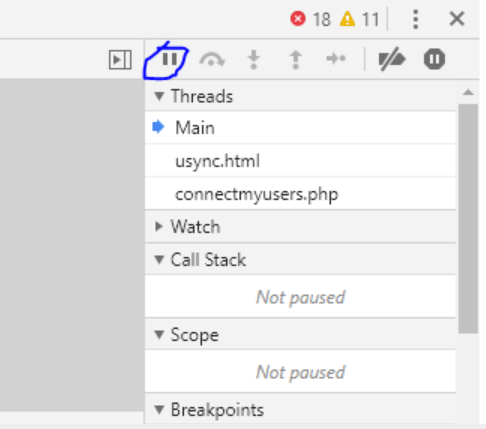
Let’s think about a typical scenario where your JS code is throwing an exception. If you are using Chrome, the first thing to do is enable the “Pause on exceptions” icon. By enabling it, the browser stops code execution whenever an exception is caught. If the library handles the exception, code execution will not be paused in that case. The Pause on Exceptions control is available in Chrome, Edge and Firefox.
Inspecting the Code
With the execution paused, we can now observe the code and find out what is wrong. This is one of the biggest benefit of using the debugger. Everything the script has access to is visible to the developer.
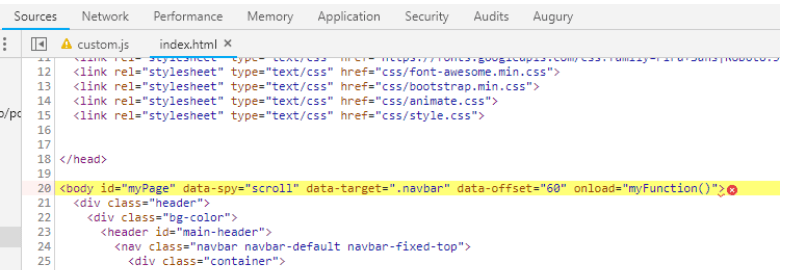
In the code view, wherever the exception is thrown, there is a red icon at the end of that line. We can see the error message by either hovering on the icon or by looking at the error message on the console. Hovering the mouse on the variables allow further inspection. Under the scope tab we can also find more information on variables. In the scope tab, variables are ordered by scope. For example, all local variables are arranged under the “local” section.
Figuring Out the Problem
In case of small errors, the error message gives us clear idea on what is causing the exception. For example, if forEach function is used and the url has an incorrect value we will get error message like “forEach is not a function”. The bug can be fixed by using an if statement and checking the variable type. But as an experienced front-end developer, you need to detect the root cause of the problem before fixing it.
Root Cause Analysis
The root cause of the error can be searched by inspecting the Call Stack tab. Call Stack shows us the parent elements of the current function that is being inspected. It shows the functions in a list. By clicking the list, all previous functioned can be accessed. The parent functions should be inspected until the root cause of the error is found. Once we find a place where the bad value originates, the search is over.
Debugging A Complicated Problem Using Breakpoints
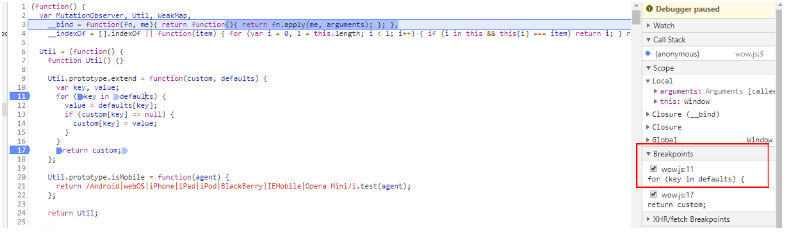
The script debugger has another interesting feature called breakpoints, that can help the developer to figure out more complex problems. Breakpoints can be set by adding a debugger; statement inline or by clicking the line number at the script debugger.
After adding the debugger, when we click the “run” button, code execution starts and the debugger automatically pause execution when the line containing the debugger statement is reached. Until and unless the line containing the error is found, breakpoints should be added after each and every function.
While debugging, any script errors detected will be automatically displayed on the console. The developer has only one job left. Identify the line of code that has the error, fix it and debug the code again.

Note: Try LT Debug Chrome Extension for debugging websites!
Try LT Debug Chrome Extension for debugging websites!
Using the Console for Debugging
Apart from inbuilt debugging tools, developers can also use certain commands in the console to fix performance issues.
- If a process is taking quite a lot of time,
console.time()can be used to start a countdown timer. Printing the value withconsole.timeEnd()will give you the information of time taken to execute a certain function. - For a trickier performance issue, in order to look for a memory leak,
console.memorycan be used to displays the heap size. - In case of a recurring code,
console.count()can be used to find out how many times the script reads your code. - If you want to log a value when the condition is false
console.assert(condition, msg)can be used. However, while using Node JS, this may throw an Assertion error. - The objects which are logged can be displayed in a nicely arranged table format using
console.table(). - Finally if there are a number of logs in your console and you want to start over in a clean view use
console.clear().
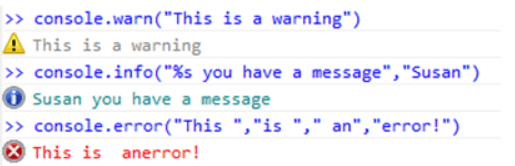
The inbuilt debugging tool of a browser is powerful enough to reduce the time taken to debug a code. Whether you are using the console or the script debugger, debugging is now a lot more productive and fun if your browser is updated.
How Do AI Agents Help Debug JavaScript Errors?
AI agents read the same signals you read in DevTools, then name a likely cause. They do not guess at your code, because the Chrome DevTools Protocol hands them the real console output.
- Chrome DevTools MCP: the Chrome team ships chrome-devtools-mcp, a Model Context Protocol server that lets a coding agent such as Claude Code, Cursor or Gemini CLI drive a live Chrome instance.
- Source-mapped stack traces: the server returns console messages with source-mapped stack traces, so the agent points at your original file and line instead of a minified bundle.
- Performance traces: the same server records a DevTools performance trace and reads Core Web Vitals such as LCP, INP and CLS from it, work that used to mean opening the Performance panel by hand.
- Network requests: an agent can list network requests and capture screenshots, so a failed fetch sitting behind a JavaScript error shows up without a second reproduction run.
- Where it stops: an agent only sees what the page emitted. A bug that depends on a watch expression, or on a value halfway through a loop, still needs you at a breakpoint in the Sources tab.
Treat the agent as a first pass. Confirm what it claims at a breakpoint, then lock the fix in with javascript unit testing so the same error cannot come back. For a bug that only reproduces on a phone, chrome remote debugging gives you the same DevTools against the device.
Debugging Browser Compatibility JavaScript Errors in TestMu AI
It’s a hard fact that JavaScript is not cross browser compatible. Not all browsers have complete support for JavaScript and earlier browsers outright do not have any support for now some very commonly used JS tags. Finding cross browser compatibility issues and debugging them is quite a challenge. But, at TestMu AI we provide a platform with real browser and operating system combinations, each equipped with robust debugging tools.
It’s a perfect platform to find and debug cross browser compatibility issues especially on browser versions or operating systems you don’t have native access to. We also have debugging tools on mobile browsers, giving you a perfect tool-set to debug mobile web issues.
Author

Arnab Roy Chowdhury
Blogs: 70


Arnab Roy Chowdhury is a community contributor with 10+ years of experience working across software development, web UI engineering, and technical content writing. Currently a Senior Consultant at Capgemini, he has hands-on experience in building and maintaining cross-browser compatible web interfaces using HTML5 and modern frontend practices. Arnab has also contributed as a freelance web developer and writer, combining practical development expertise with clear technical documentation. He holds a Bachelor’s degree in Computer Engineering.


JavaScript Debugging FAQs
Did you find this page helpful?
More Related Blogs
TestMu AI forEnterprise
Get access to solutions built on Enterprise
grade security, privacy, & compliance
- Advanced access controls
- Advanced data retention rules
- Advanced Local Testing
- Premium Support options
- Early access to beta features
- Private Slack Channel
- Unlimited Manual Accessibility DevTools Tests