

Power Your Software Testing with AI Agents and Cloud
The Native AI-Agentic Cloud Platform to Supercharge Quality Engineering. Test Intelligently and Ship Faster.


- TestMu AI (Formerly LambdaTest)
- /
- Blog
- /
- How to Debug E2E Test Failures: A Practical CI Playbook
How to Debug E2E Test Failures: A Practical CI Playbook
A step-by-step playbook for turning a red end-to-end run into a named root cause, from artifact capture to quarantine policy.
Published on:
Debug E2E test failures by capturing the run's trace, screenshot, and log artifacts first, then deciding whether the failure is a real defect or a flake. CircleCI's 2026 State of Software Delivery report, built on 28,738,317 workflows, puts the typical team's recovery time back to green at 72 minutes.[1]
This guide covers why CI fails when local passes, what to capture, how to separate a real bug from a flake, how to reproduce a failure, the common root causes, how to isolate the failing step, AI-feature tests, quarantine policy, and how to measure progress.
Key Takeaways
- Artifact capture first: Turn on trace and log capture on the retry attempt before you read a single stack trace.
- Flake definition: A run is flaky when the same test fails and then passes on retry against the same commit, which makes it a measurable condition.
- Pinned runner image: Fix the CI container to a specific version tag so a failure that happens only in CI stops being an argument about the environment.
- 72-minute recovery: The typical team needs 72 minutes to get a pipeline back to green, so every hour of slow triage compounds across the week.
- Retries hide regressions: Chromium research found that treating fault-triggering failures as flaky misses roughly 76.2% of regression faults, so retry counts belong on a dashboard rather than in a fix.
- Flake rate as the metric: Track the share of runs that fail and then pass on retry, because that one number shows whether the debugging effort is working.
Why Do E2E Tests Fail in CI but Pass Locally?
CI runners differ from a laptop in CPU, memory, browser build, and network latency. A test that depends on fast rendering passes locally and times out on a shared runner with less headroom.
The failure is real, and its cause is timing headroom rather than program logic. A test written on a machine that renders a component in 40ms carries an implicit assumption that the component is always fast. On a runner with a fraction of that capacity, the same step takes 300ms and the assertion runs before the component finishes rendering.
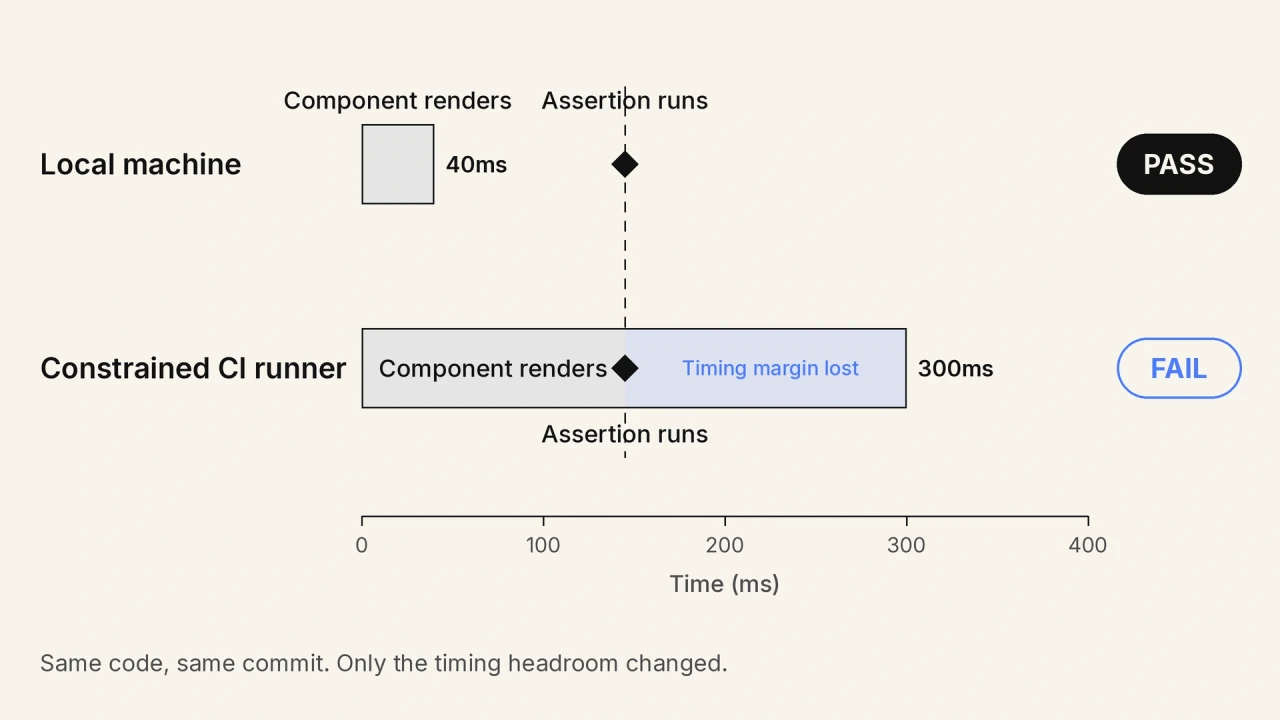
Four differences produce most CI-only failures.
| Difference | What it changes | First thing to check |
|---|---|---|
| Compute headroom | Rendering and script execution take longer under constrained CPU and memory | Whether the failing step is a wait or an assertion |
| Browser build | The runner ships a different browser version than the one installed locally | The browser version recorded in the run log |
| Display mode | Headless rendering can differ from headed rendering in layout and font metrics | Whether the test passes locally in headless mode |
| Parallel workers | Concurrent tests contend for the same accounts, rows, and fixtures | Whether the test passes when run alone |
The durable fix is to stop the environment from changing between runs. Playwright publishes an official container image, and its documentation states that it is recommended to always pin your Docker image to a specific version if possible.[2] A pinned tag such as mcr.microsoft.com/playwright:v1.62.0-noble removes browser version drift as a variable. A failure that survives the pin is genuinely about your application.
What Should You Capture Before You Debug E2E Test Failures?
Capture a trace, a screenshot, and the console and network logs on the failing attempt. Playwright records all of these in one trace.zip file when the trace option is set to on-first-retry.
A stack trace tells you which assertion failed. It does not tell you what the page looked like, which request returned a 500, or whether the element was ever present. Those are separate recordings, and if the job did not capture them, the run is gone the moment the runner is destroyed.
The Playwright Trace Viewer records the locator used for every action and how long each one took to run. It stores a complete DOM snapshot for each action, plus network requests with headers and bodies.[3] Console output and the source line behind each step sit in the same file. That one recording replaces most of the guesswork in a triage session.
// playwright.config.ts
import { defineConfig } from '@playwright/test';

export default defineConfig({
  retries: 2,
  use: {
    trace: 'on-first-retry',
  },
});
Setting the option to on-first-retry produces a trace.zip for each retried test without the performance overhead of tracing every test in the suite. Open a downloaded trace with npx playwright show-trace path/to/trace.zip, which launches the viewer locally against the exact recording the CI job produced.
- Capture on retry, not always: Tracing every passing test inflates run time and artifact storage for recordings nobody opens.
- Upload the results directory: Artifacts written to disk are discarded when the runner terminates, so the CI job has to publish that directory explicitly.
- Keep the retention window short: 7 to 14 days covers the period when anyone actually investigates a failure.
Artifacts answer what happened in one run. Aggregating them across runs is a different discipline, covered in test observability.
How to Tell a Real Bug From a Flaky Test?
A test is flaky when it fails and then passes on retry against the same commit. A real bug fails consistently on that commit and keeps failing when you rerun it on a clean environment. On TestMu AI, every HyperExecute task starts on a fresh virtual machine, so a rerun there is a clean-environment rerun by default.
Playwright encodes exactly this rule in its reporting. It defines a flaky test as one that failed on the first run, but passed when retried, and reports three outcomes: passed, flaky, and failed.[4] The status is derived from behaviour across attempts rather than assigned by a human reading a log.
Datadog applies the same logic across runs rather than within one. Its Test Optimization product tags a test as flaky when it passes and fails across multiple runs for the same commit.[5] It then splits that into new flaky for first-time behaviour on the default branch, and known flaky for a failure already identified.
The split matters during triage. A known flake is noise the team has already accounted for. A new flake on the default branch usually means something changed today.
For the underlying definition and the conditions that produce non-deterministic results, see flaky test.
The TestMu AI explainer below, What Are Flaky Tests And Where Do They Come From, walks through the conditions that produce a non-deterministic result in an automated suite.

How to Reproduce a Failing E2E Test Locally?
Run the same test, at the same commit, in the same container image the CI job used. Then repeat it enough times that an intermittent failure shows up, instead of judging it from a single run.
Most failed reproductions fail on one of those three variables. A developer checks out the branch instead of the commit, runs on the host machine instead of the container, runs the test once, sees green, and closes the ticket.
Step 1: Pin the Commit
Check out the exact commit SHA the CI job ran, not the branch head. A branch that has moved three commits since the failure is a different application, and reproducing against it proves nothing about the run you were sent.
Step 2: Match the Container
Run inside the same pinned image the pipeline used, so the browser build, fonts, and system libraries match. A failure that only happens inside an Ubuntu container will not appear on macOS, which removes the very condition you are investigating.
Step 3: Repeat the Test
A test that fails 1 run in 20 will pass a single local check almost every time. Repeating the same test many times in one command turns a rare condition into an observable one.
# repeat one test 20 times to surface an intermittent failure
npx playwright test checkout.spec.ts --repeat-each=20 --workers=4
Step 4: Narrow the Scope
Once the failure reproduces, stop the run at the failing step and inspect the live page. Playwright opens its Inspector with the debug flag. The flag launches the browser headed and sets the default timeout to zero, so the session does not expire while you inspect it.[6]
# open the Inspector on one test, in one browser
npx playwright test checkout.spec.ts:42 --project=chromium --debug
Adding an await page.pause() call directly above the failing assertion stops execution there and hands the browser to you with the application in its failing state. Cypress users reach the same point through a different route, described in Cypress debugging.

What Are the Most Common Root Causes of E2E Test Failures?
Four causes explain most E2E failures: async timing races, locator drift after a UI change, shared test data, and environment differences. Each leaves a distinct signature in the trace.
Reading the signature first is faster than reading the code first, because the signature narrows four possibilities to one before you open the spec file.
| Signature in the trace | Likely cause | The fix that holds |
|---|---|---|
| Step waited the full timeout, element never appeared | Async timing race | Wait on a condition the app signals, not a fixed duration |
| Locator resolved to zero elements, page rendered correctly | Locator drift | Bind to a role or a test id instead of DOM structure |
| Fails only when run with others, passes alone | Shared test data | Give every worker its own account and fixtures |
| Passes locally, fails on every CI run | Environment difference | Pin the container image and rerun inside it |
Async timing races are the largest group and the easiest to fix wrongly. Adding a fixed sleep makes the symptom disappear on the machine where it was added and reappear on a slower one, while permanently adding that duration to every future run. Waiting on a condition the application actually signals costs nothing when the app is fast.
Locator drift is the hardest to spot from the failure message alone. A test bound to a CSS path breaks when a developer wraps a component in a new container, and nothing in the failure message says so. The trace does say so: the action shows a locator that matched nothing against a DOM snapshot where the element is plainly visible. Framework-specific patterns are covered in Playwright flaky tests.
How to Debug E2E Test Failures Down to the Failing Step?
Replay the run step by step and compare each step against what the test intended, instead of reading only the stack trace. The failing step and the last good state say more than the exception.
A stack trace names the assertion that failed, which is usually several steps after the point where the application state went wrong. The cart total is wrong at step 9 because the pricing call returned a 500 at step 5, and the exception describes step 9. Finding the real cause means replaying the run as a sequence of steps. When you find the root cause of a failed test with AI on TestMu AI, the event timeline lays out that sequence for you, tagging the step that broke as Root Cause and the failures it triggered as Effect.
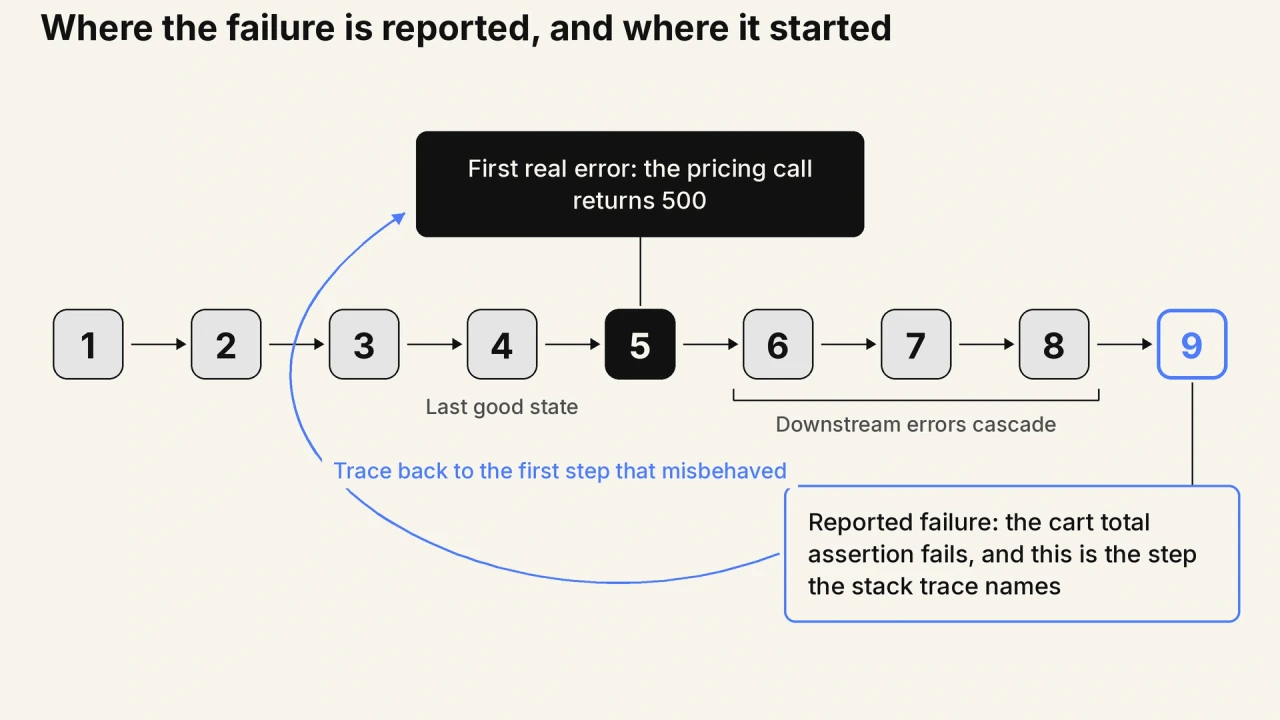
TestMu AI provides KaneAI, which produces a test report with root-cause analysis on failure. Its Test Run instance view renders execution steps in the same format as the authoring steps, so a failure points at a specific step rather than a stack trace. Three parts of that view carry the triage:
- Autoplay: Steps through a screenshot-based slideshow of the execution, with a mouse pointer showing where each action took place.
- Screenshot compare: Compares the screenshot captured during authoring against the one captured during execution, step by step, which is how a UI change the test never accounted for shows up.
- Logs on demand: Opens command logs kept in sync with each step, plus network logs and terminal logs, without leaving the view.
The instance view can be shared as a public link or attached to Jira, which matters when the person who can explain the failure is not the person who found it. The official documentation covers setup and the reporting surface in detail.

Note: Step-level evidence turns a red run into a named cause. Start free on TestMu AI and keep that evidence for every failed run.
How to Debug E2E Tests That Drive AI Features?
An E2E test that asserts on an AI response fails intermittently because the model returns different wording each run. Assert on scored quality thresholds instead of an exact output string.
A traditional test asserts that the button text equals Submit, and that assertion is either true or false. An AI response is non-deterministic, so the same question returns different wording every run. There is no selector to check and no fixed DOM state to assert against, which means retrying the test changes the result without fixing anything.
The workaround teams reach for first is a substring match on a phrase the model usually returns. It holds until the model is updated, then breaks across the whole suite at once. Scoring the response against quality dimensions survives a model change.
TestMu AI provides Agent Testing, which evaluates chat, voice, and phone agents against standardized quality metrics rather than exact strings.
- 9 chat and voice metrics: Scores each interaction on dimensions including hallucination, bias, completeness, and context awareness, so a response is judged on quality rather than wording.
- 30+ phone call metrics: Applies a wider metric set to inbound and outbound phone agents, including audio quality scoring.
Score AI Responses Instead of Matching Strings

When Should You Fix, Retry, or Quarantine a Failing Test?
Fix a test that guards a critical path, retry one that fails on a known transient condition, and quarantine one that fails often. Quarantine needs an owner and a due date, or the test is never fixed.
Retries are the default answer and the one that carries a hidden cost. A study of the Chromium continuous integration system found that flaky tests reveal more than a third of all regression faults. Applying flakiness-detection methods to them missed approximately 76.2% of all regression faults.[7]
Retrying until green discards the signal a genuine regression was sending.
| Action | Use it when | What it costs |
|---|---|---|
| Fix | The test guards checkout, auth, payments, or data deletion | Engineering time now, in exchange for a trustworthy signal |
| Retry | The failure traces to a known transient condition you are already tracking | Longer runs, and the risk of masking a real regression |
| Quarantine | The test flakes repeatedly and blocks unrelated work | Lost coverage until someone named fixes it by a set date |
Both major frameworks make retry counts explicit rather than silent. Playwright takes a retries value in its config file or as a command-line flag.[4] Cypress splits the setting, so a suite can retry twice in runMode and zero times in openMode.[8] Cypress also suffixes each screenshot with the attempt number, so the artifacts show how many tries a green result took.
// cypress.config.js
module.exports = {
  retries: {
    runMode: 2,   // retry twice in CI
    openMode: 0,  // never retry while developing
  },
};
Keeping openMode at zero is deliberate. A developer who never sees a flake locally has no reason to fix one, and the retry setting quietly moves the cost onto whoever reads the CI dashboard.
How to Measure Whether Your Debugging Is Working?
Track flake rate, time to green, and the size of the quarantine list each week. Flake rate is the share of runs that fail and then pass on retry, and it is the single number that shows progress.
A team that fixes individual failures without measuring the rate has no way to tell improvement from luck. Three numbers, reviewed weekly, are enough.
- Flake rate: The percentage of runs that fail and then pass on retry, which measures how much of the suite is noise rather than signal.
- Time to green: Minutes from a red pipeline to a passing one, against the 72-minute figure CircleCI reports for the typical team.
- Quarantine size: The count of tests outside the blocking path, which is coverage the suite currently is not providing.
A quarantine list that grows every week while flake rate stays flat means tests are being removed rather than fixed. That pattern is invisible in any single build and obvious in a four-week trend, which is the argument for tracking the numbers rather than reacting to builds. TestMu AI shows these patterns through test intelligence, which aggregates results across runs instead of one job at a time.
Conclusion
Start by turning on trace capture for retried tests and publishing the results directory as a CI artifact. That one change converts every future red run from a guess into a recording, and it takes a single line of configuration.
From there the sequence holds regardless of framework. Decide whether the run is a flake or a defect using the retry rule. Reproduce it at the same commit inside the same pinned container. Read the trace signature to name the cause, and only then open the spec file.
Teams that debug E2E test failures this way spend their time on the four causes that produce most failures rather than on rerunning builds. The next step is to run that loop on every pull request, which is covered in E2E test coverage every PR.
The measurement closes the loop. Watch flake rate and quarantine size weekly, and treat a growing quarantine list as lost coverage rather than a solved problem.
Sources and References Used
- [1] 5 Key Takeaways From the 2026 State of Software Delivery - CircleCI (2026)
- [2] Docker - Playwright Documentation, Microsoft
- [3] Trace Viewer - Playwright Documentation, Microsoft
- [4] Retries - Playwright Documentation, Microsoft
- [5] Working with Flaky Tests - Datadog Documentation
- [6] Debugging Tests - Playwright Documentation, Microsoft
- [7] The Importance of Discerning Flaky from Fault-triggering Test Failures: A Case Study on the Chromium CI - arXiv (February 2023)
- [8] Test Retries - Cypress Documentation
Author

Prince Dewani
Blogs: 30

Prince Dewani is a Community Contributor at TestMu AI specializing in AI agents, software testing, QA, and SEO. He is certified in Selenium, Cypress, Playwright, Appium, Automation Testing, and KaneAI, and presented academic research on AI agents at PBCON-01. At TestMu AI, he has also carried out extensive cross-browser research on the support of modern web technologies such as WebGPU, WebAssembly, WebXR, WebGL2 and other web technologies, validating their compatibility and feature parity across major browsers and rendering engines through rigorous hands-on testing. Prince has hands-on experience building AI agent workflows using Anthropic Claude, Google Antigravity, n8n, LangChain, and other agentic frameworks, and works regularly with MCP and A2A protocols. He shares his work with 5,500+ QA engineers, developers, DevOps experts, tech leaders, and AI agent practitioners on LinkedIn.
Reviewer

Shahzeb Hoda
Reviewer
Shahzeb Hoda is the Associate Director of Marketing and a Community Contributor at TestMu AI, leading strategic initiatives in developer marketing, content, and community growth. With 10+ years of experience in quality engineering, software testing, automation testing, and e-learning, he has authored and reviewed 70+ technical articles on software testing and automation. Shahzeb holds an M.Tech in Computer Science from BIT, Mesra, and is certified in Selenium, Cypress, Playwright, Appium, and KaneAI. He brings deep expertise in CI/CD pipeline automation, cross-browser testing, AI-driven testing practices, and framework documentation. On LinkedIn, he is followed by 3,700+ engineers, developers, DevOps professionals, tech leaders, and enthusiasts.


E2E Test Debugging FAQs
Did you find this page helpful?
More Related Blogs
TestMu AI forEnterprise
Get access to solutions built on Enterprise
grade security, privacy, & compliance
- Advanced access controls
- Advanced data retention rules
- Advanced Local Testing
- Premium Support options
- Early access to beta features
- Private Slack Channel
- Unlimited Manual Accessibility DevTools Tests