

Power Your Software Testing with AI Agents and Cloud
The Native AI-Agentic Cloud Platform to Supercharge Quality Engineering. Test Intelligently and Ship Faster.


- TestMu AI (Formerly LambdaTest)
- /
- Blog
- /
- 15 Tips To Use Chrome DevTools For Cross Browser Testing [2026]
15 Tips To Use Chrome DevTools For Cross Browser Testing [2026]
Use Chrome DevTools for cross browser testing with 15 tips: Device Mode, throttling, sensors, rendering emulation, and breakpoints, plus where DevTools stops.
Last Updated on:
Chrome DevTools supports cross browser testing by emulating the conditions around a browser: screen size, network speed, CPU power, location, and user preferences such as dark mode.
What DevTools cannot emulate is another rendering engine, because every panel runs inside Chrome's Blink engine.
This guide covers opening DevTools, tips 1 to 8 for emulating devices and networks, tips 9 to 12 for debugging rendering and script differences, tips 13 to 15 for automating runs, AI agent workflows, the limits of DevTools, and developer tools on real cloud browsers.
TL;DR
- Chrome DevTools can emulate screen sizes, network speed, CPU speed, location, and user preferences such as dark mode.
- Chrome DevTools always renders with Chrome's Blink engine, so Chrome DevTools cannot show Safari or Firefox rendering.
- Overriding the user agent in Chrome DevTools changes what the server sends, not how Chrome renders the page.
- Chrome's own documentation calls DevTools Device Mode a first-order approximation of a real mobile device.
- Final cross browser checks need real Safari, Firefox, and mobile devices, ideally with each browser's own developer tools.
Opening Chrome DevTools and Finding the Right Tip
Open Chrome DevTools by right-clicking the page and choosing Inspect, or press F12 or Control+Shift+I on Windows and Linux, or Command+Option+I on Mac, then dock the panel where you prefer.
The shortcuts below come from the Chrome DevTools keyboard shortcuts reference.
| Action | Windows / Linux | Mac |
|---|---|---|
| Open DevTools | F12 or Control+Shift+I | Command+Option+I |
| Inspect mode | Control+Shift+C | Command+Shift+C |
| Open Console | Control+Shift+J | Command+Option+J |
| Command Menu | Control+Shift+P | Command+Shift+P |
| Toggle Device Mode | Control+Shift+M | Command+Shift+M |
| Start or stop recording | Control+E | Command+E |
The Command Menu is the fastest route to most tips below. Type a panel name, such as Sensors or Rendering, and press Enter.
Match the problem in front of you to the tip that handles it:
| If you see this | Go to |
|---|---|
| Layout breaks at a screen width | Tip 1 (Device Mode) and tip 8 (CSS Overview) |
| Server sends different markup to Safari or Firefox | Tip 2 (User Agent Override) |
| Page is slow or janky on phones | Tips 3 and 4 (throttling) with tip 15 (Performance) |
| Location-based content is wrong | Tip 5 (Sensors) |
| Dark mode or reduced motion looks broken | Tip 6 (Rendering tab) |
| A CSS fix needs trying before a commit | Tip 9 (live edits) and tip 7 (Local Overrides) |
| A script fails only in one case | Tip 11 (conditional breakpoints) |
| A form or API call sends the wrong data | Tip 12 (XHR/fetch breakpoints) |
| A bug appears in one session but not another | Tip 14 (Clear Site Storage) |
If you are new to the panels themselves, start with this Chrome developer tools guide.
Tips 1 to 8: Emulate Devices, Networks, and User Settings
Chrome DevTools emulates environments through Device Mode, network and CPU throttling, the Sensors panel, and the Rendering tab, which cover screen size, speed, location, and user preferences.
These eight tips reproduce the conditions most likely to break a layout or flow.
1. Simulate Mobile Viewports With Device Mode
Press Control+Shift+M (Command+Shift+M on Mac) to toggle the device toolbar. Pick a preset device or enter a custom width and height to test breakpoints.
The Chrome Device Mode documentation calls this a first-order approximation, since mobile CPUs differ from desktop ones. Use it for layout checks, not final sign-off.
2. Override the User Agent in Network Conditions
In the Network conditions tab, clear Use browser default, pick a user agent, and reload. This shows what your server sends to Safari or Firefox, including user agent client hints.
Per the Chrome user agent override guide, it does not change how Chrome functions internally. Chrome still renders the page.
3. Throttle the Network
In the Network panel, the Throttling menu offers Fast 4G, Slow 4G, 3G, and Offline presets. Slow connections expose race conditions, missing loading states, and oversized assets.
Test Offline too, since a service worker that fails there fails for every commuter on a train.
4. Throttle the CPU
In the Performance panel settings, choose a 2x, 4x, 6x, or 20x slowdown. The slowdown is relative to your own machine, so a fast laptop needs a higher setting to feel like a budget phone.
5. Fake Location, Orientation, and Touch With Sensors
Open the Command Menu, type sensors, and choose Show Sensors. The Chrome Sensors panel documentation covers these overrides:
- Geolocation - Preset cities or custom coordinates for location-based features.
- Orientation - Preset or custom alpha, beta, and gamma values.
- Touch - Force touch events on a machine without a touch screen.
- Idle state - Emulate user activity and screen lock changes.
6. Emulate User Preferences in the Rendering Tab
The Chrome CSS media feature emulation guide lists what the Rendering tab can switch without changing your OS settings:
- prefers-color-scheme - Check dark and light themes.
- prefers-reduced-motion - Confirm animations respect the reduce setting.
- forced-colors and prefers-contrast - Test high contrast modes.
- Print media - Preview and fix print styles.
7. Test Fixes Across Reloads With Local Overrides
In the Network panel, right-click a request and choose Override content or Override headers. DevTools then serves your local copy on every reload.
That lets you trial a browser-specific CSS or header fix before touching the codebase.
8. Audit Styles With CSS Overview
Open More tools, then CSS Overview, and capture a report. It lists colors with low contrast issues, fonts, unused declarations, and every media query on the page.
The media query list is a quick map of the breakpoints your cross browser checks should cover.

Note: DevTools emulation runs only in Chrome. Check the same page in real Safari and Firefox sessions. Open real browsers with DevTools free
Tips 9 to 12: Debug Rendering and Script Differences
Debug browser differences by editing CSS live, capturing screenshots to compare against other browsers, and pausing JavaScript with breakpoints at the line or request where behavior diverges.
These four tips narrow a visible difference down to its cause.
9. Edit CSS Live in the Elements Panel
Select an element and change or add properties in the Styles pane. Changes apply instantly and reset on reload, which makes this the fastest way to test a candidate fix.
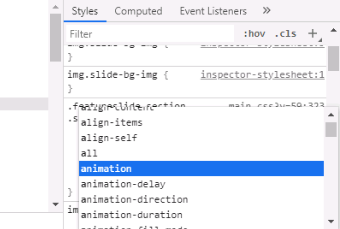
Once a fix works, copy it into your source, or use Local Overrides to keep it across reloads.
10. Capture Area Screenshots for Comparison
Open the Command Menu, run Capture area screenshot, and drag over the region you want. Save the same region from each browser to compare layouts side by side.
11. Pause Scripts With JavaScript Breakpoints
In the Sources panel, click a line number to set a breakpoint, then inspect variables when execution pauses. Right-click the line number to add a condition, so it only pauses for the case that fails.
12. Break on Network Requests With XHR/Fetch Breakpoints
In the Sources panel, add an XHR/fetch breakpoint with part of a URL. Execution pauses whenever a matching request is sent, which shows what data a failing flow actually sends.

Tips 13 to 15: Automate and Measure Test Runs
Use Chrome DevTools to copy stable locators for Selenium scripts, clear site storage so each run starts clean, and record load performance to compare against the same page in other browsers.
These three tips connect manual debugging to repeatable test runs.
13. Copy Locators for Selenium Scripts
Right-click an element in the Elements panel and choose Copy, then Copy selector or Copy XPath. Prefer IDs or data attributes over long generated paths, which break when the layout shifts.
This overview of Selenium locators explains which strategy holds up across browsers.
If maintaining copied locators is the bottleneck, an agentic tool such as KaneAI finds elements from a described intent rather than a copied selector, so a redesigned page does not break every test.
15. Record Load Performance
In the Performance panel, click Record and reload. DevTools loads the page, stops recording shortly after, and shows scripting, rendering, and painting time.
Combine it with CPU throttling from tip 4 to see how the page behaves on slower hardware.
How Do AI Agents Use DevTools To Debug Browser Issues?
AI agents use DevTools through the Chrome DevTools MCP server, which lets a coding agent drive a real Chrome instance, read console errors, and record performance traces.
The Chrome team documents the setup in Chrome DevTools for agents. Four capabilities matter for browser testing:
- chrome-devtools-mcp - The Chrome DevTools MCP server connects agents such as Claude Code, Cursor, or Copilot to a live Chrome instance.
- Console and network reads - The agent pulls console messages with source-mapped stack traces and inspects network requests instead of guessing from the source code.
- Performance traces - The agent opens the page, records a trace in the Performance panel, then reads that trace back to propose fixes.
- AI assistance panel - The panel built into DevTools sends a selected element, request, or trace to Gemini, and accepts a screenshot so a visual glitch can be described.
The Blink limit from tip 2 still applies. An agent connected to Chrome can reproduce a layout bug, propose a CSS fix, and recheck it in the same session, but every observation comes from Blink.
Point the same agent at a real Safari or Firefox session before accepting the fix, and treat an agent run as a faster route to the cause rather than proof that other engines agree.
Limits of Chrome DevTools for Cross Browser Testing
Chrome DevTools cannot show how Safari's WebKit or Firefox's Gecko render a page, and it cannot reproduce real mobile hardware, because every emulation still runs inside Chrome's Blink engine.
The table below separates what DevTools emulates from what needs real browsers or devices.
| Check | Chrome DevTools | What you need instead |
|---|---|---|
| Viewport and breakpoints | Yes, through Device Mode | Nothing extra for layout checks |
| Safari and iOS rendering | No, still Blink | Real Safari on macOS and iPhone |
| Firefox rendering | No, still Blink | Real Firefox |
| Mobile CPU, GPU, and touch | Approximated only | Real devices |
Firefox and Safari ship their own developer tools, and this guide to debug websites using Safari developer tools covers the WebKit side.
Using Developer Tools on Real Cloud Browsers
Open a live session on a cloud platform such as TestMu AI, then use the pre-installed developer tools inside that real browser or device, so you debug the actual engine rather than an emulation.
With live testing on TestMu AI, developer tools come pre-installed for major browsers and mobile devices. On desktop browsers, right-click and choose Inspect.
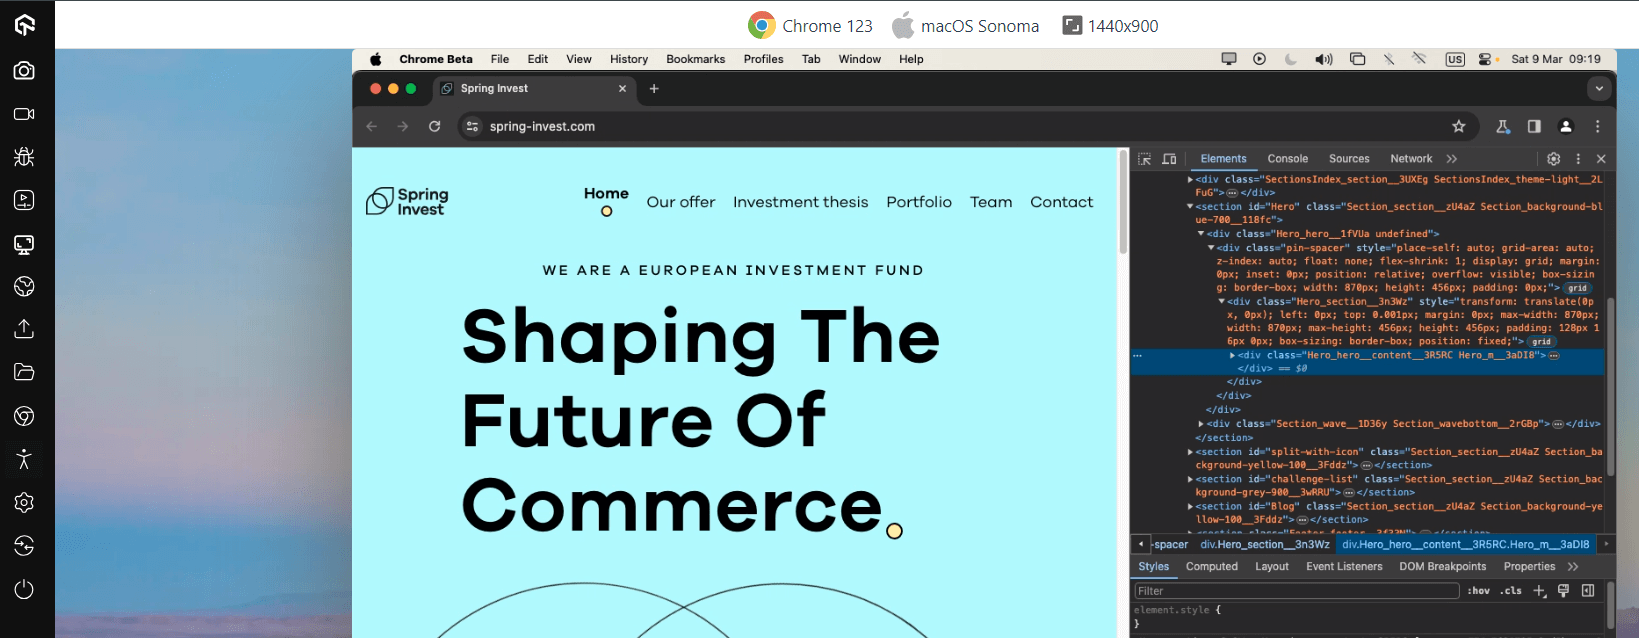
For mobile browsers, the developer tools option sits in the session controls. That covers the cases the table above marks as needing real browsers:
- WebKit checks - Test on Safari browsers across macOS versions.
- Gecko checks - Test on Firefox browsers across versions.
- Mobile checks - Run Android browser testing on real devices.
Session setup is covered in getting started with desktop browser real-time testing.
Note: Open DevTools inside real Safari, Firefox, and mobile browsers, not just Chrome emulation. Open real browsers with DevTools free
A Four-Step DevTools Workflow Before Release
The 15 tips work best as a sequence rather than a checklist. Before each release, run this loop on the pages that changed:
- Recreate the conditions - Set the viewport, network, CPU, location, and user preferences with tips 1 to 6.
- Isolate the cause - Edit CSS live or pause scripts with breakpoints, using tips 9 to 12.
- Hold the fix - Keep the change across reloads with Local Overrides (tip 7), then move the change into source.
- Confirm on real engines - Open the same page in real Safari, Firefox, and a phone, and recheck with their own tools.
Step four is the one teams skip most often, and the one DevTools cannot do for you.
Author

Harish Rajora
Blogs: 102


Harish Rajora is a software developer at TestMu AI with over 6 years of hands-on experience in Python and cross-platform application development across Windows, macOS, and Linux. He has authored 800+ technical articles and worked on large-scale projects, including GenAI applications and core engineering features used by millions. Harish has led DevOps initiatives building CI/CD pipelines with Jenkins, AWS, GitLab, and GitHub, and holds an M.Tech in Software Engineering from IIIT Allahabad.
Reviewer

Isha Vyas
Reviewer
Isha Vyas is a Lead Member of Technical Staff at TestMu AI (formerly LambdaTest), building the frontend of the quality engineering platform. She works across React.js, responsive web design, and jQuery to ship and maintain the platform's user-facing web interfaces. She brings nearly seven years of frontend engineering experience at the company, with earlier work as a Software Developer at Mantra Labs. Isha holds a B.Tech in Computer Science from Swami Keshwanand Institute of Technology, Management and Gramothan, Jaipur.


Chrome DevTools FAQs
Did you find this page helpful?
More Related Blogs
TestMu AI forEnterprise
Get access to solutions built on Enterprise
grade security, privacy, & compliance
- Advanced access controls
- Advanced data retention rules
- Advanced Local Testing
- Premium Support options
- Early access to beta features
- Private Slack Channel
- Unlimited Manual Accessibility DevTools Tests