
Agent Assurance for your AI Deployment
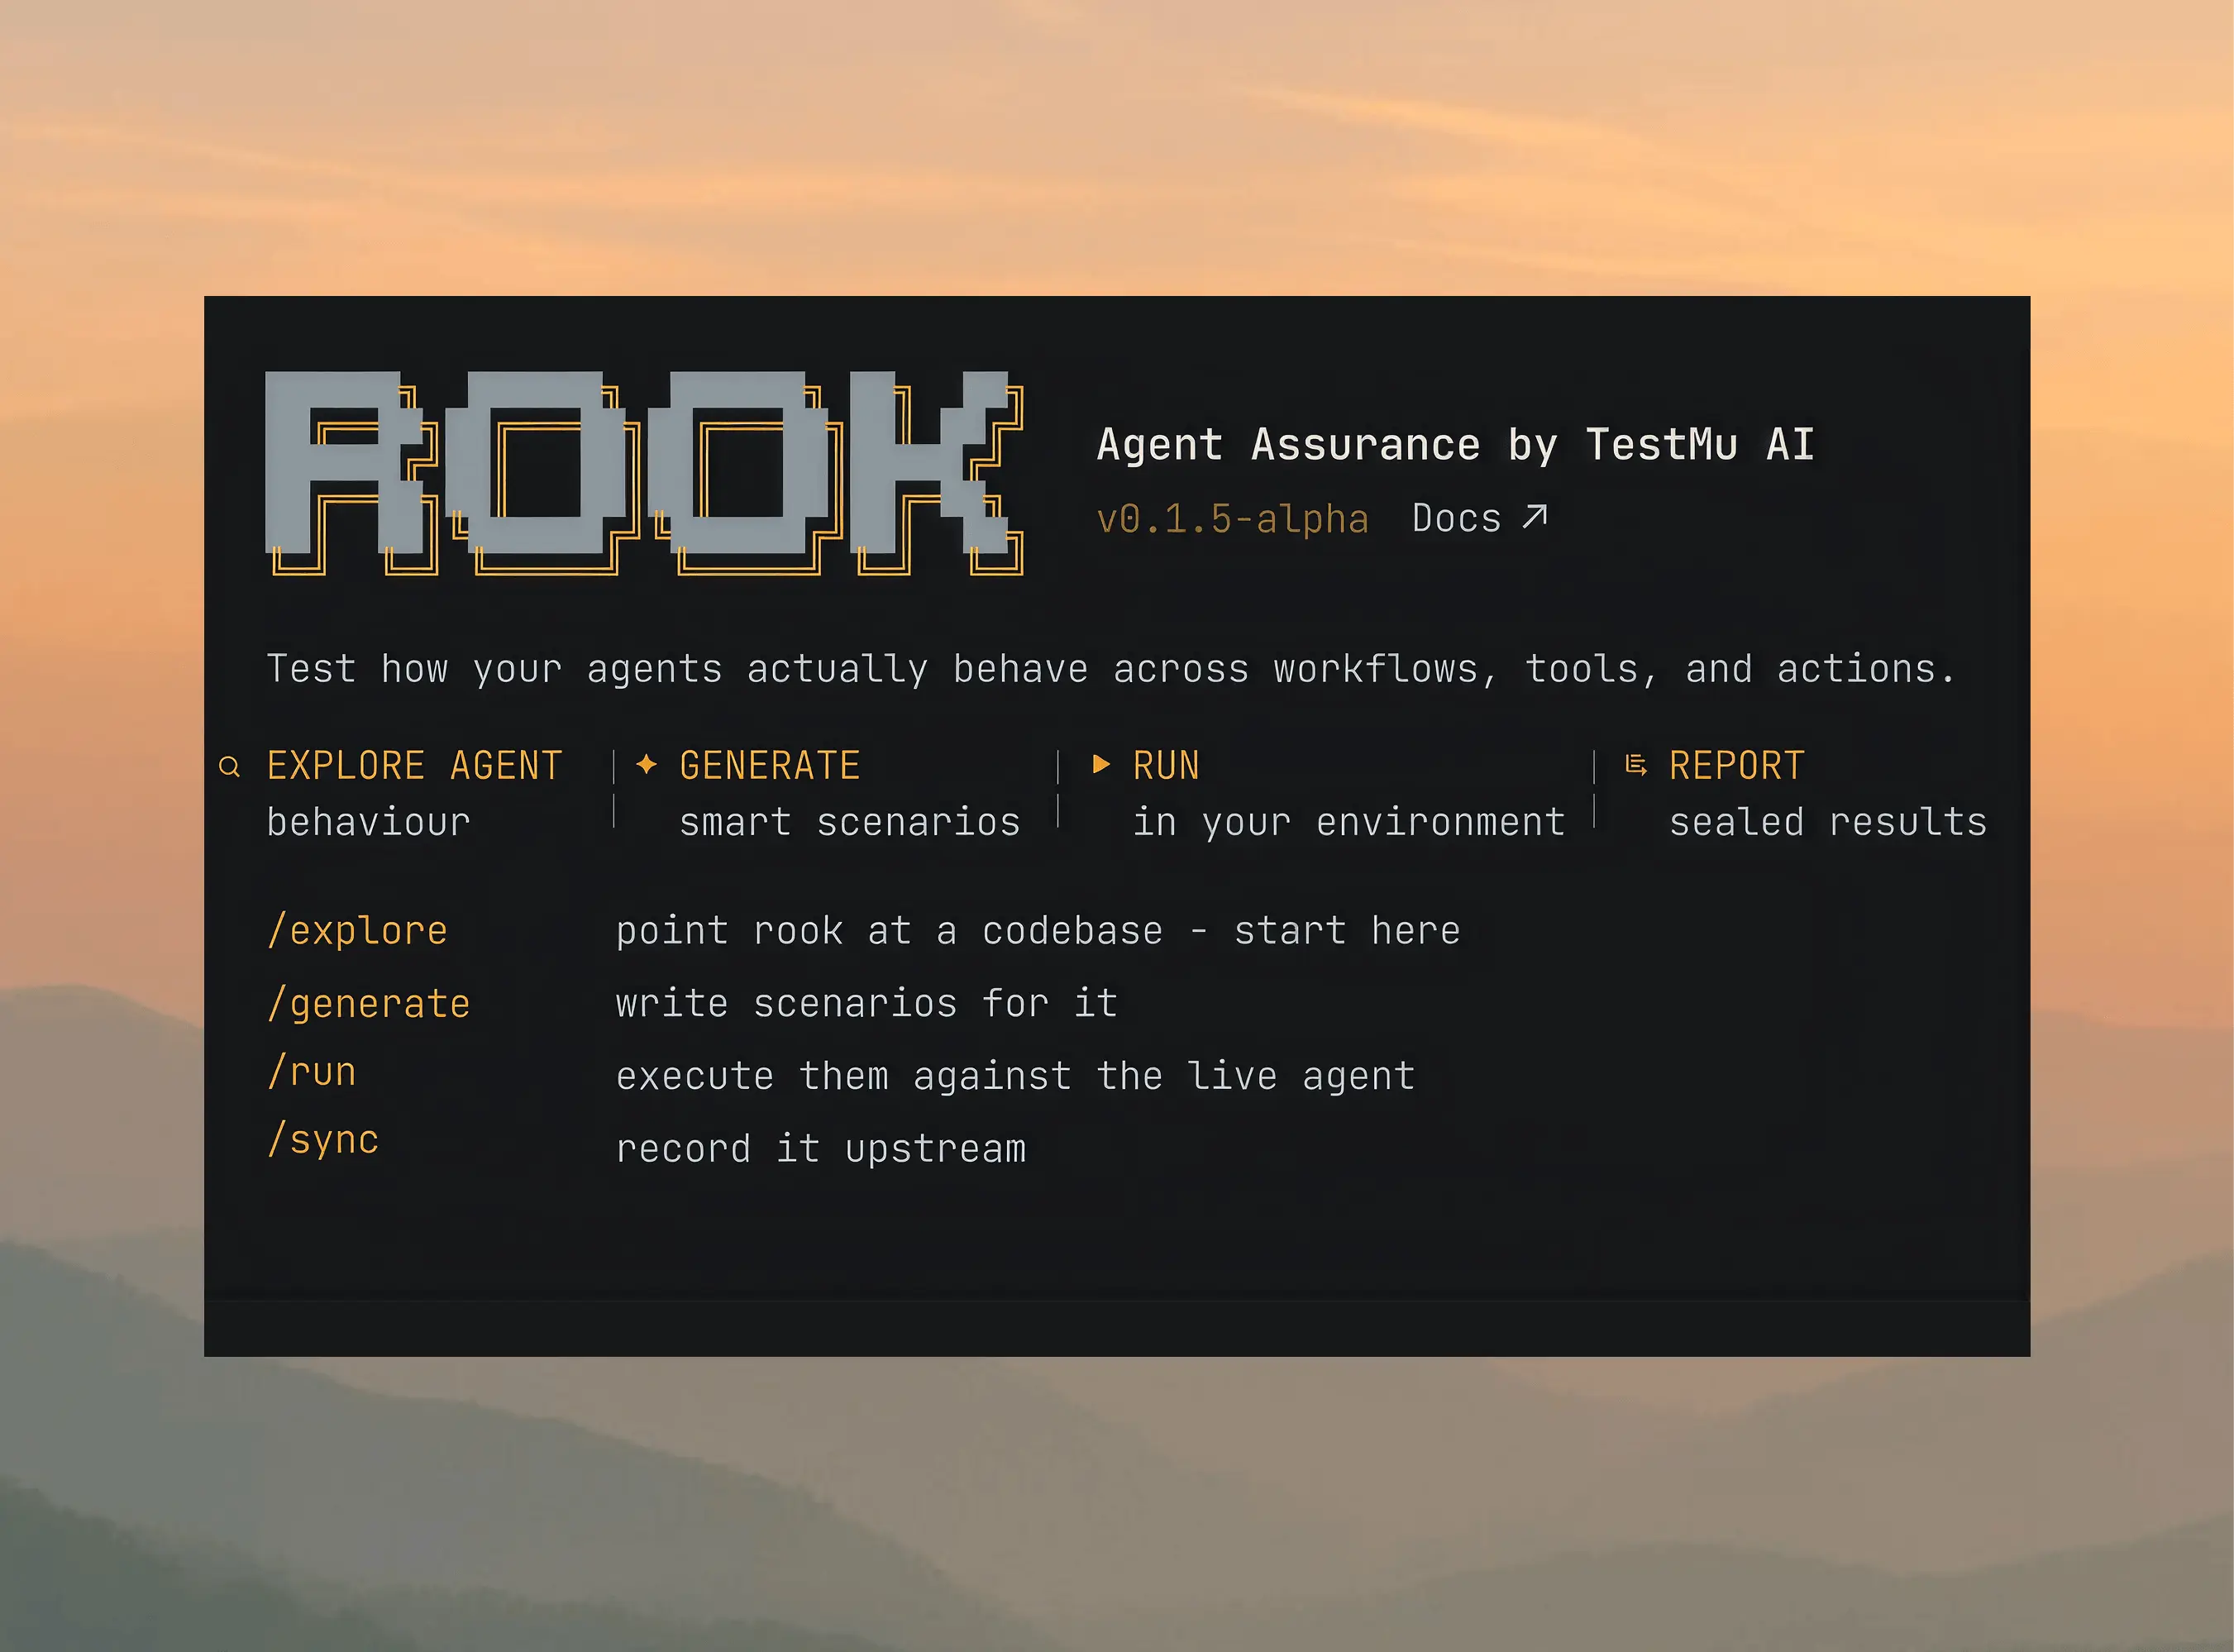
Test how your agents actually behave across workflows, tools, and actions. Catch failures and vulnerabilities before they ship.
npm install -g @testmuai/rook
- TestMu AI (Formerly LambdaTest)
- /
- Learning Hub
- /
- AI Hallucination Rate: What Each Benchmark Measures
AI Hallucination Rate: What Each Benchmark Measures
An AI hallucination rate divides wrong answers by a count each benchmark picks. See what AA-Omniscience, Vectara, FACTS and SimpleQA Verified count, by model.
Published on:
OVERVIEW
Suppose two engineers each open a leaderboard on the same morning to find the model that hallucinates least. One comes back with Gemini 4 Argon, which has the lowest AA-Omniscience hallucination rate of any model that gets a large share of its questions right; the other finds the same model in row 83 of the 109 on Vectara's hallucination leaderboard.
Both readings are correct, because the two boards count different things. One divides wrong answers by the questions a model did not get right, and the other judges summaries of documents the model was handed.
This guide reads four published hallucination benchmarks the same way: what is counted as wrong, what it is divided by, and where the declined questions went. The per-model tables further down are each dated with the day they were read.
Overview
An AI hallucination rate is the count of outputs a grader marks wrong or unsupported, divided by a denominator each benchmark chooses. AA-Omniscience, Vectara and SimpleQA Verified use different tasks, denominators and rules for declined answers, so their rates cannot be compared directly; on AA-Omniscience alone, 264 model settings ranged from 0.9% to 98.5% on 2026-10-20.
How Each Hallucination Benchmark Counts
- AA-Omniscience hallucination rate: Artificial Analysis divides incorrect answers by all answers that were not correct, across 6,000 questions in six domains, so declining more questions lowers a model's AA-Omniscience rate.
- Vectara hallucination leaderboard: Vectara's HHEM-2.3 model judges summaries of supplied documents, and its table, last updated on October 16, 2026, lists 109 rows from 1.8% to 24.2%.
- Does Vectara's leaderboard test recall from memory?: No. Vectara's hallucination leaderboard scores summaries of a supplied document, so a low Vectara rate says little about how a model answers without a source.
- SimpleQA Verified wrong-answer share: Epoch AI reports accuracy on 1,000 SimpleQA Verified questions, and one minus that accuracy counts wrong answers plus declined ones.
- SimpleQA Verified runs before 2026-08-27: SimpleQA Verified runs that started before Epoch AI added an instruction to guess may include declined answers, so their wrong-answer shares, computed as one minus accuracy, are upper bounds.
- Worked example, Claude Opus 5.5: Claude Opus 5.5 (max with fallback) had a 58.6% AA-Omniscience rate and 66.2% accuracy on 2026-10-20, so it answered 19.8% of all questions wrongly.
What Published Hallucination Rates Show
- Does a lower hallucination rate mean a more accurate model?: No. A low AA-Omniscience rate does not mean high accuracy: MiniCPM5-1B (non-reasoning) had the lowest rate, 0.9%, with 0.1% accuracy, while the most accurate model ranked 120th of 264.
- Do AI hallucination leaderboards agree with each other?: No. Vectara's summarization rates and Epoch AI's SimpleQA Verified wrong-answer shares had a Spearman rank correlation of -0.07 across 32 models matched on both boards.
- AA-Omniscience against SimpleQA Verified: Converted to wrong answers over all questions, AA-Omniscience agreed with SimpleQA Verified at a Spearman correlation of 0.57 across 23 shared models, against 0.21 for the raw rate.
- Do reasoning models hallucinate more?: Not consistently. Reasoning raised the AA-Omniscience hallucination rate for 15 of 30 models listed with reasoning on and off, and raised accuracy for 28.
- Action hallucination in AI agents: TestMu AI's Agent Assurance runs the real agent before release and gives each acceptance criterion a Pass, Fail or Unable to Verify verdict, never treating an agent's claim that it acted as proof.
What Is an AI Hallucination Rate, and What Does It Divide By?
An AI hallucination rate is the number of outputs a grader marks as wrong or unsupported, divided by a count of outputs that the benchmark chooses. What counts as an AI hallucination differs between benchmarks, from a wrong answer to a claim a summary cannot support, and the denominator differs even more.
Published figures span almost the whole scale. The Responsible AI chapter of Stanford HAI's 2026 AI Index reports that "hallucination rates across 26 top models range from 22% to 94%" on AA-Omniscience, with gpt-oss-20B (high) at 94% and Grok 4.20 Beta 0305 at 22%.
Which denominator a benchmark picks decides what behavior a low rate rewards.
| Denominator | Where it is used | What a low rate rewards |
|---|---|---|
| All questions or items | Epoch AI's SimpleQA Verified runs, read as one minus accuracy; most in-house test sets | Fewer wrong answers overall, whether the model answered or declined the rest |
| Answers that were not correct | The AA-Omniscience hallucination rate | Declining instead of guessing when the model does not know |
| Attempted answers only | The complement of attempted accuracy, a secondary metric in FACTS Parametric | Being right whenever it answers; declining many questions costs nothing |
| Summaries of supplied documents | Vectara's leaderboard, scored on documents every model summarized | Staying faithful to a source, with no test of recall from memory |
| Conversations or turns | Dashboards for deployed chatbots and assistants | Depends on how the team defines a turn and which turns it samples |
For a deployed chatbot, the per-conversation formula and how to sample turns are covered in the guide to chatbot metrics. This page deals with the published model rates and how to read them.
How AA-Omniscience, Vectara HHEM, FACTS and SimpleQA Verified Count Hallucinations
AA-Omniscience, from Artificial Analysis, asks 6,000 questions across six domains. Its AA-Omniscience benchmark page defines the hallucination rate as "the proportion of incorrect answers out of all non-correct responses, i.e. incorrect / (incorrect + partial answers + not attempted)" and accuracy as correct answers "out of all questions, regardless of whether the model chooses to answer". The AA-Omniscience paper names Gemini 2.5 Flash Preview (09-2025) with reasoning as the grading model.
Vectara's leaderboard hands each model a document and asks for a summary that uses only the facts in it; Vectara's own detector model then flags summaries that add unsupported claims. That is a test of groundedness, staying inside a supplied source, and Vectara's README says it filters out refusals and very short replies before scoring.
The FACTS Leaderboard paper from Google DeepMind and Google Research (December 2025) averages four parts: Grounding, Parametric, Search and Multimodal. Its Parametric part grades each answer as correct, incorrect, not-attempted or unknown, using three Gemini-2.5-Pro grades per answer, and reports accuracy first, with hedging rate, attempted accuracy and F1 as secondary metrics.
SimpleQA Verified is a 1,000-question revision of SimpleQA's short fact-seeking questions. Epoch AI runs it on new models and, per its SimpleQA Verified benchmark page, reports the share answered correctly, with an instruction added on 2026-08-27 that tells models there is no penalty for being wrong.
| Benchmark | Task | Grader | Published rate's denominator | Declined answers |
|---|---|---|---|---|
| AA-Omniscience | Answer knowledge questions in six domains from memory | Gemini 2.5 Flash Preview (09-2025) with reasoning | Answers that were not correct | Counted in the denominator, so declining lowers the rate |
| Vectara hallucination leaderboard | Summarize a supplied document using only its facts, temperature 0 where possible | HHEM-2.3, Vectara's commercial detector; HHEM-2.1-Open is the open variant | Summaries of documents that every model summarized | Filtered out and shown separately as the answer rate |
| FACTS Parametric | Answer 2,104 fact-recall questions from memory, half of them private | Gemini-2.5-Pro, three grades averaged per answer | Accuracy is over all questions; attempted accuracy is over answered ones | Count against accuracy and are reported as the hedging rate |
| SimpleQA Verified, run by Epoch AI | Answer 1,000 short fact-seeking questions from memory | A grader model checks each answer for the correct piece of information | Accuracy over all questions; one minus accuracy is wrong plus declined | Rare in runs since 2026-08-27, when the prompt began asking the model to guess |
Three of these rows test recall from memory and one tests faithfulness to a source, so a model can lead one board and trail another without any contradiction. The full FACTS suite also adds grounding, search and image tasks. Knowledge benchmarks such as MMLU draw on memory too, but they ask multiple-choice questions and report accuracy alone.
How to Put Hallucination Rates on One Denominator
The AA-Omniscience rate divides by the answers that were not correct, and that share of all questions is one minus accuracy, so multiplying the two gives wrong answers over all questions. On the Artificial Analysis models leaderboard, read on 2026-10-20, Claude Opus 5.5 (max with fallback) had 66.2% accuracy and a 58.6% rate, so it answered 19.8% of all questions wrongly.
// AA-Omniscience reports, per model:
//   accuracy = correct / all questions
//   rate     = incorrect / (all - correct)
// so incorrect over all questions is:
const wrongOverAll = rate * (1 - accuracy);

// Claude Opus 5.5 (max with fallback), read 2026-10-20
0.586 * (1 - 0.662); // 0.198, so 19.8%
A script run on 2026-10-20 applied that conversion to every model on the leaderboard and compared the two rankings. The analysis ran these Node.js scripts that day, using built-ins only, against saved copies of the public pages; they produced every console output quoted in this guide:
node extract-aa.mjs
node analyze.mjs
node tables.mjs
node facts-parametric.mjs
node wilson.mjs
The first part of the analysis output, unedited:
Hallucination leaderboards, read 2026-10-20
AA-Omniscience models             264
Vectara HHEM models (October 16, 2026) 109
Epoch SimpleQA Verified runs       91

AA-Omniscience: rate vs wrong over all questions
Model                   Acc   Rate  Wrong/all Rank
Claude Fable 5.1 max   67.2   72.6    23.8 120>46
Claude Opus 5.5 max    66.2   58.6    19.8  91>29
Claude Fable 5.1 xhigh 66.2   70.5    23.8 117>47
Claude Opus 5.5 xhigh  65.4   65.7    22.7 103>42
Claude Fable 5.1 high  64.9   68.8    24.1 113>50
...lowest rates:
MiniCPM5-1B non-r       0.1    0.9     0.9   1>1
G9v3-3B                 6.5   11.7    10.9   2>3
G9v3-39A5B             14.9   13.0    11.1   3>4
Models moving 50+ places: 39 of 264
Spearman, rate vs wrong/all:      0.88
Spearman, rate vs accuracy: -0.19- Accuracy and rate pull apart - in the script's output, the five most accurate models are all Claude Fable 5.1 and Claude Opus 5.5 settings, and each ranks between 91st and 120th of 264 by hallucination rate.
- The conversion reorders them - by wrong answers over all questions, the same five rank between 29th and 50th, and 39 of the 264 entries move 50 or more places.
- Lowest rate at near-zero accuracy - MiniCPM5-1B (non-reasoning) stays first under both rules with 0.1% accuracy, so read either number beside accuracy before choosing a model.
- Rate says little about knowledge - Spearman's rank correlation between the rate and accuracy is -0.19, while the rate and the converted figure correlate at 0.88.
A different conversion works for FACTS Parametric: wrong over all questions is the attempted share minus accuracy, as the dated FACTS table below shows. Vectara's rate already uses summaries as its denominator, and Epoch AI's accuracy is already over all questions, so neither needs converting.
How to Measure the Hallucination Rate of Your Own AI System
None of the public boards uses your prompts, documents or tools, so measure the rate on your own task with a grader you have checked. A golden dataset of real inputs with reviewed criteria is the place to start.
- Fix the unit and the denominator - decide whether you count answers, claims inside answers or actions, and write the denominator down before the first run.
- Keep three counts - record correct, wrong and declined for every item, so you can report wrong over all items, wrong over attempted items and the decline rate side by side.
- Pick a grader you can check - exact match for short facts, a claim-level check against your source for retrieval answers, or a model judge with a rubric; the methods are compared in LLM hallucination detection.
- Calibrate the grader - hand-label a sample, compare it with the grader's verdicts, and revise the rubric on every item where the two disagree, before you trust any rate.
- Record the setting - model version, reasoning effort, temperature, tools and retrieval index belong in every result, since the reasoning section below shows effort settings moving AA-Omniscience rates in both directions.
- Rerun on every change - score the same items after a model, prompt, retrieval or tool change and compare them item by item.
For summaries and retrieval answers, Vectara's open HHEM-2.1-Open model card describes a classifier that reads premise and hypothesis pairs and outputs a consistency score from 0 to 1, where 0 means the hypothesis is not evidenced at all by the premise. The card says it runs on consumer-grade hardware, under the Apache-2.0 license.
Report each rate with an interval, because a small set gives wide bounds. The NIST/SEMATECH e-Handbook page on confidence intervals for proportions describes the Wilson method and warns that symmetric normal-approximation limits may not be accurate enough when failures are few or the sample is small; a script run on 2026-10-20 gave these 95% Wilson intervals:
wrong  graded  rate   95% Wilson interval
    3      50   6.0%   2.1% to 16.2%
   12     300   4.0%   2.3% to 6.9%
40 1000 4.0% 3.0% to 5.4%- Reading the interval - at 300 graded answers, a measured 4.0% could sit anywhere from 2.3% to 6.9%, so grow the set before you rank two systems that are a point or two apart.
For agents that talk to people rather than act on systems, TestMu AI's Agent Testing tests chat, voice, phone, video and image agents, and for chat and voice agents it scores a Hallucination Detection metric, which flags information the agent states that nothing in its knowledge base or context backs up.
LLM Hallucination Rates by Model: Dated Tables for Each Leaderboard
Each table below is dated with the day it was read, and model names are written the way each source lists them. No model leads every board, so the answer to which AI model hallucinates the least changes with the benchmark you trust for your task.
AA-Omniscience Hallucination Rates by Model
Artificial Analysis publishes per-model AA-Omniscience scores on its leaderboard pages; the AA-Omniscience-Public dataset on Hugging Face holds 600 of the questions and no model scores. The rows below were read from the models leaderboard on 2026-10-20, and the last-but-one column is the script's conversion.
| Model (AA-Omniscience, read 2026-10-20) | Accuracy | Hallucination rate | Wrong over all questions | Rank by rate, of 264 |
|---|---|---|---|---|
| MiniCPM5-1B (non-reasoning) | 0.1% | 0.9% | 0.9% | 1 |
| G9v3-3B | 6.5% | 11.7% | 10.9% | 2 |
| G9v3-39A5B | 14.9% | 13.0% | 11.1% | 3 |
| Command A+ | 8.9% | 14.2% | 12.9% | 4 |
| Gemini 4 Argon (high) | 49.9% | 15.1% | 7.5% | 5 |
| Muse Wonder Full (max) | 43.2% | 23.0% | 13.1% | 14 |
| Claude Opus 5.5 (max with fallback) | 66.2% | 58.6% | 19.8% | 91 |
| Claude Fable 5.1 (max with fallback) | 67.2% | 72.6% | 23.8% | 120 |
| gpt-oss-20b (high) | 16.0% | 94.1% | 79.0% | 241 |
| Qwen3.5 0.8B (non-reasoning) | 5.0% | 98.5% | 93.6% | 264 |
- Lowest rate with useful accuracy - Gemini 4 Argon (high) is the only model among the five lowest rates that answers about half the questions correctly, and it has the fewest wrong answers over all questions of any model above 1% accuracy.
- The AI Index range has widened - the 2026 AI Index range covered 26 models; the leaderboard read on 2026-10-20 lists 264 model settings, from 0.9% to 98.5%, and still shows gpt-oss-20b (high) at 94.1%.
- No date on the page - the AA-Omniscience page carried no as-of date when read, so record the day you read it next to any figure you reuse.
Vectara Hallucination Leaderboard Rates by Model
The README of Vectara's hallucination leaderboard repository was last updated on October 16, 2026 and lists 109 rows, from 1.8% to 24.2%; it was read on 2026-10-20. Its dataset of more than 7,700 articles is not public, and the answer rate column shows how often a model produced a summary at all.
| Model, as Vectara lists it (read 2026-10-20) | Hallucination rate | Answer rate | Row, of 109 |
|---|---|---|---|
| antgroup/finix_s1_32b | 1.8% | 99.5% | 1 |
| openai/gpt-5.4-nano-2026-03-17 | 3.1% | 100.0% | 2 |
| google/gemini-2.5-flash-lite | 3.3% | 99.5% | 3 |
| microsoft/Phi-4 | 3.7% | 80.7% | 4 |
| meta-llama/Llama-3.3-70B-Instruct-Turbo | 4.1% | 99.5% | 5 |
| openai/gpt-6-sol | 6.5% | 100.0% | 29 |
| openai/gpt-6-astra | 8.7% | 100.0% | 45 |
| google/gemini-4-argon | 12.1% | 99.1% | 83 |
| openai/o3-pro | 23.3% | 100.0% | 107 |
| mistralai/ministral-3-3b-2512 | 24.2% | 74.3% | 109 |
- Summarization leaders are not recall leaders - two of Vectara's five lowest rates belong to models with AA-Omniscience rates above 80%: Phi-4 at 81.2% and Llama 3.3 70B at 90.2%.
- Answer rate matters - Phi-4 summarized 80.7% of documents, and Vectara's README says it scores only documents that every model summarized, so a document that one model refuses drops out of every model's score.
- Row numbers - rows are sorted by rate and several models share a value, so a row number is a position in the table rather than a strict rank.
SimpleQA Verified and FACTS Results Beside AA-Omniscience and Vectara
Epoch AI publishes its benchmark results under the Creative Commons Attribution license in Epoch AI's benchmark data download; the SimpleQA Verified file in it, read on 2026-10-20, held 91 runs, the newest started on 2026-10-15. Three models could be matched at one setting on all three boards, shown here with the SimpleQA Verified wrong share as one minus Epoch AI's accuracy:
| Model (read 2026-10-20) | AA-Omniscience rate | AA wrong over all questions | Vectara rate | SimpleQA Verified wrong share |
|---|---|---|---|---|
| Gemini 4 Argon | 15.1% | 7.5% | 12.1% | 24.0% |
| GPT-6 Astra | 51.3% | 19.2% | 8.7% | 24.4% |
| Gemini 3.1 Pro Preview | 50.9% | 23.0% | 10.4% | 26.5% |
- Settings - Epoch AI ran both Gemini models at the high setting and GPT-6 Astra at max, the AA-Omniscience row for GPT-6 Astra is its max setting, and Vectara lists no setting for these three.
- Margins - Epoch AI publishes a standard error for each run, and the 95% intervals around the three SimpleQA Verified wrong shares overlap.
- Three boards, three orders - Gemini 4 Argon leads on AA-Omniscience and SimpleQA Verified, while GPT-6 Astra has the lowest Vectara rate of the three.
The newest FACTS figures this guide could read are the tables in the FACTS paper, read on 2026-10-20; the live Kaggle leaderboard did not return rows to a script. FACTS scores accuracy, so a higher number is better, and the paper's Parametric table also gives the hedging rate, which the conversion turns into wrong answers over all questions:
FACTS Parametric, Table 6 (read 2026-10-20)
Model              Acc  Hedge  Wrong/all  F1>W
Gemini 3 Pro       76.4   1.4      22.2    1>2
Gemini 2.5 Pro     63.2   1.9      34.9    2>6
Grok 4             58.5   7.9      33.6    3>4
GPT-5              55.7  13.3      31.0    4>3
o3                 57.0   1.9      41.1    5>9
GPT-4.1            51.5   3.8      44.7   6>10
GPT-5.1            43.2  11.3      45.5   7>11
Claude 4.1 Opus    33.2  29.9      36.9    8>7
Claude 4.5 Sonnet  28.9  31.3      39.8    9>8
Claude 4.5 Opus    30.5  14.0      55.5  10>12
Gemini 2.5 Flash   30.6   5.1      64.3  11>13
Claude 4 Sonnet    20.3  45.1      34.6   12>5
GPT-5 mini         16.0  67.6      16.4   13>1
o4 mini            20.4  10.5      69.1  14>14
Grok 4 Fast        15.7  14.4      69.9  15>15
rows: 15 (rank: paper order by F1 > by wrong/all)- Low accuracy, fewest wrong answers - GPT-5 mini sits 13th of 15 in the paper's F1 order with 16.0% accuracy, yet it hedged on 67.6% of questions and, in the script's conversion, gave the fewest wrong answers over all questions, 16.4%.
- Hedging changes the order - Claude 4 Sonnet moves from 12th to 5th after the conversion, and Gemini 2.5 Pro drops from 2nd to 6th.
- Assumption - the conversion treats every attempted answer that was not correct as wrong; the paper does not report how often the unknown grade occurs, and any unknown grades would lower these figures.
Do Hallucination Leaderboards Agree on Which Model Is Best?
A script run on 2026-10-20 matched models by name across AA-Omniscience, Vectara and SimpleQA Verified, reading the SimpleQA Verified rows from the same Epoch AI data file. It then computed Spearman's rank correlation for each pair of boards, with a 95% interval:
Rank agreement (Spearman, 95% interval)
Pair                       n    rho   interval
AA rate / Vectara         18   0.17  -0.34 to 0.60
AA wrong/all / Vectara    18   0.33  -0.18 to 0.70
Vectara / SQV wrong       32  -0.07  -0.42 to 0.30
AA rate / SQV wrong       23   0.21  -0.23 to 0.58
AA wrong/all / SQV wrong  23   0.57   0.19 to 0.80

Models on all three boards   AA    AA w/a  Vect  SQV w
Gemini 4 Argon            15.1   7.5  12.1  24.0
GPT-6 Astra               51.3  19.2   8.7  24.4
Gemini 3.1 Pro Prev 50.9 23.0 10.4 26.5- Summarization and recall disagree - in the script's output, Vectara and SimpleQA Verified rank their 32 shared models with a correlation of -0.07, so the order on one board says nothing about the order on the other.
- One denominator raises agreement - AA-Omniscience and SimpleQA Verified agree at 0.21 on the raw rate and at 0.57 after the conversion, the only interval in the output that excludes zero.
- Small overlaps, wide intervals - with 18 to 32 shared models, every interval is at least 0.6 wide, so treat each coefficient as a rough direction only.
- Matching rules - the script pairs models through a hand-built name map; where only one source names a setting, that setting was used, and models listed at more than one setting on one board, such as Gemma 4 31B and Claude Sonnet 4.6, were left out. Vectara lists no effort setting for most models. The Mistral Large 4 pair joins the Mistral Large 4 Preview row on AA-Omniscience to Epoch AI's mistral-large-4-0_high run, which may be a different build.
- Runs before the guess instruction - 12 of the 91 SimpleQA Verified runs in the file started on 2026-08-10, before the 2026-08-27 date from which Epoch AI says it adds the guess instruction, and 8 of them feed the comparisons here, among them Gemini 3.1 Pro Preview (high) and GPT-5.6 Terra (max). The file does not say whether those runs used the instruction, so for them one minus accuracy is an upper bound on the wrong share.
Rank correlation compares order rather than values, which suits boards on different scales. For what the remaining public leaderboards test, see the overview of LLM benchmarks. GDPval, for example, has occupation experts grade finished work files, such as a slide deck or a spreadsheet, rather than single facts.
Do Reasoning Models Hallucinate More?
Not as a rule. The AA-Omniscience paper reports, in its section on model size, that "Larger models do not consistently exhibit lower hallucination rates", and reasoning shows a similar split: the script compared every model the leaderboard lists with reasoning on and off, pairing each non-reasoning entry with the same model's highest listed reasoning setting, and every model it lists at several effort settings.
AA: same model, reasoning on vs off (30 pairs)
  rate higher with reasoning      15 of 30
  accuracy higher with reasoning  28 of 30
  wrong/all higher with reasoning 9 of 30
AA: lowest vs highest effort, same model
rate higher at top effort: 9 of 20| Model | Board (read 2026-10-20) | Lower setting | Higher setting | Change |
|---|---|---|---|---|
| DeepSeek V4.1 Flash | AA-Omniscience rate | Non-reasoning, 54.0% | Max, 96.5% | +42.5 points |
| Qwen3.6 35B A3B | AA-Omniscience rate | Non-reasoning, 92.1% | Reasoning, 50.5% | -41.6 points |
| GLM-5.3 | AA-Omniscience rate | Low, 64.0% | Max, 29.6% | -34.4 points |
| GPT-6 Astra | AA-Omniscience rate | Low, 46.9% | Max, 51.3% | +4.4 points |
| grok-4-fast | Vectara rate | Non-reasoning, 19.7% | Reasoning, 20.2% | +0.5 points |
| gpt-5.2 | Vectara rate | Low, 8.4% | High, 10.8% | +2.4 points |
| o4-mini | Vectara rate | Low, 18.6% | High, 18.6% | No change |
| gpt-5.2 | SimpleQA Verified wrong share | Low, 67.2% | Xhigh, 62.9% | -4.3 points |
- Reasoning mostly buys accuracy - in the script's output, in 28 of the 30 AA-Omniscience pairs the reasoning version answered more questions correctly, and in 21 it gave fewer wrong answers over all questions.
- The rate moves both ways - reasoning raised the AA-Omniscience rate for 15 pairs and lowered it for 15, and the top effort setting raised it for 9 of 20 models.
- Summaries lean the other way - all six reasoning or higher-effort versions on Vectara's leaderboard scored the same or worse than their lighter versions, by 0 to 2.4 points.
Compare two rates for one model only at the same effort setting, because one model name can cover very different rates depending on how long it is allowed to think.
AI Agents That Act: Hallucination Rates and Testing With Agent Assurance
Every rate above grades text against a reference: a gold answer or a source document. When an agent says it refunded an order or closed a ticket, there is no passage to check that claim against, so a model's text hallucination rate tells you nothing about whether the action happened. The guide to agent action hallucination covers how false completion reports show up in traces.
For that kind of agent, track how many acceptance criteria survive a check against the state the run left behind. Agent Assurance, from TestMu AI, is built for that job: it tests agents that call tools and change systems before they ship, and its command-line tool, Rook CLI, is in pre-alpha and anyone can install it from npm:
npm install -g @testmuai/rookThe npm route needs Node.js version 20 at minimum, and Rook CLI installs on macOS and Linux, and 64-bit Windows through npm or WSL. The Homebrew and checksum-checking shell script routes, both for macOS and Linux, need no Node; the Rook CLI installation guide covers each option.
Agent Assurance starts from the agent's source code (or, when that is unavailable, its spec or API description) and generates scenarios, each with its own acceptance criteria. Unless you ask for other classes it plans functional and adversarial scenarios, and one adversarial category targets hallucination. Runs invoke the real agent from CI or against a staging environment, because the agent's writes are real and nothing rolls them back.
- Disk state - which files under the profile's declared paths were created or edited, and which artifacts came out of the run.
- Observed calls - the tool calls the run records, matched against the tools the agent says it has, with must-not-call rules applied.
- System of record - read-only queries against the systems the agent wrote to, through an MCP tool you provide and approve, a status endpoint or a collect hook.
A model judge handles some criteria, but an agent saying it acted is never treated as proof on its own. Each criterion gets one of three verdicts (Pass, Fail, Unable to Verify), and only scenarios that reached a decided verdict enter the scenario pass rate, which keeps missing evidence visible as a coverage gap; the Agent Assurance results and evidence page explains the report fields.
Most eval and observability tools grade the words and traces an agent records, while Agent Assurance inspects what the run changed and names whatever it could not confirm. Agent Assurance tests your agent, so it does not output a model hallucination rate, and it does not watch production traffic.
Author

Samyak Goyal
Blogs: 32

Samyak Goyal is a Senior Member of Technical Staff at TestMu AI engineering Kane CLI, the command-line tool that runs browser automation from the terminal, where a flow described in natural language executes in a real Chrome browser and returns pass or fail with shareable proof. He is a backend engineer with 4+ years of experience, previously an SDE at Innovaccer, where he built APIs, introduced Kafka, and cut deployment from weeks to hours. Samyak also builds multi-agent systems, skill-orchestration frameworks, and a personal copilot that indexes 200+ microservice repositories.
Reviewer

Sirajuddin Khan
Reviewer
Sirajuddin Khan is Vice President of Product Management at TestMu AI, where he drives the company's agentic AI product strategy, building a suite of autonomous agents that includes Agentic Browsers and Agentic Visual Testing and shifting the unit of work from test execution to autonomous outcomes. One of the company's earliest product leaders, he has owned the roadmap for the high-performance execution cloud and grew the cross-browser testing products from early adoption to market leadership. He brings over a decade of experience across SaaS, B2B, and eCommerce, with earlier product roles at Wydr and ShopClues, where his catalog and search work cut delivery SLAs and lifted seller activity. Sirajuddin holds an MBA in Information Technology from Sikkim Manipal University and a B.Tech in Computer Science Engineering from Maharshi Dayanand University.


AI Hallucination Rate FAQs
Did you find this page helpful?
More Related Learning Hubs

TestMu AI forEnterprise
Get access to solutions built on Enterprise
grade security, privacy, & compliance
- Advanced access controls
- Advanced data retention rules
- Advanced Local Testing
- Premium Support options
- Early access to beta features
- Private Slack Channel
- Unlimited Manual Accessibility DevTools Tests