

Power Your Software Testing with AI Agents and Cloud
The Native AI-Agentic Cloud Platform to Supercharge Quality Engineering. Test Intelligently and Ship Faster.


- TestMu AI (Formerly LambdaTest)
- /
- Blog
- /
- What Is JavaScript Doing On Your Page?
What Is JavaScript Doing On Your Page?
JavaScript runs your page on one call stack inside an engine such as V8. See how parsing, the event loop, the microtask queue, and async callbacks fit together.
Last Updated on:
JavaScript on your page runs inside an engine such as V8, which parses your code and executes one function at a time on a single call stack. Because that stack is single threaded, any task holding it for 50 milliseconds or more counts as a long task in Chrome DevTools and delays the next render. This guide covers the JavaScript engine, the call stack, how the compiler works, how to see what JavaScript is doing on your page, the event loop, asynchronous callbacks, and AI tools that explain execution.
Key Takeaways
- A JavaScript engine such as Google's V8 runs a page using two parts, a memory heap where memory allocation takes place and a call stack where code execution takes place.
- JavaScript is single threaded and executes one call stack, so a long running function blocks the browser from rendering anything else until that function returns.
- The JavaScript compiler works in four steps: a scanner produces tokens, a parser builds a syntax tree, a translator outputs bytecode, and a bytecode interpreter turns the bytecode into native code.
- A performance trace recorded in Chrome DevTools shows which tasks held the main thread, and any uninterrupted stretch of 50 milliseconds or more counts as a long task.
- The event loop runs one task and then drains the whole microtask queue before the next render, so promise callbacks run ahead of the next setTimeout callback.
- Asynchronous callbacks, promises, and async/await keep a waiting result off the call stack so the browser can carry on executing other code and keep the user interface responsive.
JavaScript Engine
Google's V8 engine is one common example of a JavaScript engine. It runs inside Chrome, Node.js, and Deno, and it has two parts
- Memory Heap, where the memory allocation takes place
- Call stack, where the stack gets framed up during code execution
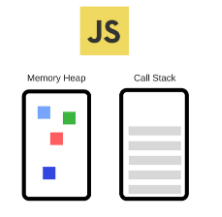
However, internally the V8 engine runs several threads
- The main thread fetches the code, compiles and then executes it
- A dedicated thread is for compiling, so that the main thread can do its job while the other optimizes the code.
- A profiler thread is there which tells the runtime about the methods on which we spend quite a lot of time so that they can be optimized.
- Garbage collector sweeps are handled by a few threads.
Before discussing on what happens at the call stack, let's find out how the process of rendering occurs.
- HTML is parsed and the DOM tree is constructed.
- Render tree is constructed
- Layout process of the render tree is executed
- Painting of the render tree is carried out, where the UX component gets rendered.
Key Takeaway: A JavaScript engine such as V8 pairs a memory heap for memory allocation with a call stack for code execution, and runs separate internal threads for compiling, profiling, and garbage collection.
The Call Stack
Being a single threaded program, only one call stack gets executed in JavaScript. It is a data structure that records the current state of the program. Once a function starts getting executed, it is placed at the top of the stack. And once return is called, the function is popped from the top. Let's take a look at the following example.
function multiply(a, b) { return a * b; }
function printSquare(a) { var s = multiply(a, a); console.log(s); }
printSquare(5);
Call stack will remain empty during code execution. Later, the following steps will be performed.
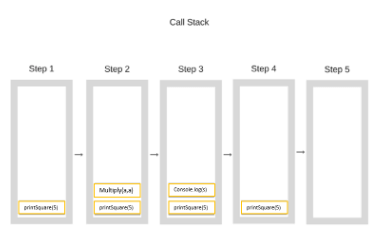
Each data entered in a call stack is called stack frame. The following events are common in call stack.
- Whenever an exception is thrown, a stack trace is constructed.
- Whenever the maximum size of the Call stack is exceeded, "blowing the stack" event occurs. This is very common when recursion is used without proper JavaScript unit testing.
- At some point, however, the maximum call stack size gets exceeded. The browser then decides to get into action by throwing Uncaught RangeError exception.
Execution of a single threaded code is easy and less complicated. Since in multi-threaded code executions, complications like deadlocks are very common. But running on a single thread also has its limits. Since a single call stack works in JavaScript, let's discuss what happens when the application is complex and the process gets really slow.
Key Takeaway: The JavaScript call stack records the state of the program by placing a function on top when it starts and popping it when it returns, and exceeding the maximum call stack size throws an Uncaught RangeError.
How the Compiler Works
JavaScript is considered to be a language having high level of flexibility and readable by human. A compiler transforms that code into a form that is readable by machine. JavaScript compiler works in a 4 step process
- A scanner scans the code which is then converted into tokens. This process is done using regular expression.
- The tokenized code is then parsed where its scope and structure is encoded into a syntax tree.
- The tree structure is passed through translator where it is converted into equivalent bytecode.
- The final phase is performed by the byte code interpreter which turns the byte code into native code and renders it in the browser.
Key Takeaway: The JavaScript compiler converts human readable code into machine readable form in four steps: a scanner tokenizes the code, a parser encodes scope and structure into a syntax tree, a translator produces bytecode, and a bytecode interpreter renders native code in the browser.
How Do You See What JavaScript Is Doing On Your Page?
Record a performance trace in Chrome DevTools and read the main thread track. It lists every task the engine ran, how long each task held the call stack, and which script the work came from. The browser counts any uninterrupted stretch where the main thread stays busy for 50 milliseconds or more as a long task, and those stretches are the moments when clicks and scrolls get no response.
You can collect the same signal from real sessions without opening DevTools. Register a PerformanceObserver on the entry type longtask and the browser hands you one entry per blocking task. Each entry carries an attribution list that reports the frame or container behind the task through containerId, containerName and containerSrc, which is enough to separate your own code from work running inside an embedded third-party frame.
An AI coding assistant can record the same trace for you. The Chrome DevTools team publishes chrome-devtools-mcp, a Model Context Protocol server that gives an agent control of a real Chrome instance. Its performance tools are performance_start_trace, performance_stop_trace and performance_analyze_insight, and the last of the three returns detail on a named insight such as LCPBreakdown from the insight set the recording produced. The agent opens the page, records the trace and reads those insights, so you review named tasks instead of guessing which script slowed the page down. The trace still comes from one browser on one machine, so treat what it reports as a starting point and confirm it against field data before you rewrite anything.
Key Takeaway: A Chrome DevTools performance trace, or a PerformanceObserver registered on the longtask entry type, names the script that held the main thread for 50 milliseconds or more, which is the work that leaves clicks and scrolls unanswered.
Event Loop and Concurrency
Imagine that the browser is dealing with a complex image transformation code written in JavaScript. In this case, the functions executed in the call stack are taking quite longer time to get processed. During that time, the browser has nothing to do, and it gets stuck, unable to render any other code. If your application has a smooth fluid user interface, this kind of issues may create a problem for the user experience.
That is not the end of the problem. When the browser is stuck doing nothing for a long time, it may stop being responsive and the browser may raise an alert, asking whether to wait or kill the page. When situations like this arise, most users choose to kill the page.
The event loop decides when the browser gets control back. It runs one task, then drains the whole microtask queue before the next render, so promise callbacks and queueMicrotask entries run ahead of the next setTimeout callback. Chrome reports the delay a user feels here as Interaction to Next Paint, the Core Web Vital that replaced First Input Delay, and Google rates 200 milliseconds or less at the 75th percentile as good.
There is however, a solution that can help in executing heavy code without causing any breakage in the UI. It can be done by asynchronous callbacks.
Key Takeaway: The event loop runs one task and then drains the entire microtask queue before the next render, so promise callbacks and queueMicrotask entries execute ahead of the next setTimeout callback.
Asynchronous Callbacks in JavaScript
A callback function deals with the execution of a function only when the result is ready. Meanwhile, JavaScript can carry out its normal code execution. Callbacks can be used efficiently in complex applications with the use of APIs where callback functions are provided which are to be executed later on.
Examples of callback APIs commonly used are
- Using server.use in express web server to register a middleware.
- Using addEventListener in a browser to register an event listener.
- Using fs.readfile to read the contents of a file.
If something goes wrong, the first argument in every callback function will throw an error. The name of this pattern is "error first callbacks". This means that for every declared callback, we need to check if there is an error in the first line. While working with nested callbacks, it creates quite a lot of problem.
Most current code replaces error first callbacks with JavaScript promises and async/await. An async function pauses at each await and resumes as a microtask, so the code reads in order while the call stack stays free for other work. Node.js also ships promise versions of its callback APIs, such as node:fs/promises for file reads, which moves error handling into one try/catch block instead of a check on the first argument of every nested callback.
If you have a basic understanding of programming concepts, JavaScript is quite an easy language to learn. And once you have a deep understanding of how it works, soon you will become an expert in creating a complex web application using JavaScript.
Key Takeaway: An asynchronous callback runs a function only once its result is ready so JavaScript can continue executing other code meanwhile, and promises with async/await replace error first callbacks by collecting error handling into a single try/catch block.
Can AI Tools Explain What JavaScript Is Doing On Your Page?
Yes. Chrome DevTools ships AI assistance powered by Gemini that reads what DevTools already recorded and explains it in the context of your own page.
The documented panels are Elements, where it explains element styles and layout, Network, where it reads request headers and diagnoses failures, Sources, where it clarifies what a script file does, and Performance, where it investigates page performance and Core Web Vitals. The Performance panel is the one that matters here, because it works on the same main thread track you recorded, so you can ask which task held the call stack instead of reading every stack frame yourself.
There are real limits. Chrome documents the feature as experimental, it is disabled by default and must be turned on in Settings, it requires signing in with a Google Account in a supported location, and Google states it may generate inaccurate information. It also reads one trace from one browser on one machine, which is not field data.
Treat these tools as a faster way to read the same evidence, not as a replacement for it. The call stack, the long task threshold of 50 milliseconds, and the microtask ordering still decide what your users feel. An assistant can point at the slow script, but you confirm the fix against real user measurements before you ship it.
Key Takeaway: Chrome DevTools AI assistance, powered by Gemini, explains a recorded performance trace in the Performance panel, but it is experimental, off by default, and reports on one local trace rather than field data.
Author

Arnab Roy Chowdhury
Blogs: 69


Arnab Roy Chowdhury is a community contributor with 10+ years of experience working across software development, web UI engineering, and technical content writing. Currently a Senior Consultant at Capgemini, he has hands-on experience in building and maintaining cross-browser compatible web interfaces using HTML5 and modern frontend practices. Arnab has also contributed as a freelance web developer and writer, combining practical development expertise with clear technical documentation. He holds a Bachelor’s degree in Computer Engineering.


JavaScript Execution FAQs
Did you find this page helpful?
More Related Blogs
TestMu AI forEnterprise
Get access to solutions built on Enterprise
grade security, privacy, & compliance
- Advanced access controls
- Advanced data retention rules
- Advanced Local Testing
- Premium Support options
- Early access to beta features
- Private Slack Channel
- Unlimited Manual Accessibility DevTools Tests