

Power Your Software Testing with AI Agents and Cloud
The Native AI-Agentic Cloud Platform to Supercharge Quality Engineering. Test Intelligently and Ship Faster.


- TestMu AI (Formerly LambdaTest)
- /
- Blog
- /
- Synthetic Monitoring with Kane CLI
In modern SRE, relying only on real-user monitoring means using production customers as unpaid QA. RUM is reactive, registering an outage only after traffic hits the error. Synthetic monitoring is proactive: it simulates complete end-to-end user journeys against live production apps on a recurring schedule.
Defining Synthetic Monitoring
By simulating critical business interactions like authentication, multi-tenant searches, cart additions, and payment processing, synthetic monitoring flags environment drift, certificate expirations, and third-party API degradation. It catches these problems before a real user ever encounters them.
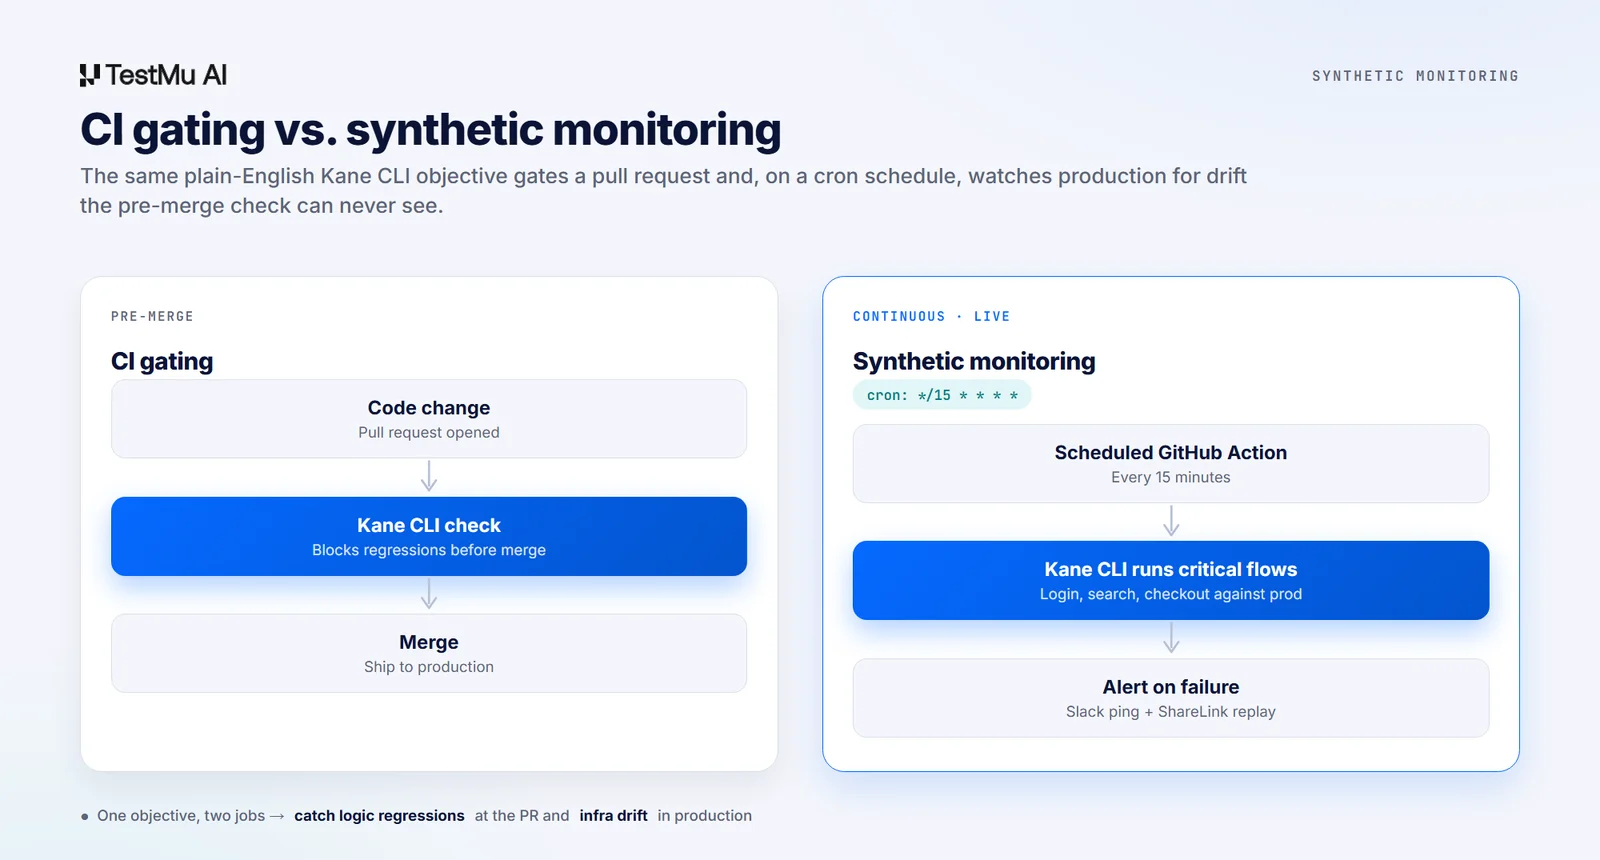
Pre-Merge CI Gating vs Scheduled Production Monitoring
Both run browser checks, but they serve different parts of the lifecycle. The distinction is about when each check runs and what kind of failure it is positioned to catch.
- CI gating: runs on pull requests to catch logical regressions before merge.
- Synthetic monitoring: runs continuously on a cron schedule against the live environment to catch infrastructure drift, CDN routing failures, database locks, and third-party API issues a pre-merge check can never see.
With Kane CLI you do not maintain two frameworks. The same plain-English objective that gates a PR drops into a GitHub Actions schedule, so the check that runs in CI/CD also runs your production monitor. For the one-off check right after each release, see smoke testing command line.

Note: Put your critical flows on a schedule and alert on the first failure. Start free. Try Kane CLI
Bundling Critical Business Flows Into a Central Script
Bundle your highest-value paths into an orchestration script so a failure on any journey triggers a non-zero exit for the whole run. Save it at monitoring/synthetic-monitor.sh.
#!/usr/bin/env bash
set -uo pipefail

FAILED=0

run_flow () {
  local name="$1"
  local objective="$2"
  echo "::group::${name}"
  kane-cli run "$objective" \
    --headless --agent --timeout 300 \
    --username "$LT_USERNAME" --access-key "$LT_ACCESS_KEY"
  local code=$?
  if [ "$code" -ne 0 ]; then
    echo "FAILED: ${name} (exit ${code})"
    FAILED=1
  fi
  echo "::endgroup::"
}

run_flow "login"    "go to https://myapp.com, log in as '{{user}}', assert the dashboard shows 'Welcome'"
run_flow "search"   "go to https://myapp.com, search for 'headphones', assert results appear"
run_flow "checkout" "go to https://myapp.com, complete checkout with a test card, assert the order confirmation page shows"

exit "$FAILED"
When asserting against live production, use dedicated isolated test accounts and read-only queries where possible. This avoids polluting analytics or triggering real charges.
Setting Up the Scheduled GitHub Actions Workflow
Write a scheduled workflow at .github/workflows/synthetic-monitoring.yml that runs every 15 minutes, provisions Chrome, and loads credentials from repository secrets. The schedule cron and the if: failure() alert step do the heavy lifting.
name: Synthetic Monitoring
on:
  schedule:
    - cron: '*/15 * * * *'
  workflow_dispatch:

jobs:
  monitor:
    runs-on: ubuntu-latest
    steps:
      - uses: actions/checkout@v4
      - uses: actions/setup-node@v4
        with:
          node-version: '20'
      - name: Install Chrome
        uses: browser-actions/setup-chrome@v1
      - name: Install Kane CLI
        run: npm install -g @testmuai/kane-cli
      - name: Run synthetic checks
        env:
          LT_USERNAME: ${{ secrets.LT_USERNAME }}
          LT_ACCESS_KEY: ${{ secrets.LT_ACCESS_KEY }}
        run: |
          chmod +x ./monitoring/synthetic-monitor.sh
          ./monitoring/synthetic-monitor.sh
      - name: Alert Slack on failure
        if: failure()
        env:
          SLACK_WEBHOOK_URL: ${{ secrets.SLACK_WEBHOOK_URL }}
        run: |
          curl -s -X POST -H 'Content-type: application/json' \
            --data '{"text":"Synthetic monitoring failed. Open the GitHub Actions run for the Kane CLI ShareLink."}' \
            "$SLACK_WEBHOOK_URL"
Proactive Failure Alerting and Triage
When a flow breaks, the script surfaces a non-zero exit, failing the step. The if: failure() step then fires an actionable Slack notification to the on-call channel.
Because Kane CLI captures video records and step-by-step logs for every run, the Actions log shows a secure ShareLink. On-call engineers click it to watch the failure replay, reducing MTTR.
Note: Want the agent mode and credentials setup behind this monitor? Read the Kane CLI docs. Read the docs
The same objective that runs every 15 minutes in production also runs before merge, the way Kane CLI handles a UI check before a PR ever lands.
Author

Anubhav Singhmaar
Blogs: 39

Anubhav Singhmaar is an AI Product Manager at TestMu AI driving Kane CLI, the command-line tool that brings browser automation to the terminal, turning natural-language flows into runs in a real Chrome browser that return pass or fail with shareable proof. He owns the roadmap and prioritization and works with engineering to ship developer-facing features. Before TestMu AI, he spent over four years at Sprinklr owning enterprise voice AI across APAC and EMEA. A mechanical engineer turned product manager, he grounds guidance in real QA workflows.


Frequently asked questions
Did you find this page helpful?
More Related Blogs
TestMu AI forEnterprise
Get access to solutions built on Enterprise
grade security, privacy, & compliance
- Advanced access controls
- Advanced data retention rules
- Advanced Local Testing
- Premium Support options
- Early access to beta features
- Private Slack Channel
- Unlimited Manual Accessibility DevTools Tests