

Power Your Software Testing with AI Agents and Cloud
The Native AI-Agentic Cloud Platform to Supercharge Quality Engineering. Test Intelligently and Ship Faster.


- TestMu AI (Formerly LambdaTest)
- /
- Learning Hub
- /
- Value Stream Mapping in Software Development: A Complete Guide With Examples
Value Stream Mapping in Software Development: A Complete Guide With Examples
Learn Value Stream Mapping (VSM) to optimize workflows, reduce waste, and improve productivity in software development and manufacturing processes.
Last Updated on:
On This Page
- What Is Value Stream Mapping?
- Purpose of Value Stream Mapping
- How Does Value Stream Mapping Work?
- Value Stream Mapping Symbols
- Value Stream Mapping Examples
- Value Stream Mapping Process for Software Development
- Applying Value Stream Mapping in Software Development
- AI Tools for VSM
- Overcoming Challenges in Value Stream Mapping
- Conclusion
- Citations
Value stream mapping is a lean method that charts every step, delay, and handoff in a delivery process to show where work creates value and where it stalls. Toyota's production system introduced the current-state and future-state mapping technique that software teams now apply to code reviews, testing cycles, and release pipelines.
This guide covers what value stream mapping is, its purpose, how it works, its symbols, real examples, the software development process, applying it, automating it with AI, and overcoming common challenges.
OVERVIEW
Value Stream Mapping (VSM) is a key method for understanding and improving organizational processes. It creates a visual diagram showing how materials, information, and activities flow through the process, highlighting areas where performance falls short, waste occurs, and improvements are needed.
This process provides useful insights into where value is added and where it is lost, giving engineers, developers, product managers, and testers a better idea of how they can improve the process to make it efficient.
Key Takeaways
- Value stream mapping is a lean method that charts every step, delay, and handoff in a delivery process to show where work creates value and where it stalls.
- Toyota's production system introduced current-state and future-state mapping, and software teams now apply the same technique to code reviews, testing cycles, and release pipelines.
- A value stream map is built from four elements: the customer who drives demand, the supplier who supplies raw material, the product flow through each step, and the information flow behind scheduling.
- Value stream mapping runs in ten steps, from understanding the customer problem and defining scope to a Gemba walk, data collection, waste identification, and an action plan for implementation.
- The waste categories a value stream map looks for are overproduction, conveyance, waiting, excess processing, motion, and correction, and each one marks a step that adds no value for the customer.
- VSM symbols fall into process, material, information, and general groups, covering the data box, supermarket, production kanban, kaizen burst, and the timeline used to calculate lead time and cycle time.
- AI platforms such as LinearB and Jellyfish build a current-state map from commit, pull request, deployment, and issue-tracker timestamps, then refresh it continuously instead of letting a workshop map go stale.
- Testing becomes a bottleneck in the value stream through slow execution and manual setup, and cloud platforms such as TestMu AI run tests across 3,000+ browser and OS combinations to shorten that stage.
What Is Value Stream Mapping?
Value stream mapping is a method that displays all the processes required to provide a product or service to clients. It’s also called material- and information-flow mapping. This approach focuses on giving value to customers while saving resources and reducing waste.
Here, value refers to anything a customer is willing to pay for, while steps that don’t add value are considered waste. Customers and employees care about what they receive, not how hard it is to create. Thus, value stream mapping helps project managers design and improve workflows from start to finish.
This method organizes steps, people, materials, and inventory data into a flowchart-like map. It uses diagrams and symbols to show how materials and information move through a process. Steps are labeled as value-adding if they contribute to the product or service or non-value-adding if they cause delays. By using this method, businesses can identify and fix issues like bottlenecks and wasted resources.
The process begins with mapping the "current state" to show how things work right now. Then, a "future state" map is created to show how the process should ideally work. Repeating this helps teams focus on what adds value and improve their workflows.
Although it’s mainly used in lean manufacturing, value stream mapping can be helpful in any industry to improve ability and focus on delivering value.
If you want to improve the manufacturing process, simplify software development, or enhance service delivery, implementing VSM at every stage brings a better impact on how processes are executed.
It helps you identify bottleneck delays and inefficiencies. With value steam mapping, teams can make informed data-driven decisions that help enhance overall productivity and reduce waste.
Elements of a Value Stream Map
A value stream map includes four key elements.
- The customer: They drive the system with data on daily demand, ensuring efficient operations.
- The supplier: They track raw material flow, helping with cost and inventory management.
- Product flow: They visualize each production step, from raw materials to the final product.
- Information flow: They ensure smooth operations through communication tools for restocking, scheduling, and demand tracking.
These elements together help streamline the production process.
Purpose of Value Stream Mapping
Value stream mapping, a key part of the lean methodology, has proven to be very useful in enhancing production processes. Its main goal is to reduce waste and improve the process by focusing on minimizing unnecessary effort.
Here are its main purposes:
- Reduces Waste: It identifies stages in the process that do not add value for the end customer and helps you eliminate or minimize them.
- Increases Efficiency: Its analyzing factors like cycle time and takt time, helps eliminate delays and unnecessary resources, improving the overall input-to-output ratio.
- Supports Growth: It creates a foundation for scaling operations and implementing new product ideas effectively.
- Improves Collaboration: It promotes better communication and teamwork across departments, from sourcing and production to logistics, ensuring everyone has clear and adaptable roles.

Note: Improve collaboration, reduce waste, and streamline the production process by focusing on delivering overall productivity effectively. Try TestMu AI Now!
How Does Value Stream Mapping Work?
Value stream mapping is a simple process to implement. However, you might not always need a specialist to help you create a map for your business workflow.
Below are the ten steps to carry out value stream mapping effectively:
- Understand the Problem: In this step, it is important to clearly identify the customer's issue or need, such as slow delivery, high prices, or unmet demand. Assess whether your product or service adequately addresses these problems. Ensure everyone on the team understands the problem, as this clarity will guide the mapping process.
- Define the Scope of the Map: In this step, you must define the start and end points of your map. The map focuses on the product’s journey, highlighting the value-adding steps and removing the unnecessary ones.
- Conduct the “Gemba Walk”: In this step, it is important to go through the production process, ideally multiple times, to spot waste and gain a true understanding of how things work.
- Identify the Key Steps: In this step, you must list all the processes and functions that add value for the customer, including information flow and identifying areas of waste.
- Show the Flow of Work: In this step, you must map the activities by adding arrows to show the direction of materials and information. This highlights value-adding steps in the center of the map and shows other steps with vertical arrows.
- Collect Relevant Data: In this step, you must collect data on each process, including information like processing times, resources, inventory, working hours, and daily customer demand.
- Add Data to the Map and Create a Timeline: In this step, you must add the data you’ve gathered to the map, such as resources, workers, time spent on each process, and any shipping or packaging time.
- Identify the Waste: In this step, you must look for the waste in the process; the waste can fall into six categories:
- Overproduction: Making more than necessary.
- Conveyance: Unnecessary movement of goods.
- Waiting: Idle time due to delayed resources.
- Processing: Using more resources than needed.
- Motion: Time spent searching for tools.
- Correction: Fixing errors that slow down production.
- Review and Refine the Value Stream Map: In this step, you must review the value stream map, remove the unnecessary parts, and create the final version; you can also create an ideal future map to show what the process should look like once goals are achieved.
- Create an Action Plan for Implementation: In this step, you must not create a plan with clear, actionable steps and continuously monitor the progress and make adjustments as needed to ensure success.
Value Stream Mapping Symbols
Following are the common symbols that you can use for developing value stream mapping.
VSM Process Symbols
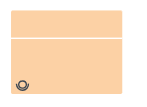
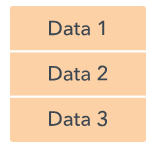
The VSM process represents specific activities or steps in the workflow, including the processes, decisions or delays; you must create a visual structure to map and analyze the flow of work effectively.
- Customer/Supplier: This symbol is placed in the upper-left or upper-right corner of the map to represent either the supplier or the customer. It marks the starting or ending point of material flow.
- Dedicated Process Flow: This symbol represents a single department, process, or machine with a fixed and continuous material flow.
- Shared Process: This symbol represents a process, department, or work center that is shared by multiple value stream families.
- Data Box: This symbol represents a data box that is required to be analyzed. It provides additional information such as shipping frequency or batch size.
- Workcell: This symbol represents that multiple processes are integrated into a manufacturing work cell.



VSM Material Symbols
VSM material represents the flow of materials, such as inventory, shipments, or material movement. It uses a visual structure to track the movement of the products across the process and highlight the areas of improvement.
- Inventory: This symbol below represents inventory between two processes. It can also show stored inventory. If needed, the inventory count can be included below the symbol.
- Shipments: This symbol below represents where the materials are coming either from suppliers or if the finished goods are being shipped to customers.
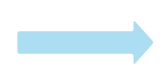
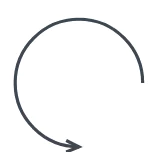
- Push Arrow: This symbol below represents that materials are pushed from one process to another.
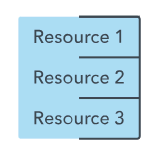
- Supermarket: This symbol below represents the Kanban stock point where inventory is available for downstream customers as it’s restored by the upstream supplier.
- Material Pull: This symbol below represents the physical removal of stored inventory from supermarkets.
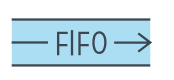
- FIFO Lane: This symbol below represents the First-In-First-Out (FIFO) system to limit inventory input, with the maximum capacity written.
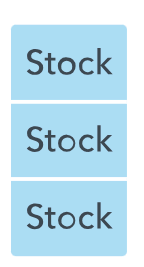
- Safety Stock: This symbol below represents the temporary safety stock used to avoid issues caused by system failures or other disruptions.
- External Shipment: This symbol of the truck represents the shipments to customers or from suppliers.



VSM Information Symbols
VSM information represents the flow of information; the symbol below identifies bottlenecks, waste and areas of improvement in a VSM process.
- Production Control: A simple box symbol that represents a centralized department for production scheduling or control.
- Manual Information: Represents information flowing through memos, reports, or conversations. The type of information can be specified.
- Electronic Information: This symbol represents digital information flow, such as through the Internet, Intranet, or Electronic Data Interchange.
- Production Kanban: Indicates the production required to supply parts to a downstream process.
- Withdrawal Kanban: This symbol represents a card instructing an operator or material handler to move parts from a supermarket to a process.
- Signal Kanban: Used when inventory in a supermarket reaches a minimum level, signaling the production of more parts.
- Kanban Post: A location for collecting Kanban signals is often found near a supermarket. It is used in a two-card system to exchange withdrawal and production Kanban.
- Sequenced Pull: A pull process that instructs a subassembly process to produce parts for a specific customer order without the need for supermarket storage.
- Load Leveling: A tool used to batch Kanbans to balance the variety and volume of production.
- MRP/ERP: Represents inventory control systems like Material Requirements Planning (MRP) used for scheduling.
- Go See: Represents the collection of information through direct observation, often by a supervisor checking inventory.
- Verbal Information: This represents information passed through verbal communication.











VSM General Symbols
The VSM represents various general elements in a process, such as processes, suppliers, customers, and material flows. The symbol below helps visualize and analyze the overall workflow.
- Kaizen Burst: This symbol represents critical problem areas that need improvement, marking processes for a future-state map.
- Operator: This symbol represents the number of operators required to process a specific value stream family at a workstation.
- Other Information: This symbol represents space for any additional helpful information.
- Timeline: This symbol represents the timeline is placed at the bottom of the map to show waiting and processing times, used to calculate lead time and cycle time.
- Transportation Symbols: This symbol represents various transportation methods, such as rail (train), air freight (airplane), and boat shipments.
- Forklift: This symbol represents that the items need to be moved by forklift.
- Expedited: This symbol represents the products or information that are expedited for faster delivery.
- Milk Run: This symbol refers to a vehicle picking up or delivering items at multiple locations, often on a fixed route.
- Warehouse: This symbol represents either an internal or external warehouse.
- Cross-Dock: This symbol refers to trucks that allow materials to move directly from inbound to outbound shipments.
- Orders: This symbol represents the sales or purchase orders.
- Phone: This symbol represents communication via phone, such as telephone orders.
- Batched Kanban: This symbol represents the Kanban cards arriving or being sent in batches.
- Control Center: This symbol represents a centralized control for managing Kanban processes.
- Quality Problem: This symbol represents the quality issue anywhere in the value stream.
- Solution/Improvement: This symbol represents the suggested ideas or solutions for process improvements.

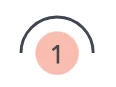

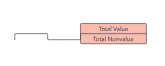




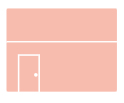
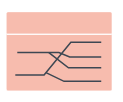





Key Takeaway: Value stream mapping symbols are grouped into process, material, information, and general sets. Process symbols mark customers, suppliers, dedicated and shared processes, data boxes, and work cells. Material symbols cover inventory, shipments, push arrows, supermarkets, FIFO lanes, and safety stock. Information symbols cover production control and the kanban variants, and general symbols add the kaizen burst, the operator, and the timeline that gives lead time and cycle time.
Value Stream Mapping Examples
Here are some of the examples of value stream mapping and its applications in the software development process:
Example 1: Code Development Process with VSM
In software development, VSM improves the code development process. Developers often face delays during the transition between teams, particularly between requirement gathering, design, and development. The team realized that development couldn’t begin until the design was completed, leading to idle time for developers.
By adopting agile development practices, the team started working in parallel, allowing development to begin even if some parts of the design were still being worked on. This change reduced waiting times and increased overall productivity.
Example 2: Bug Fixing Process with VSM
Bug fixing was made easy by implementing the VSM workflow into the software development process. Previously, after the bugs were found, they went through an unclear defect triage process, which caused delays in setting priorities. Sometimes, developers worked on less important bugs while more urgent ones waited.
To fix this, the organizations used VSM to identify inefficiencies and introduced an automated bug tracking system for bug prioritization. This allowed developers to address critical issues first, leading to faster resolutions. They also added automated regression testing, which speeds up the validation of fixes.
Example 3: Release Management with VSM
In the release management process, the organization had trouble with slow approval and inconsistent deployments. With the help of the value stream mapping, the process found that manual steps were causing delays.
By implementing a continuous integration and continuous delivery pipeline and automating the deployment process, they reduced errors and accelerated the release cycle. This new process allowed teams to deploy new features more frequently and consistently without delays caused by manual intervention.
Example 4: User Support Process with VSM
To improve user support, organizations used VSM to resolve customer queries before the VSM support team had to manually log and escalate these issues, which led to slow response times. Using VSM, the team set up an automated feedback loop, allowing users to track the status of their customer-reported issues. They also introduced better prioritization of bugs and requests based on severity, reducing response times and improving communication between development and support teams.
Value Stream Mapping Process for Software Development
There are certain steps to follow to ensure smooth information flow. These steps will also provide the data needed for future reference and create a clear path to deliver customer value. Remember that value stream mapping can be continuously improved and refined over time.
Here are the main steps when creating a value stream for your software development process:
- Establish the Scope with the Customer’s Perspective in Mind: In this step, you must clearly define the need for the software product or feature that is being delivered. Once you have defined what needs to be streamlined, then it becomes important to use VSM. It must not cover the entire process; instead, you must break the project into sections and develop a value stream for each segment. Multiple value streams can run simultaneously, allowing you to track each separately. Defining the scope for each part is the starting point of your mapping process.
- Identify Each Step of the VSM and Use Visual Representation: In this step, you must identify each step of the value stream process and create a visual representation. This involves mapping the entire workflow, starting from the initial stage, such as a customer/business idea or request for a new product or feature that you have identified earlier, to documenting everything that needs to happen from beginning to end to understand the process clearly.
- Choose the Right People: In this step, you must ensure to recognize all individuals engaged in every phase of the process, including designers, engineers, developers, and others accountable for completing the task. Distributing appropriate responsibilities to suitable individuals is crucial for success. However, you must also ensure that every individual has the skills, resources (tools or finances), and motivation necessary to deliver value on time.
- Develop a Current State Map: In this step, you must document each step of the current workflow. Doing this will give you a clear view of your starting point. Consider using an analytics platform that provides data into complex dashboards without requiring manual input. This can help you understand where problems are arising and what’s causing delays in the delivery process.
- Does the team have the right tools?
- Are there too many dependencies between teams?
- Is there too much waiting time during transferring data or knowledge?
- Create a Future State Map: In this step, you must create a future state map that helps you turn your goals into a concrete visual of the deployment process. Think about how you want the delivery process to look, from the initial idea or client request to the release.
- Implement Changes:In this step, use metrics to analyze the data collected in the value stream lifecycle and identify areas that are holding you back. Visualize this data using dashboards, which will help you make informed decisions. Implement the necessary changes for quality assurance to improve the overall software development process.
By creating the visuals, you can get a clear picture of the workflow. This visual data helps in investigating issues and making informed decisions to improve the process, and tracking timelines for each step becomes crucial as it highlights where delays occur, helping you identify inefficiencies and optimize workflows for a more efficient process from start to finish.
Ask questions like:
Address these questions to identify potential bottlenecks that could negatively impact the deployment process. The results of this analysis will provide valuable insights.
Walk through the entire value stream and create a map of the ideal steps. This future state map serves as a benchmark, allowing you to compare it to the current state map and identify inconsistencies. It helps pinpoint areas that need optimization and gives you a chance to improve them during the process or use this model in the future.
Key Takeaway: A software value stream starts by scoping one segment of delivery from the customer point of view, then maps every step visually, assigns the designers, engineers, and developers responsible, and documents the current state. The future state map is the benchmark the current state is measured against, and the metrics gathered across the value stream lifecycle decide which changes are implemented.
Applying Value Stream Mapping in Software Development
Value stream mapping in software development offers practical benefits that focus on improving workflows and reducing risks. It helps you utilize resources effectively, reduce unnecessary time, money, and effort, and optimize your team's energy. When these elements are managed effectively, the implementation process becomes more seamless, facilitating the growth of your business.
This value stream management helps uncover gaps and bottlenecks throughout the process, from the initial idea to production. It can highlight feedback loops, unnecessary rework, and extra steps that slow down progress.
By mapping your workflow, you can see exactly where transitions occur and pinpoint delays or wait times that might be delaying the process by holding up approvals, resource allocation, or task completion.
In the software development life cycle, tasks follow a clear, repeatable structure, where continuous delivery depends on collaboration between team members with different expertise. This establishes a shared understanding of the workflow is essential to ensure efficiency and alignment.
Value stream mapping helps with this by:
- Reducing Delays: It identifies areas where work stalls, helping you eliminate unnecessary waiting.
- Improving Communication: It makes the process of collaboration smoother across teams.
- Speeding up Delivery: A well-organized workflow allows you to complete tasks faster.
- Avoiding Rework: Mapping makes it easier to find potential problems early so you can fix them before they grow.
- Supporting Lean Practices: It helps create a steady, predictable flow of value for customers.
Additional Benefits of Value Stream Mapping in Software Development
- Shorter Cycle Times: You can deliver working software more quickly by cutting down on delays and unnecessary steps.
- Streamlined Workflows: Mapping provides a clear overview of the journey from concept to delivery, highlighting bottlenecks and areas ripe for enhancement.
- Better Quality: Tracking of key performance metrics helps you catch defects and address delays, leading to better results.
How Are AI Tools Automating VSM Now?
AI-driven engineering intelligence platforms now build and refresh a value stream map automatically from Git, CI/CD, and issue-tracker data, replacing the one-time whiteboard workshop with a live, continuously updated view.
Most guides to value stream mapping still recommend a manual workshop with whiteboards, sticky notes, or diagramming tools such as Miro and Lucidchart. AI-based platforms remove that manual step from the data-collection stage:
- Automatic data capture: Tools such as LinearB and Jellyfish pull commit, pull request, deployment, and issue-tracker timestamps to build the current-state map without a manual walkthrough.
- Continuous refresh: The map updates itself as new commits and deployments land, instead of going stale the day after a one-time workshop.
- DORA metric correlation: Automated platforms line up deployment frequency and change lead time, two DORA metrics, against each mapped stage to show which step drags the pipeline down the most.
- Automatic bottleneck flagging: The platform flags a stage once its cycle time crosses a set threshold, instead of waiting for a quarterly review to catch it.
- Limited context capture: An AI-generated map still misses the qualitative friction a human Gemba walk finds, such as why a handoff feels slow to the team doing it.
This removes part of the resource-use challenge covered next: teams still decide which flow to map and what to do with the result, but the platform removes the days of manual data-gathering that used to come before that discussion.
Overcoming Challenges in Value Stream Mapping
While value stream mapping is a valuable tool, it does come with a few challenges:
- Resource Use: Creating a value stream map can take a lot of time and resources. It often requires reaching out to multiple teams and stakeholders, which can be tough for companies with disconnected structures or inefficient ways of gathering the necessary process data.
- Change Management: Implementing the changes suggested by value stream mapping can be costly and may require shifting resources, which can be difficult.
- Dealing with Unknowns: Value stream mapping and the changes it suggests don’t always improve the workflow. It also can’t predict changes in customer needs or determine which workflow might work best for a different product.
- Testing: Testing often becomes a bottleneck in the value stream due to slow execution, lack of proper coverage, and manual inefficiencies.
Solution: To overcome the resource use, you must break the project into smaller groups and map them to specific sections of the workflow rather than the entire process. You can also make use of collaborative tools and software to help you streamline the data collection process and encourage cross-team participation.
To further enhance it, you can build a central repository to process data and reduce inefficiencies and inconsistencies while gathering information. You must ensure that your team is regularly trained on using value stream mapping to improve familiarity and reduce setup time in future exercises.
Solution:To overcome change management, you must prioritize the changes happening based on the impact versus the cost to focus more on what actually matters first. To help you prioritize, you can use pilot programs to help you implement changes incrementally; this allows teams to adapt to the changes made in the process gradually. You must also involve stakeholders early in the process to secure buy-in and allocate necessary resources effectively. Communicate the potential causes and long-term benefits of these issues, such as increased efficiency and cost savings, to justify initial investments.
Solution: To overcome the challenge of dealing with unknowns, you must treat value stream mapping as an iterative process. Based on feedback and evolving needs, you must revisit and refine it regularly. With this iterative process, you can incorporate flexibility into the workflow and adapt to unexpected customer demands or product changes. You can also use predictive analytics and customer feedback mechanisms to better predict future needs and integrate them into the value stream map.
Solution:With the right tools and processes, you can accelerate the testing phase, thus reducing the time wasted on setting up test environments. Cloud testing platforms like TestMu AI seamlessly align with the principles of value stream mapping by providing an automated and scalable cloud-testing platform that allows you to run tests across 3000+ browsers and OS configurations.
This platform also provides you with real-time insights and helps you streamline the feedback loop by allowing you to integrate with the best CI/CD tools where QA teams can communicate the issues to the developer without any delays for faster resolution of issues, continuous delivery, and improved overall product quality.
Key Takeaway: The main obstacles to value stream mapping are the time and effort of gathering data across teams, the cost of acting on what the map shows, uncertainty about future customer needs, and testing that stalls the pipeline. Mapping smaller segments, prioritizing changes by impact against cost, revisiting the map as needs change, and moving test execution to a cloud platform each answer one of those obstacles.
Conclusion
Value stream mapping is an effective process that enhances workflows and boosts productivity in software development and various other fields. It works by showing the entire process, spotting areas of waste, and simplifying the work. This allows teams to make the best use of their resources and deliver more value to customers. While using VSM can present challenges, such as managing resources and handling change, its ability to improve productivity and reduce waste makes it an important practice for continuous improvement.
Citations
- Value stream mapping for the software development process:https://citeseerx.ist.psu.edu/document?repid=rep1&type=pdf&doi=79c2d50d68651a2c5fd47937340fd5aff24c43dd
- Enhancing Productivity with Value Stream Mapping: A Manufacturing Case Study: https://www.redalyc.org/journal/474/47471683002/html/
- Value stream mapping in product development: https://publications.lib.chalmers.se/records/fulltext/158883.pdf
Author

Anmol Gupta
Blogs: 6

Anmol Gupta is Vice President of Product Management at TestMu AI (formerly LambdaTest), driving HyperExecute, the test orchestration cloud that runs and accelerates automated test execution. He led the development of the Unified Test Execution Cloud Platform and now leads a 30-member cross-functional product organization across product lines contributing $7M+ in revenue. He brings over nine years of experience and previously co-founded the SaaS company Timble as CTO, where he grew the team from 5 to 40 and launched an AI KYC platform that processed 600K+ applications in five months while cutting verification time from 12 minutes to under 30 seconds. Anmol holds an MTech and BTech from IIT Delhi.
Reviewer

Garvit Sukhija
Reviewer
Garvit Sukhija is a Technical Product Manager at TestMu AI (formerly LambdaTest), where he leads the HyperExecute GUI, having spearheaded its development and pilot rollout to early adopters by integrating user insights and metric analysis into the go-to-market strategy. Before TestMu AI he owned the zero-to-one build of an enterprise SaaS platform for Earth Observation at Pixxel, where he designed billing, subscription, and IAM systems and led AI/ML model onboarding for over 10 solutions. Garvit holds a degree in manufacturing engineering and chemistry from BITS Pilani.


Value Stream Mapping FAQs
Did you find this page helpful?
More Related Learning Hubs
TestMu AI forEnterprise
Get access to solutions built on Enterprise
grade security, privacy, & compliance
- Advanced access controls
- Advanced data retention rules
- Advanced Local Testing
- Premium Support options
- Early access to beta features
- Private Slack Channel
- Unlimited Manual Accessibility DevTools Tests