

Power Your Software Testing with AI Agents and Cloud
The Native AI-Agentic Cloud Platform to Supercharge Quality Engineering. Test Intelligently and Ship Faster.


- TestMu AI (Formerly LambdaTest)
- /
- Blog
- /
- How to Compare One Flow Across Browsers Without Invalidating the Result
How to Compare One Flow Across Browsers Without Invalidating the Result
A cross-browser difference only means something when the browser is the only thing that changed. Here is how to run a controlled sweep in one live session.
Published on:
A cross-browser difference is only evidence when the browser is the one thing that differed. Run the flow in Chrome, run it again in Edge, and if anything else moved between those two runs, the difference you are looking at has more than one candidate explanation.
That is easy to get wrong, because some of the variables move without being touched. This walkthrough follows one bug from the ticket arriving to the fix being verified, and every step is about keeping the comparison valid.
Engines really do disagree, and the vendors keep a public list of where. Interop 2026, run jointly by Apple, Bocoup, Google, Igalia, Microsoft, and Mozilla, tracks 20 focus areas where browsers still fail to behave identically, including dialogs and popovers, scroll snap, view transitions, and WebRTC.
That is what makes cross browser testing worth running as a controlled comparison. It is also what makes a sloppy one expensive, because a real engine difference and a variable you moved by accident look identical on screen.
TL;DR
- A cross-browser difference is only evidence when the browser is the one thing that changed between the two runs.
- Resolution, network profile, geolocation, and the test data are frozen before the first step, because each one competes with the browser as an explanation.
- The first run belongs on an engine where the flow already works, so every later run has a reference to be measured against.
- Switching configuration in a TestMu AI real-time session provisions a fresh virtual machine, so sessionStorage and localStorage read back empty and the site issues a new session id.
- The session idle timeout defaults to 5 minutes and raises to a maximum of 60, so a long walkthrough needs it changed before the first step rather than after the machine ends.
- Interop 2026 tracks 20 focus areas where browser engines still fail to behave identically, which is what makes a controlled comparison worth running.
The Bug Report
A support ticket says the confirmation screen at the end of a quote request renders blank in Edge. There is no screenshot, no console output, and no browser version.
The flow that reaches that screen has six steps: contact details, item details, coverage options, add-ons, review, confirmation. Reaching step six means completing steps one to five first, on every browser you want to check.
The usual approach ends the session, picks a new configuration from the launch screen, and retypes those five steps. Each relaunch is a chance for the window size, the connection, or the data you enter to come out slightly different, and any of those can produce a blank screen. The sweep below stays in one session and changes the browser underneath it instead.
What Do You Freeze Before the First Step?
Decide these once and leave them alone. Each is a variable that would otherwise drift between runs and compete with the browser as an explanation.
- Resolution - pick one and leave it. A layout that breaks at a narrower width is a responsive bug, and it will look exactly like an engine bug if the window size moved too.
- Network profile and location - leave both at their defaults for this sweep. A timeout on a throttled run and a currency switch from a different exit IP both read as rendering failures.
- The test data - put it somewhere you can paste from. Retyping it on each engine means a typo at step three becomes a difference at step six.
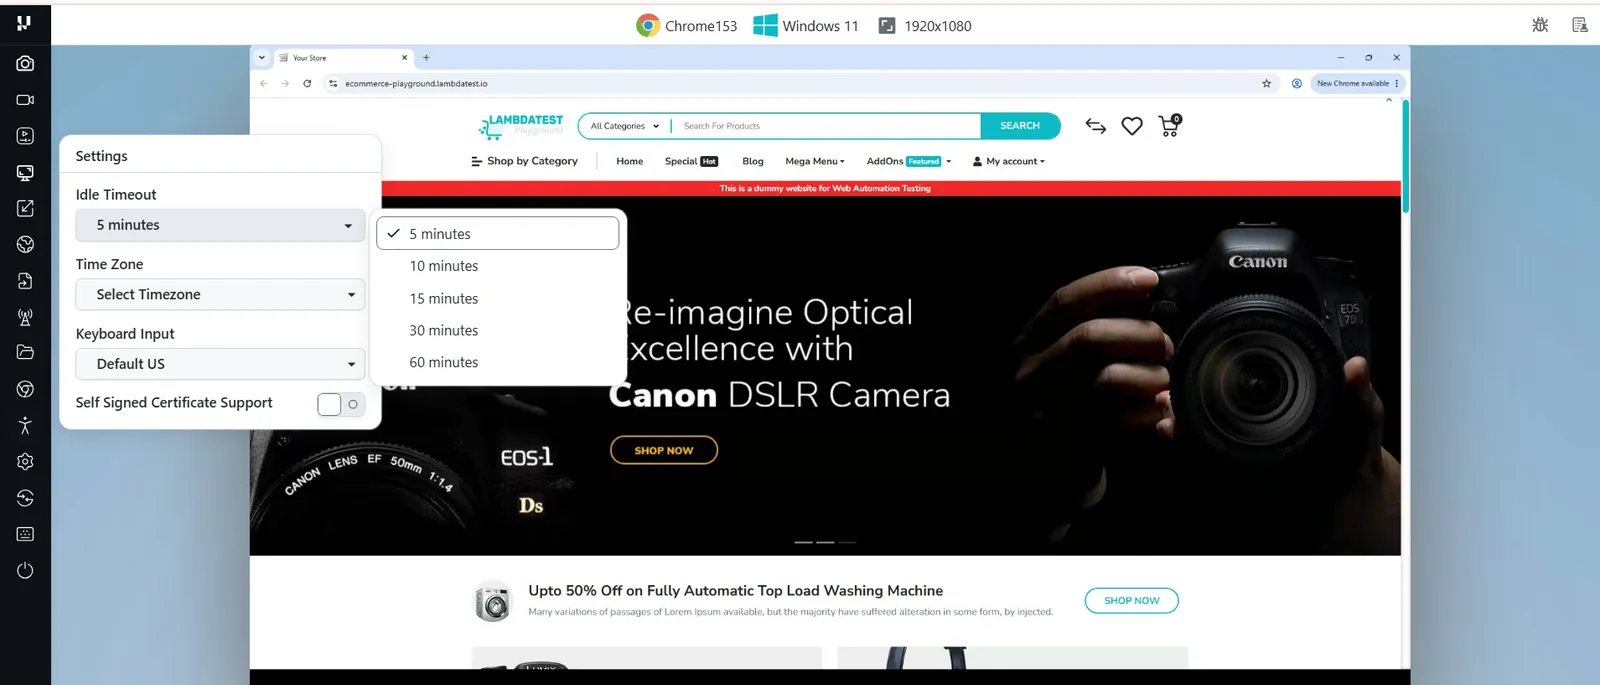
- The idle timeout - open Settings in the session toolbar and move it off the 5 minute default. The dropdown offers 5, 10, 15, 30, and 60 minutes. This one does not affect validity, but it ends the machine while you are reading a stack trace, and the restart is where the other three drift.
If the build is not publicly reachable, start the tunnel now rather than partway through, for the same reason.

Note: TestMu AI Real-Time Testing gives you live, hands-on sessions across 3,000+ browser, OS, and virtual device configurations, with DevTools, geolocation, and network simulation built into the same toolbar. Try it free!
Step 1: How Do You Establish the Reference?
Launch the session on Chrome, the engine where the flow is known to work. You are not hunting the bug yet. You are recording the thing every later run gets measured against, because a difference needs something to differ from.
- Walk all six steps, pasting the test data rather than typing it.
- Screenshot the confirmation screen. It lands in the session gallery and stays there after the machine changes, which is what lets you compare rather than remember.
- Open DevTools and read the console. A warning that is already present in Chrome stops being evidence when it reappears in Edge, and you can only know that by looking now.
- Note the browser version. The ticket did not name one, so yours becomes the recorded baseline.
A sweep that skips this step can still find a broken screen. What it cannot do is say whether the screen was ever working.
Step 2: Which Variable Changes Without You Choosing It?
Open Switch from the session toolbar, pick Edge at its current version on the same operating system, and confirm. TestMu AI provisions the new configuration and it replaces Chrome on screen without the session ending.
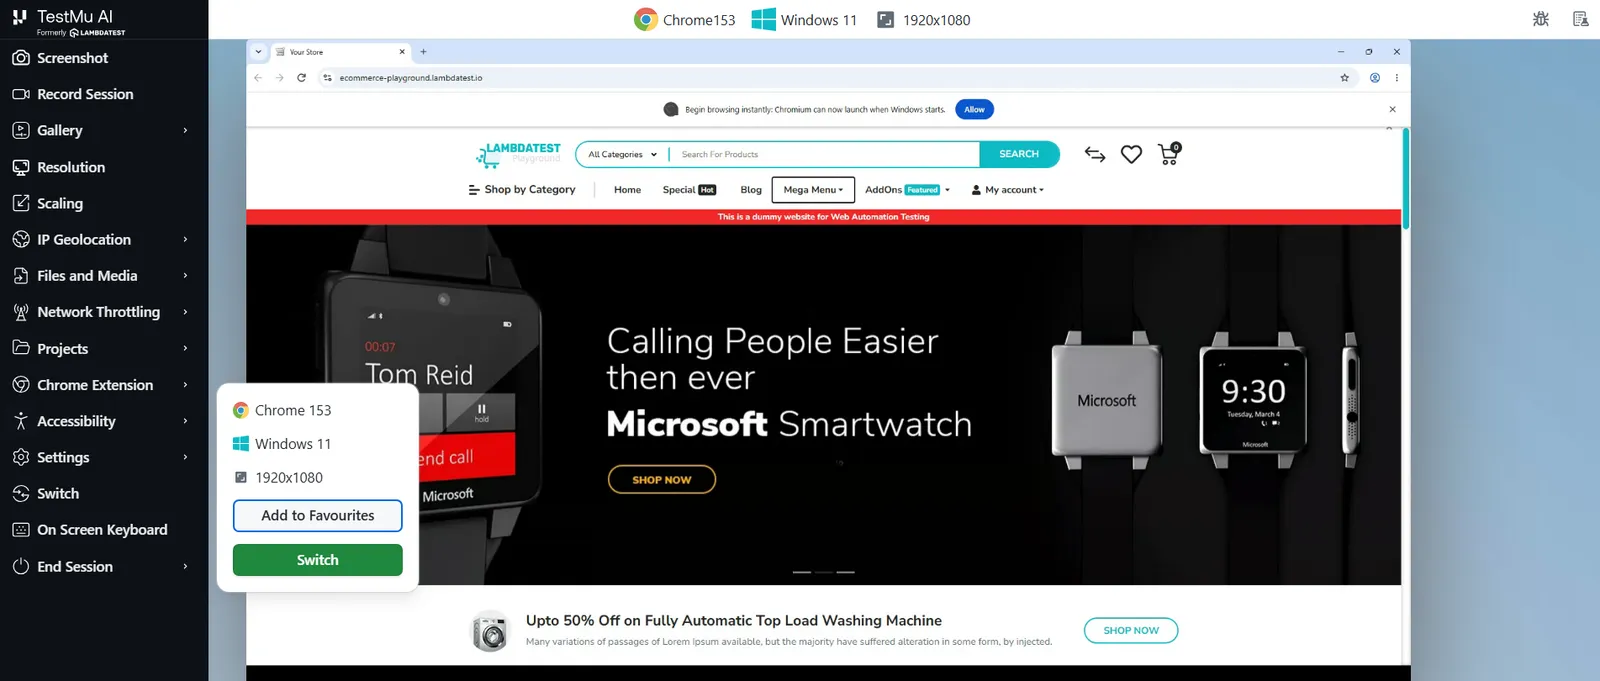
What comes back is a fresh virtual machine, and that is the variable nobody chooses. Your settings survive. Your browser state does not.
| What you set up | Survives the switch? | Why it matters here |
|---|---|---|
| Session settings | Yes | Idle timeout, time zone, and keyboard input language belong to the session, so they stay frozen for you. |
| Tunnel to a local build | Yes | The new configuration reaches the same private URL, so you are still testing the same build. |
| Screenshots and recordings | Yes | The Chrome reference image stays in the gallery, which is the only reason a comparison is possible. |
| Cookies and login state | No | New machine, new browser profile. The cookies you had are gone and the site issues a fresh session id, so you arrive as a new visitor rather than the one who reached step five. |
| sessionStorage and localStorage | No | Both are scoped to the profile that wrote them. A flow that reads saved state now starts from nothing. |
| Typed form data and scroll position | No | Page state lived in the tab you replaced, so every step has to be re-entered identically. |
Checking this in a live session makes it concrete. Writing to sessionStorage, localStorage, and a cookie in a Chrome session, then switching to Edge and reading them back on the same URL, returns null for both storage areas and a set of freshly issued cookies rather than the one written minutes earlier.
So walk the six steps again, pasting the same data. Signing in beats re-walking the flow as a guest where the option exists, because server-side state does come back and it comes back the same every time.
Step 3: What Do You Do When the Bug Appears?
The confirmation screen comes up blank in Edge, exactly as reported. Capture everything before you move on, because this machine goes away the moment you switch again and takes the evidence with it.
- Open DevTools first - read the console and the network tab while the broken state is on screen. A failed request here is the difference between a report that says the screen is blank and one that says which call returned nothing.
- Capture and annotate - screenshot the blank screen and mark up what should have been there, against the Chrome reference image.
- File it from inside the session - Mark as Bug pushes the annotated screenshot to one of 65+ trackers with the browser, OS, device, resolution, and URL already attached. Those attached conditions are the record that the comparison was controlled.
Record the session too when the bug is intermittent. A developer who can watch the six steps play out does not have to trust your account of what you entered.
Step 4: How Do You Widen the Sweep?
One failing engine and one working engine tell you a difference exists. More engines, under the same frozen conditions, tell you what kind of difference it is.
- Switch to Firefox - a different engine from both Chrome and Edge. If it also breaks, the diagnosis moves from a single vendor quirk toward something closer to a standards gap, and the fix is more likely to belong in your code.
- Switch to Safari - the engine most likely to disagree with the other three, and the one your team is least likely to have on hand locally.
- Finish on a virtual mobile device - the same control moves you to an Android emulator or iOS simulator. This one deliberately changes two variables at once, engine and viewport, so treat anything it finds as a new question rather than part of this answer.
- Screenshot the confirmation screen on each, whether it works or not. A passing engine is evidence too, and it narrows the search for whoever picks up the ticket.
The gallery now holds five screenshots of one screen across five configurations, taken under conditions that did not move. That last clause is what makes them comparable.
When Is the Result Invalid, and How Do You Recover?
A finding with two possible explanations is not a finding. These are the ways a sweep loses that property, and what it costs to get it back.
| What you see | Why the result does not hold | What to do |
|---|---|---|
| Engine B differs, and you also changed the resolution or network | Two candidate explanations, no way to separate them | Reset the second variable and repeat the step. Reintroduce it on its own once the engine difference is confirmed. |
| You entered the data by hand on the second engine | A typo is indistinguishable from a rendering bug at step six | Paste from the same source on every run, and re-run the engine you typed on. |
| You are signed out after switching | Expected, and a state difference until you fix it | Sign in again before walking the flow, or seed through an account so server-side state returns identically. |
| The session ended while you were reading something | Idle timeout still at the 5 minute default | Raise it to 60 minutes in settings and restart the walkthrough, re-freezing the conditions as you go. |
| The new configuration cannot reach your build | You are no longer testing the same code | Terminate the existing tunnel before starting a new one for a different directory or configuration. |
Re-walking six steps costs a few minutes. A developer chasing an engine bug that was really a viewport change costs considerably more, and the ticket comes back.
How Do You Verify the Fix?
The ticket comes back fixed. Verification is the same sweep under the same frozen conditions, which is why recording them on the ticket was worth the effort.
- Start on Edge, the engine that failed, at the version recorded earlier. A fix verified on a newer version proves less than it appears to.
- Walk the six steps with the same pasted data and compare against the annotated screenshot on the ticket.
- Switch back to Chrome and confirm the fix did not break the engine that was working, which is the regression this kind of bug invites.
- Re-check any other engine that failed in the first sweep before closing.
Changing the conditions between the first sweep and this one gives you a pass you cannot rely on. Same resolution, same data, same version, or the verification proves nothing about the bug you filed.
Wrapping Up
Next time a ticket names one browser, freeze the resolution, the data, and the connection before you start, establish the reference on the engine that works, then switch through the rest. Expect to sign in again on every hop, and treat any run where a second variable moved as a question rather than an answer.
A controlled sweep like this is manual by design. Once you are repeating it every release, it belongs in an automation cloud run, where the conditions are pinned in configuration instead of in your memory.
You can start on TestMu AI's live testing platform, and the real-time desktop browser testing tools documentation lists every control that sits in the session toolbar next to Switch.
Author

Naima Nasrullah
Blogs: 15

Naima Nasrullah is a Community Contributor at TestMu AI, holding certifications in Appium, Kane AI, Playwright, Cypress and Automation Testing. She writes practical, hands-on content that helps QA engineers and developers build reliable test automation frameworks across web and mobile platforms. Drawing on her expertise in automation testing, Naima breaks down complex tools and workflows into clear, actionable guidance that readers can apply directly to their own projects and testing pipelines.
Reviewer

Shubham Soni
Reviewer
Shubham Soni is a Senior Member of Technical Staff at TestMu AI (formerly LambdaTest), building the Real Device Cloud and real-time testing infrastructure. He optimized the WebRTC services that power live testing to sub-100ms latency with adaptive bitrate streaming, led a frontend migration from Angular to React that cut page load time from 5-6 seconds to 1-1.5 seconds, and contributes to the official Device SDK. He led a team of four to build an accessibility testing product covering manual and automated testing and mentored a team of six on a real-time testing product. He brings over eight years of experience and earlier scaled a cloud code platform to 200K+ monthly users. Shubham holds a B.Tech in Computer Science.


Cross-Browser Comparison FAQs
Did you find this page helpful?
More Related Blogs
TestMu AI forEnterprise
Get access to solutions built on Enterprise
grade security, privacy, & compliance
- Advanced access controls
- Advanced data retention rules
- Advanced Local Testing
- Premium Support options
- Early access to beta features
- Private Slack Channel
- Unlimited Manual Accessibility DevTools Tests